

Weekly #78: TSMC Beat Every Line, The Market Yawned. That's the Setup
Portfolio +24.6% YTD, 3.2x the market since inception. Plus, TSM's revenue +40.6%, margins highest in a decade, full-year guide raised, but TSM underperformed SOX by 12 points. That’s the setup.


Hello fellow Sharks,
The positive developments regarding the Iran war pushed the market to all-time highs, but the portfolio still outperformed the market 🤑
If you want to skip straight to the numbers, jump to the Portfolio Update.
Last week I realized that having worked 18 years in the corporate world ingrained some habits that I have no use for anymore. But they are so ingrained that I don’t realize they are there. Some are good, like my research approach, attention to detail and project management. But for example, last week I realized I am working 5.5 days a week (Mon-Friday plus half of Sunday). But I realized I can change the schedule as I want. I’d rather work on Sundays when the market is quiet and take Friday off. So my new weekdays are Sunday to Thursday and my weekend is Friday and Saturday. Interesting project, let’s see how it goes.
Another observation this week was that the easing of tension in the Strait of Hormuz caused one of our energy stocks to decline 15% (after it increased 73% since it was picked as the December Stock Pick).


People said I should have taken profit as this was “obvious”. But they are missing a huge point that I am not “trading individual stocks” but rather each position has a role in the portfolio. I have positions that benefited from the decline in oil prices, so no matter what happens to oil prices, the portfolio will balance itself. The critical part is picking the best companies in each sector so that gradually the portfolio will generate alpha no matter what happens in the macro environment. This is an important concept and I will dedicate a full Thought Of The Week on it in the future.
But for today, in the Thought Of The Week, I go over the Q1 2026 earnings results for our beloved TSM.
Enjoy the read, and have a great Sunday.
~George
Table of Contents:
In Case You Missed It
On April 13, I sent the trade alert for the April Stock Pick.

On April 15, I followed up with the deep dive.

This is not some generic industrial name hoping to catch a cyclical bounce. It supplies specialized materials and components that go into some of the most demanding aerospace and defence applications in the world. In several cases, it holds deeply embedded positions that are difficult to replace, not because management says so on a slide deck, but because qualification cycles are long, technical requirements are brutal, and customers cannot afford mistakes. Over the last several years, the business has reshaped its portfolio, pushed further into higher-value end markets, and materially improved margins. Management is guiding for more growth ahead, and the market has noticed. The stock is trading near its highs.
The stock is already up 1.6%.
Paid subscriber? Click here for the unredacted list.
Thought Of The Week
The Market’s Yawn Is the Opportunity, TSM’s Q1 2026 Earnings Review
Since adding TSM to the portfolio, it is up 119%, the 6th-best performance in the portfolio.
, Celestica (CLS), Sterling Industries (STRL) and TSMC (TSM)")
TSM reported Q1 2026 earnings on 16 April. The company beat on every line…
 latest quarter’s earnings. It beat both top and bottom line")
…raised full-year revenue guidance, guided Q2 revenue well above consensus…

…and quietly told investors that capex for 2026 will come in at the high end of the $52-56B range. Management also disclosed a new N3 fab in Tainan, a second N3 fab in Arizona, a second N3 fab in Japan, and a firm 2028 timeline for A14. Every incremental data point in this print tightened the thesis I’ve been running on this stock for more than a year.
And the market’s response? A shrug.
TSM is up 8.21% since I refreshed my target to $565 in Weekly #65.

Over the same stretch, the SOX index is up 20.54%, SMH [SMH 0.00%↑] 15.93%, Nvidia [NVDA 0.00%↑] 8.3%, ASML [ASML 0.00%↑] 7.45%. The single most important company in the semiconductor supply chain has underperformed its own index by roughly 12 points in the strongest fundamental setup of the cycle.
That is the update. The fundamentals accelerated; the price didn’t. I’ll walk through what Q1 2026 actually delivered, how it maps onto the five original thesis pillars I laid out in the deep dive last March, what it does to my DCF, and why my conviction on TSM is higher today than at any point since I started writing about this company.
TLDR
Trigger: Q1 2026 earnings on 16 April. Revenue $35.90B (+40.6% y/y), EPS $3.49 per ADR (+55.7% y/y), operating margin 58.1%. Every line beat.
Thesis status: All 5 original pillars confirmed, 4 strengthened. None challenged.
Biggest change: FY2026 revenue guide raised to above 30% growth (from mid-20s), and 2026 capex now tracking to the high end of $52-56B. Growth is accelerating, not decelerating.
Verdict: Conviction increased. $565 target maintained pending the next formal DCF refresh. Any short-term weakness below $260 is a gift.
The full update, thesis scorecard, earnings detail, guidance comparison, DCF implications, new risks, and the updated conviction call, is below.
Thesis scorecard
I’m going to walk through each of the five pillars from the original deep dive, track how each one has evolved through the Q2, Q3 and Q4 2025 reviews, and grade it against what Q1 2026 just delivered.
Pillar #1. Technical monopoly at the leading edge: Confirmed (strengthened)
Original thesis: TSM is the only foundry on earth that can manufacture 3nm and below at commercial volume. Intel has stumbled. Samsung can’t yield. The gap is structural.
Evolution: This pillar has been scored Confirmed in every prior update. Q3 2025 brought N2 risk-production timing in; Q4 showed N2 customer tape-outs running ahead of N3 and N5 at the same stage.
What happened since last update: Management disclosed that N2 is on track for HVM in Q4 2026, with customer tape-outs still pacing ahead of both N3 and N5 at the equivalent lifecycle point. A16 moves into HVM in H2 2027. Most interesting, management formally confirmed A14 for HVM in 2028 with a narrower, more confident product roadmap than in any prior call. They also announced three new N3 fabs (Tainan, second Arizona, second Japan) on top of the three already running.
Assessment: Stronger. Intel Foundry’s Q1 setback on 18A and Samsung’s continued inability to close the yield gap mean TSM’s leading-edge monopoly is arguably less contested today than when I started this thesis a year ago. Pillar 1 is the clearest Confirmed in the scorecard.
Pillar #2. Structural AI demand: Confirmed (strengthened)
Original thesis: AI accelerator demand compounds at +40% through 2028 and TSM captures most of the wafer economics through both logic (GPU/ASIC) and CoWoS packaging. The model rested on AI accelerator revenue doubling in 2025 and mid-40% growth in 2026.
Evolution: Q2 2025 showed AI-accelerator revenue on track to double; Q3 reaffirmed; Q4 saw HPC hit 53% of sales, and management pointed to another year of AI-driven growth in 2026.
What happened since the last update: HPC hit 61% of revenue in Q1 2026, up from 53% in Q4 2025 and 51% in Q3 2025. Smartphones collapsed to 26% of the mix. Management raised the full-year 2026 revenue guide from “mid-20% y/y” to “above 30% y/y”, a material lift, and specifically called out AI accelerator revenue continuing to grow at a strong pace, though off a much larger base. Capex guidance moved to the high end of the $52-56B range; CoWoS capacity is sold out through 2027.

Assessment: Stronger. The mix is now so skewed to HPC that any incremental AI capex, hyperscaler, sovereign, or enterprise, flows through TSM before it reaches anyone else in the stack. The original deep dive had AI as a tailwind. Q1 2026 makes it look like a secular regime shift.
Pillar #3. Pricing power ahead of the cost curve: Confirmed (strengthened)
Original thesis: TSM can re-price new nodes at premium ASPs, absorb overseas cost dilution, and hold gross margin in the 53-58% band over the cycle.
Evolution: Q2 2025 GM was 58.6%, Q3 59.1%, Q4 59.0%. Each print came in at or above the top of the original 53-58% band.
What happened since last update: Q1 2026 gross margin printed 66.2%, with operating margin at 58.1%. That’s the highest gross margin the company has posted in years. Q2 2026 guidance calls for 65.5-67.5% GM. Management attributed the step-up to a richer product mix (HPC, premium nodes), favourable cost efficiencies, and the N3 node finally crossing company-average profitability. They explicitly said N3 gross margin now crosses the corporate average in H2 2026.

Assessment: Stronger. The original thesis band of 53-58% GM is now a floor, not a mid-point. Long-term, management reiterated that a 53%+ GM and 25%+ ROE remain the structural targets but then added something new on the call: they now view +56% as the structural long-term floor and mid-20s% to high-20s% ROE as the new normal. If the base case is 56%+ GM through cycle rather than 53%, the DCF moves materially.
Pillar #4. Moat driven by scale, capex cadence and customer lock-in: Confirmed
Original thesis: TSM’s combination of installed base, customer co-design relationships, and its ability to spend $30-50B per year on capex while still earning mid-20s% ROE keeps the competitive set structurally narrow.
Evolution: Every quarter has reinforced the moat. The recurring read has been that TSM’s $52-56B 2026 capex is a competitive weapon that none of Intel, Samsung, or GlobalFoundries can match.
What happened since last update: Capex 2026 is now tracking to the HIGH end of $52-56B, not the mid-point. That implies roughly $56B in gross capex in 2026 vs. roughly $40B at Intel Foundry (including IDM Inc. internal spend) and Samsung Foundry combined. Six new fabs announced over the cycle (three N3 fabs just in this update alone), A14 confirmed for 2028. The second Arizona fab is being accelerated to production “several quarters ahead of schedule.” If there was any doubt that TSM would use its balance sheet to extend the moat, this print removes it.
Assessment: Confirmed without reservation. No peer can credibly match this scale of reinvestment without destroying returns.
Pillar #5. Mispricing relative to earnings power: Confirmed (strengthened)
Original thesis: TSM traded at a semiconductor-cyclical multiple while earning a software-like return profile. The market was pricing in cycle risk that the business doesn’t have anymore.
Evolution: In every update since Q2 2025, the gap between the market’s cyclical framing and the business’s secular earnings profile has widened. Target price marched from $338 to $370 to $565.
What happened since last update: TSM has underperformed SOX by roughly 12 points since 18 January. Same business, same mix, stronger guidance, higher margins, bigger capex, and a lower relative multiple. The market is doing me a favour.
Assessment: Stronger. The mispricing thesis is now more compelling than it was in January, both in absolute and relative terms.
Scorecard summary
5 of 5 pillars confirmed. 4 strengthened (technical monopoly, AI demand, pricing power, mispricing). 1 confirmed without upgrade (moat).
Q1 2026 earnings: the actual numbers
Here are the headline numbers vs. consensus, prior-year comparables, and what my DCF model was projecting for the quarter.

The revenue beat is material, but the margin beat is what matters. Gross margin came in 630 basis points above consensus and 670 basis points above what my model assumed for the quarter. Operating margin beat by over 800 basis points. That level of variance, this late in a reporting cycle, tells you two things: the Street is underestimating the structural step-up in product mix, and the internal cost curve is moving faster than anyone outside the company can model.
Segment/platform mix tells the story. HPC revenue came in at 61% of sales vs. 53% in Q4 2025, 51% in Q3 2025, and 48% in Q1 2025. Smartphone dropped to 26% from the mid-30s a year ago. Each percentage point of mix shift from smartphone to HPC is margin-accretive because premium nodes and advanced packaging carry structurally higher ASPs and better incremental margins. There is nothing cyclical about a mix shift driven by AI accelerator demand; the cycle is not arriving, it’s already here.
On the balance sheet, cash and securities stand at NT$2.52T (roughly $77B), long-term debt declined modestly, and the company raised the Q1 dividend to NT$6/share. Net cash position strengthened sequentially despite $11.22B of Q1 capex. The financial profile hasn’t looked better in a decade.
On the call, management tone was crisp. No hedging on full-year guide, no “monitoring macro” qualifiers on AI demand, no softness anywhere in the commentary. The only risk flag raised, and management raised it themselves, was Middle East supply-chain exposure (chemicals and specialty gases). Note: this is a new risk that didn’t exist in prior calls.
Guidance comparison: what management just told us
Here’s the side-by-side on what management was guiding when I last wrote on 18 January vs. what they just guided on 16 April.

Every line in that table moved in the same direction. It is hard to overstate how unusual that is at this point in a cycle. Ordinarily, you expect at least one metric to go the wrong way, a mix lift here, a capex trim there, a margin give-back somewhere. Instead, revenue guide raised, capex raised, near-term margin guided well above Street, and the long-term structural profile upgraded. This is the definition of pricing power meeting scale.
Management credibility check
Over the last four quarters (Q2 2025 through Q1 2026), management has beaten its own prior-quarter revenue guide every single time, in two cases by more than $1B. Gross margin guidance has been beaten by 50-200 basis points in each of those quarters. The capex guide for 2025 was raised once (from a starting band around $40B to a finish around $40B actual) and 2026 capex is now moving toward the high end of its initial range. Pattern: this management team sandbags quarterly, over-delivers, and tends to lay out conservative guidance with upside bias.
Read: the Q2 2026 guide of $39-40.2B revenue and 65.5-67.5% gross margin should be treated as a floor, not a point estimate. I’d expect actual Q2 2026 to print above $40.5B revenue and +66% GM unless something breaks. Apply the same discount to the full-year “above 30%” guide, the realistic outcome is 31-34% YoY growth on reported currency.
Valuation: what Q1 2026 does to the model
The Q4 2025 DCF assumed mid-20% revenue growth for 2026, structural gross margin settling in the 57-58% zone, operating margin around 49-50%, and capex in the $52-55B band. Every one of those assumptions is now visibly conservative.
I’m maintaining the $565 target pending a DCF refresh later this year (I just refreshed it in January and I have more pressing positions to refresh first). The directional read is that the updated assumptions push the target higher, not lower, probably to the $600-640 zone on mid-case assumptions if I feed in the new margin profile, the high-end capex, and the management-guided revenue trajectory. I’ll size the formal update carefully in the next DCF run because the margin upgrade is the biggest swing factor and I want two more quarters of evidence before baking a 58% terminal GM into the model.
For the avoidance of doubt: $565 is a floor on the current set of assumptions, not a ceiling.
Risk register: what’s changed
None of the original risks has fully materialized. Taiwan geopolitical tension remains elevated but has not escalated to anything that would force a re-rating. Trade policy, specifically US tariff policy on semiconductors, is active but remains bounded. No material risk has hit the numbers in Q1 2026.
Faded risks
Intel Foundry as existential threat: Intel’s 18A ramp has stumbled again, capacity commitments from major customers are softer than feared a year ago, and the competitive picture in 2nm-class production is arguably more one-sided today than in March 2025. I’m moving this from “live risk” to “faded risk,” with the caveat that if Intel’s Panther Lake client volumes exceed expectations later in 2026, I’ll revisit.
N3 margin drag: Management explicitly confirmed N3 crosses corporate-average gross margin in H2 2026. This was a persistent concern in 2024-2025. It’s now effectively resolved.
CoWoS bottleneck: Capacity is fully sold through 2027, but management has aggressively built out CoWoS capacity and new packaging-focused fabs. I’d call this more of an execution story now than a risk.
New risks
Middle East chemicals and specialty gases exposure: Management flagged that regional instability could affect input costs for certain specialty chemicals and gases. The exposure is small in dollar terms but the tail risk is disruption of leading-edge production if supply is interrupted. What would it take to materialize: a major disruption to shipping routes or direct regional escalation. Magnitude: modest for 2026 (likely sub-1% of GM), potentially larger if compounded with other supply-chain shocks. I’m pricing this in as a discrete low-probability, moderate-impact risk.
HPC customer concentration: HPC is 61% of revenue. A large portion of that is concentrated in a small number of hyperscaler and fabless AI customers. Any one of those customers pulling back their AI capex by +20% would be visible in TSM’s results within a quarter or two. What would it take to materialize: a genuine hyperscaler spend plateau (not just a quarter of digestion). Magnitude: meaningful, could take 5-10 percentage points off revenue growth for a quarter or two. This risk didn’t exist in 2024 when the mix was more balanced; it’s a consequence of the AI-driven mix shift.
Terafab and the Tesla-Samsung LPU, first credible competitive signals in years: The Q1 call surfaced two under-discussed competitive developments. First, the quiet emergence of Terafab as a US-based alternative foundry play, still largely subsidy-dependent but now formally backed. Second, the Tesla-Samsung LPU announcement, where Samsung finally secured a marquee hyperscale-class customer for its 2nm process. Neither is a near-term threat to TSM’s book of business but both represent the first concrete signs that the leading-edge market may eventually have a third credible player. If either develops faster than I expect, I’ll need to revisit Pillar 4 (moat). For now: a risk to watch, not a risk to price in.
Unchanged risks
Taiwan geopolitical risk (the big one), currency risk (NT$ vs. USD), and customer concentration at the single-customer level (the largest customer remains a meaningful share of revenue) all continue to be priced in at the same weighting I used in the original deep dive. No update.
Relative performance: the market’s mistake
Since my last update, TSM is up 8.21%. Over the same period, the SOX semiconductor index is up 20.54%, SMH up 15.93%, Nvidia up 8.3%, and ASML up 7.45%. TSM has underperformed its own sub-sector by 12 points into the strongest fundamental print of the cycle.
, PHLX Semiconductor Sector (SOX), VanEck Semiconductor ETF (SMH), ASML Holding (ASML) and Nvidia Corp (NVDA)")
Reading the tape: the outperformers are the names the market perceives as pure AI plays. Nvidia’s run stalled briefly (it’s roughly matched TSM), but the equipment-and-materials cohort that dominates SMH has re-rated more aggressively than the foundry at the bottom of the stack. That’s an asymmetric mispricing. TSM is the single largest beneficiary of every dollar Nvidia books, every dollar ASML ships, and every dollar Broadcom earns on ASIC. The foundry is structurally late to re-rate because it’s measured on cyclical semiconductor multiples rather than the secular AI-infrastructure narrative.
If you’re asking whether the easy money has been made: no. If anything, the easy money is what’s been made by SOX and SMH over the last three months while TSM has been basically flat. The catch-up trade is what’s sitting there.
Verdict
Conviction on TSM is higher today than at any point since I initiated coverage. The fundamentals accelerated, the guide was raised across every line, the moat got deeper, and the stock underperformed its own index by twelve points. I’m holding the position unchanged and treating any retest below $260 as a gift.
$565 target maintained pending a formal DCF refresh. Directionally, the refresh should move higher.
Portfolio Update
The market continued its recovery due to the ceasefire with Iran. The portfolio outperformed the market, expanding our lead.

Portfolio Return
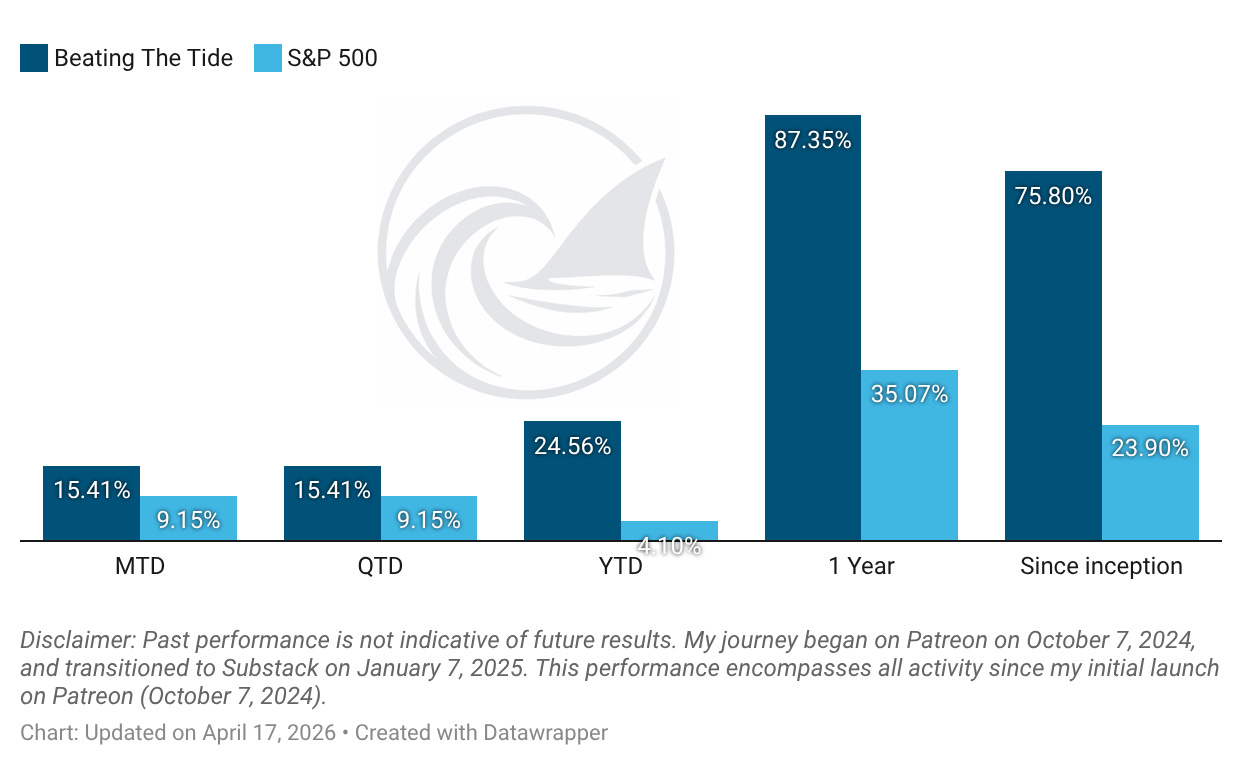
Month-to-date: +15.4% vs. the S&P 500’s +9.2%.
Year-to-date: +24.6% vs. the S&P 500’s +4.1%. That is a gap of 2,046 basis points.
Since inception: +75.8% vs. the S&P 500’s +23.9%. That’s 3.2x the market.
Contribution by Sector

Tech led the gains.
Contribution by Position
(For the full breakdown plus commentary on earnings results and the big movers, see Weekly Stock Performance Tracker)

+162 bps CLS 0.00%↑ (TSX: CLS) (Thesis)
+19 bps STRL 0.00%↑ (Thesis)
+14 bps DXPE 0.00%↑ (Thesis)
+11 bps POWL 0.00%↑ (Thesis)
+9 bps LRN 0.00%↑ (Thesis)
+4 bps CDE 0.00%↑ (Thesis)
+1 bps KINS 0.00%↑ (Thesis)
flat TSM 0.00%↑ (Thesis)
That’s it for this week.
Stay calm. Stay focused. And remember to stay sharp, fellow Sharks!
Further Sunday reading to help your investment process: