Weekly #54: Mr. Market Handed Us a Gift With LRN
Portfolio +34.3% YTD, 2.3x the market since inception. CLS jumped 15% after another stellar quarter, OPFI beat and raised guidance, and LRN gave us the kind of gift only panic can wrap.
Hello fellow Sharks,
October closed strong. The portfolio gained +5.7%, widening the outperformance gap versus the S&P 500. If you want, to skip straight to the numbers, jump to the Portfolio Update.
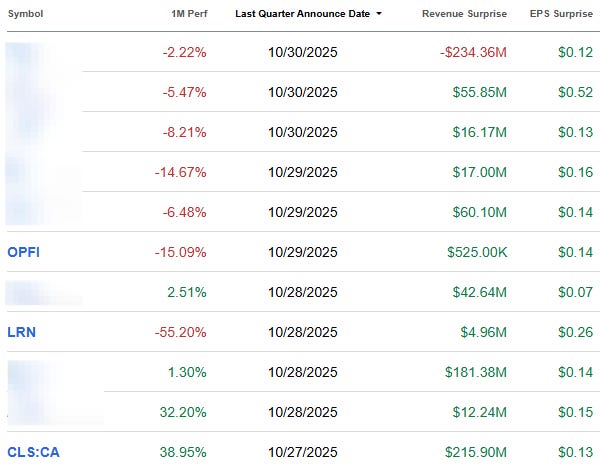
It was another packed earnings stretch. Eleven portfolio companies reported, and none missed EPS estimates. CLS had another stellar quarter and the stock jumped +15%. OPFI beat and raised guidance, yet the shares barely moved, a reminder that markets don’t always price logic in real time.
The Thought of the Week takes a deeper look at LRN. The stock got cut in half after a messy platform rollout, but I see a short-term hiccup in an otherwise solid story. Fundamentals remain intact, and long-term tailwinds are hard to ignore.
Enjoy the read, and have a great Sunday!
~George
Table of Contents:
OPFI Q3 2025: Record Revenue, Guidance Up, Shares Flat, +26% Since Inception
Thought Of The Week: LRN Stock Plunged 50% and I Doubled My Position
In Case You Missed It
On October 30 I published my deep dive on KT Corporation (KT 0.00%↑). The thesis: KT looks cheap on paper (about 5x forward earnings, 4 % dividend) and sits in a stable three-player Korean telecom oligopoly.
But the devil is in the details: returns have consistently failed to clear the cost of capital, capital allocation has been loose, and the company lacks a durable competitive moat.
Although KT might grind along and pay a dividend, it didn’t make it into the portfolio. The upside is limited, margin of safety wasn’t there and most importantly KT lacks a moat, so I passed.
Earnings Update: All 11 companies beat EPS Estimates
Since the last update, eleven portfolio companies released results. All companies beat EPS estimates and one missed revenue estimates.
CLS Q3 2025: Another Great Quarter. +557% Since Inception
Q3 was clean. Revenue reached $3.19B. Adjusted EPS came in at $1.58. Adjusted operating margin hit 7.6%.
All three beat guidance; all three point to the same driver: AI data-center demand pushing networking gear out the door.
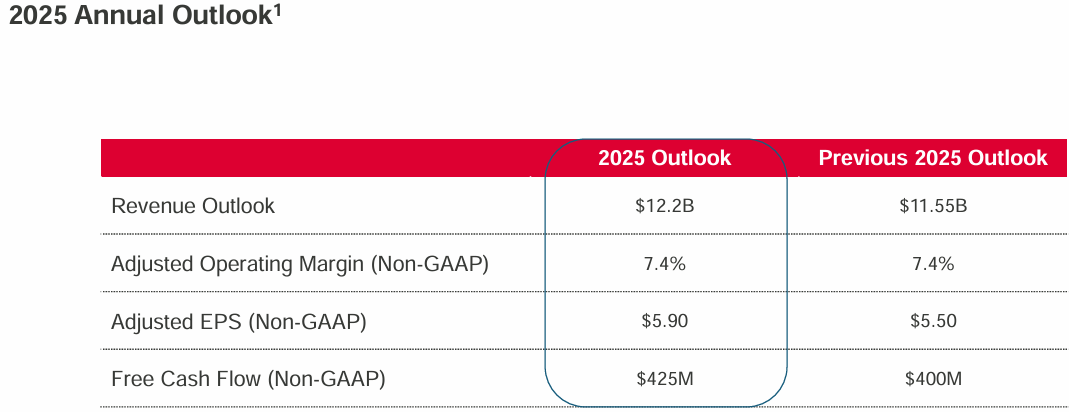
Management raised the 2025 outlook and posted a new 2026 bar. For 2025: revenue to $12.2B; adjusted EPS to $5.90; free cash flow to $425M; adjusted operating margin steady at 7.4%.
For 2026: revenue $16.0B; adjusted operating margin 7.8%; adjusted EPS $8.20; free cash flow $500M. The subtext is simple; the AI build is broad and durable.
What moved the quarter
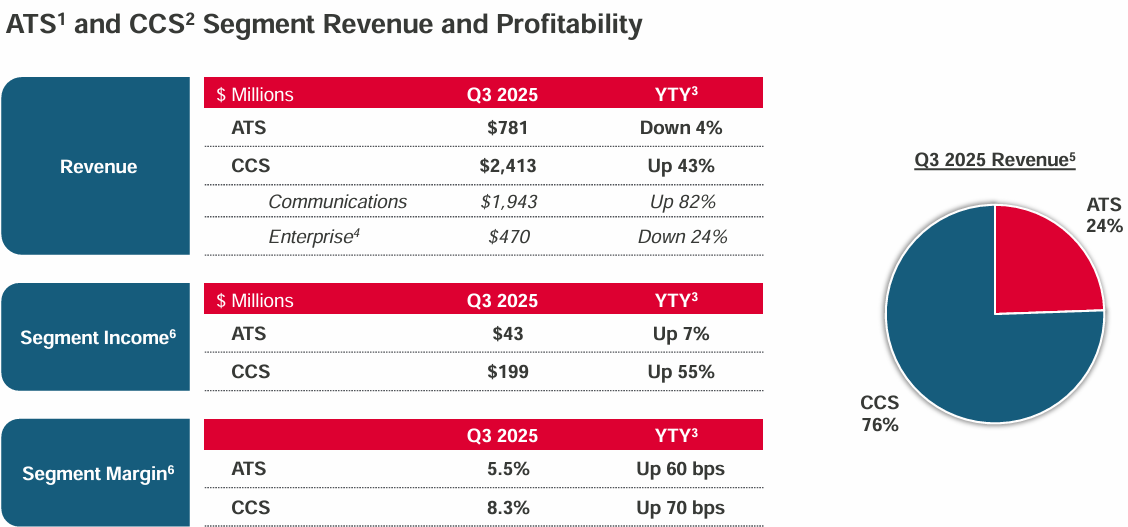
Celestica’s mix did the work. CCS, the data-center and networking segment, grew 43% y/y; it now represents 76% of total revenue.
HPS, the higher-value platform business inside CCS, was about $1.4B and 44% of company revenue; HPS rose 79% y/y as hyperscaler switch ramps accelerated. Enterprise fell 24% on an AI/ML compute transition at a single hyperscaler. Communications rose 82% on data-center networking strength.
Margins followed mix. CCS margin improved to 8.3% from 7.6% a year ago; operating leverage and more HPS helped. ATS margin improved to 5.5% from 4.9% even though ATS revenue dipped 4% after Celestica exited a margin-dilutive A&D program.
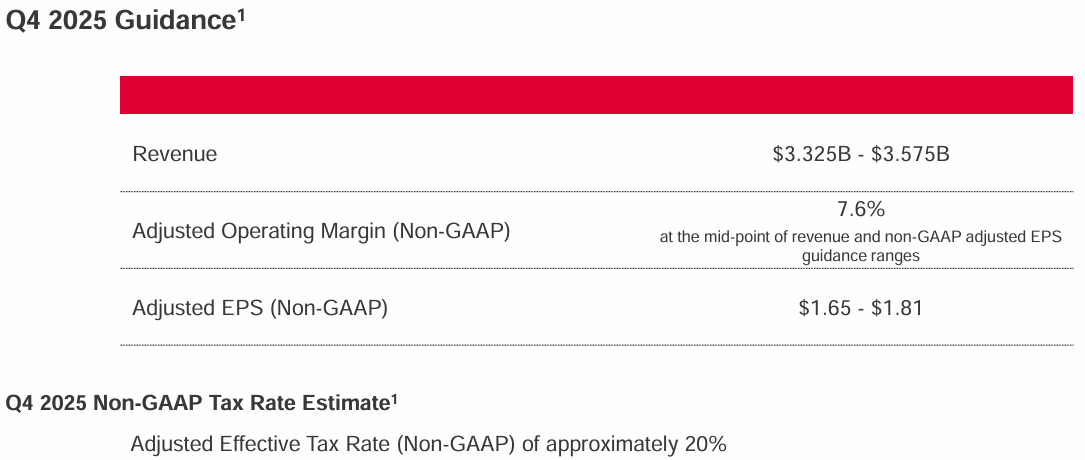
On guidance math, Q4 calls for $3.325B to $3.575B of revenue, adjusted EPS of $1.65 to $1.81, and about 7.6% adjusted operating margin at the midpoint.
Balance sheet and cash flow
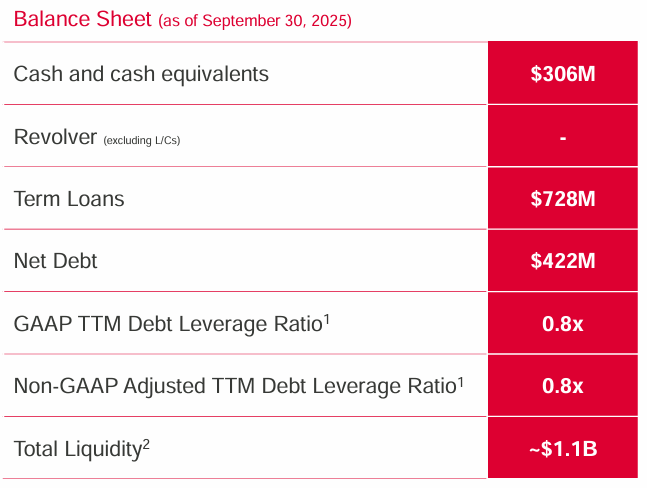
Cash sat at $306M at quarter-end; term-loan borrowings were $728M; no revolver draw.
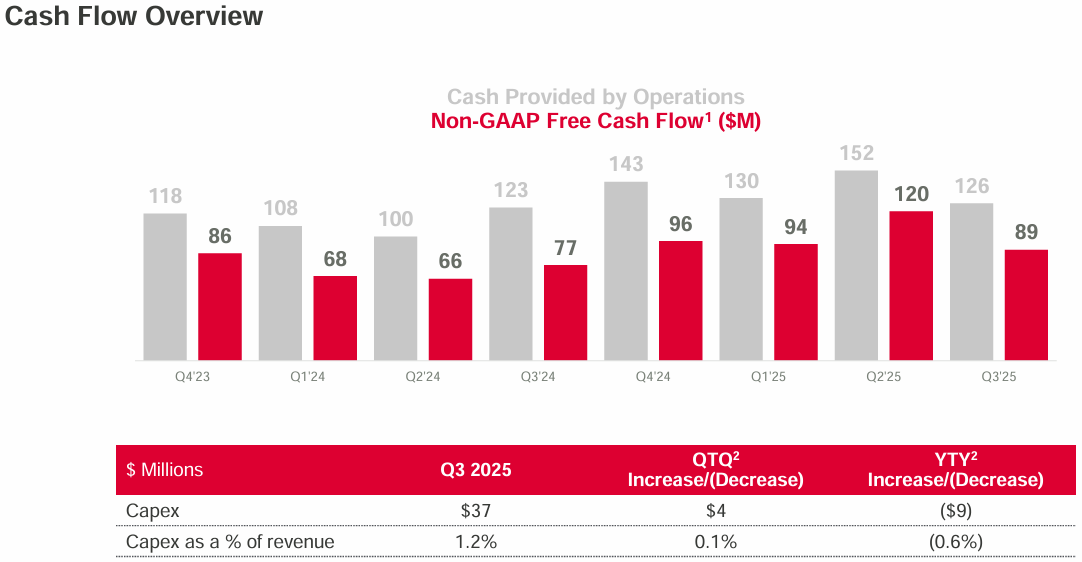
Operating cash flow for the quarter was $126M; YTD is $409M. Those are healthy numbers for a company still growing into a very large AI cycle.
Per-share math improves from here. The company plans to file for a fresh NCIB that would allow repurchases of up to 5% of the public float over the next twelve months once approved; the current NCIB expires October 31. If execution holds, that supports EPS growth.
What the new outlook says
Raising 2025 numbers this late in the year signals confidence; posting a 2026 bar signals visibility. Management’s 2026 framework calls for $16.0B of revenue and $8.20 of adjusted EPS at a 7.8% adjusted operating margin.
The language around demand is direct; the largest customers are still investing in AI data-center infrastructure; momentum can carry into 2027. That is useful if you are debating whether the networking wave is a one-off flush or a multi-year build.
Concentration and other risks
Three CCS customers were 30%, 15%, and 14% of Q3 revenue. That is high. The expectation is that the AI networking build broadens across buyers and geographies; for now, concentration amplifies both upside and downside.
There are macro and industry variables to watch. Data-center deployment timing drives q/q variability; customers can shift business among EMS and ODM vendors; tech standards move fast. Celestica has been investing in capacity in Thailand, Malaysia, and Richardson, Texas to keep up with AI programs; that is good preparation; it does not erase volatility.
Hyperscaler AI spend keeps climbing
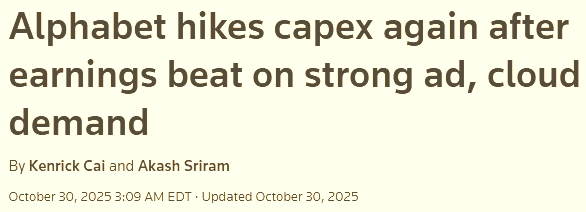
I care about the demand signal; hyperscaler capex is it. Alphabet (GOOG 0.00%↑) just lifted 2025 capex to $91–$93B and flagged a bigger step-up in 2026; that is AI infrastructure dollars for servers, data centers, and networking.
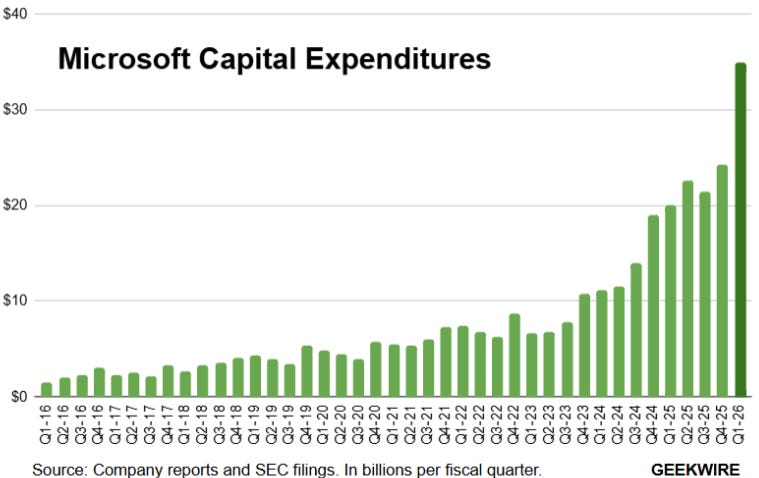
Microsoft spent a record $34.9B in the September quarter alone; about half went to GPUs and CPUs and a big chunk to data-center leases. Management expects capacity to keep tightening; they plan to roughly double the data-center footprint over the next two years.
Meta reaffirmed 2025 capex of $70–$72B and guided to even higher spending in 2026 to support its AI buildout.
These budgets buy racks; switches; optics; integration. That spills into Celestica’s HPS programs and supports the 2026 bridge the company outlined.
OPFI Q3 2025: Record Revenue, Guidance Up, Shares Flat, +26% Since Inception
Q3 delivered new highs; revenue hit $155.1 million, up 13.5% y/y; adjusted net income reached $40.7 million; adjusted EPS came in at $0.46.
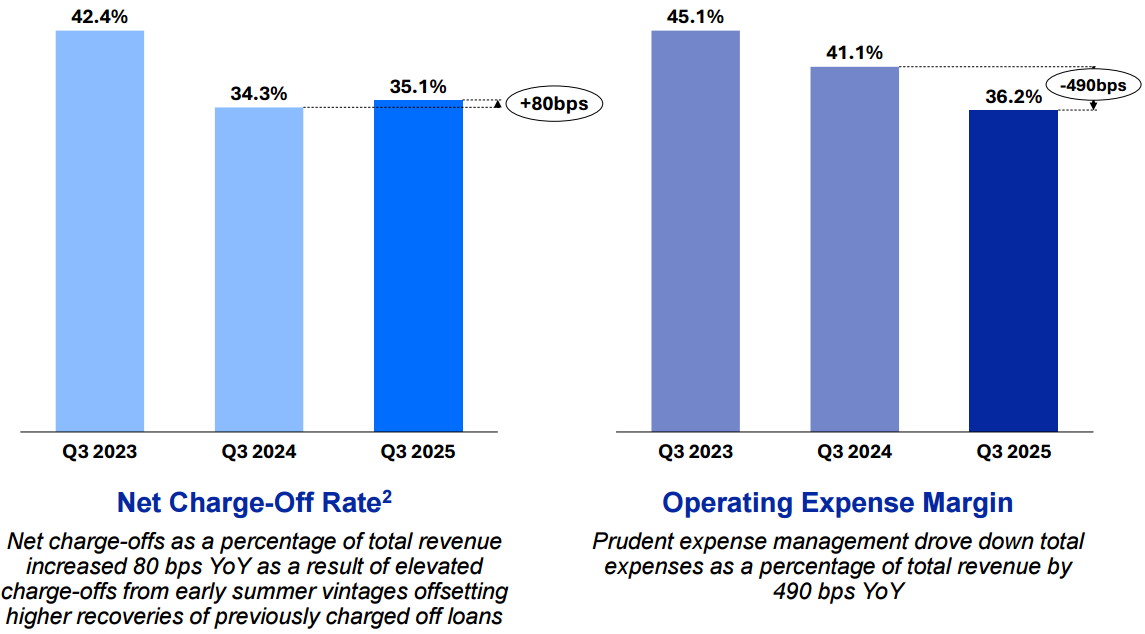
Operating leverage showed up; total expenses fell to 36.2% of revenue; net charge-offs ticked to 35.1% of revenue.
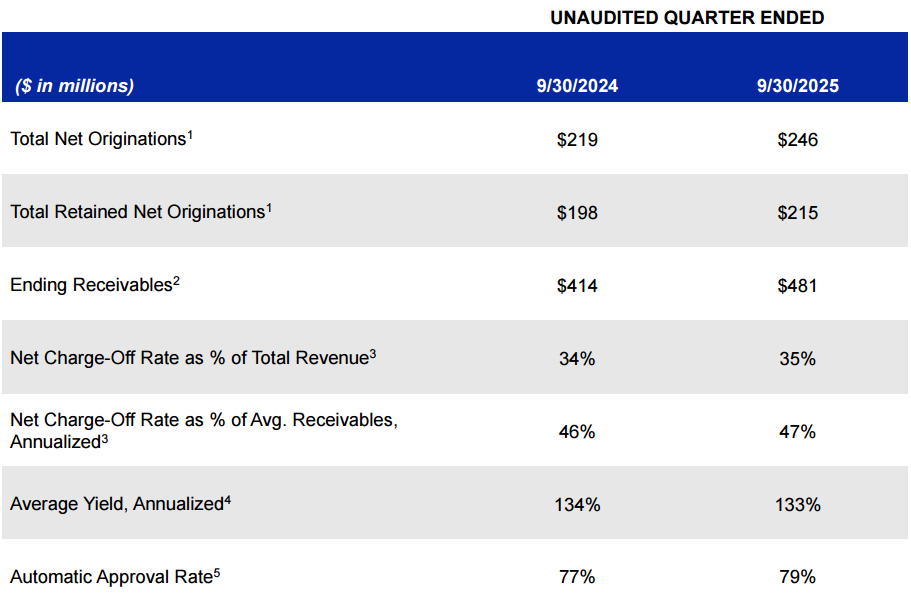
Auto approvals climbed to 79% and yield held at 133%.
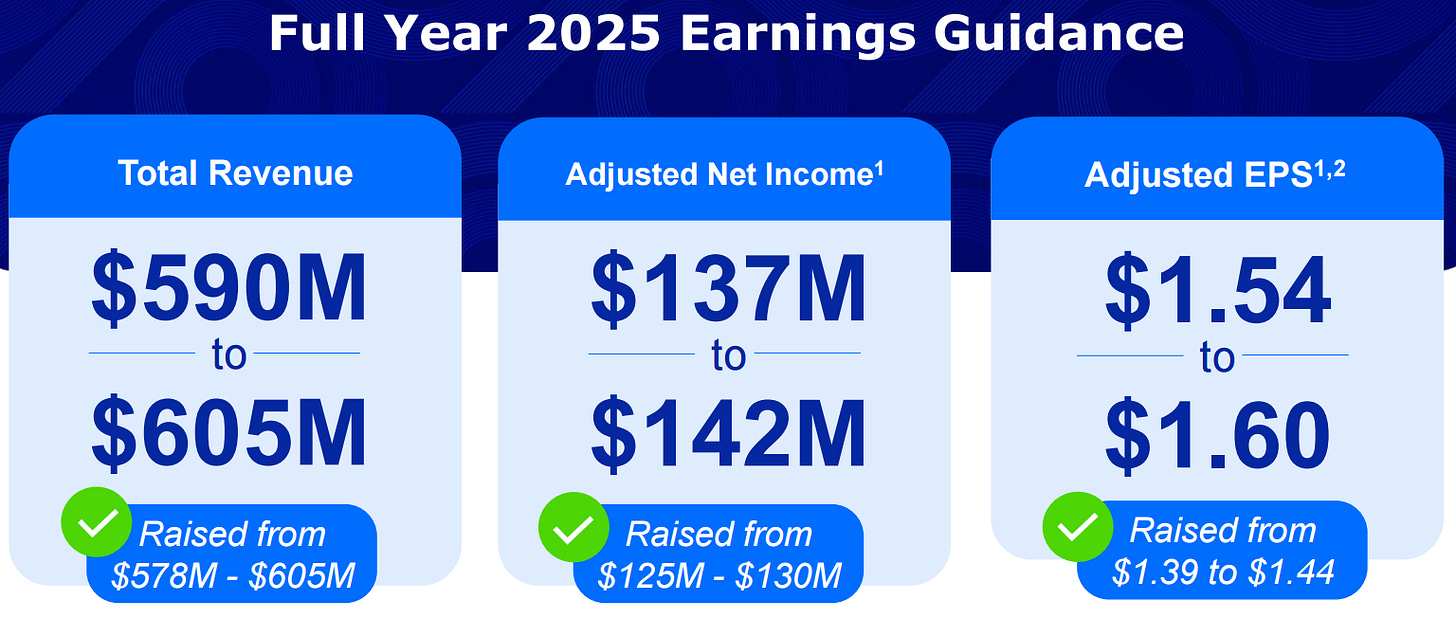
Management raised full-year guidance again to $590–$605 million of revenue; adjusted net income to $137–$142 million; adjusted EPS to $1.54–$1.60.
The balance sheet and capital moves were supportive; $75 million cash; $321 million total debt; $600 million total funding capacity with $204 million undrawn. OPFI repurchased 710,000 shares in Q3 for $7.4 million; it added 317,000 more post-quarter for $3.2 million. The Castlelake facility refresh lowered financing costs; Blue Owl upsizing helped liquidity. Bitty contributed $1.4 million of equity income.
Execution levers are lining up; Model 6.1 rolls out in Q4; full cutover in Q1 2026; LOLA migration also targeted for Q1 2026. Management called out early-quarter payment behavior that led to slight tightening; risk-based pricing is toggled weekly; CAC per customer rose by roughly $20–$30.
What I got right in the deep dive; the core thesis around operating leverage, automated approvals, and lower funding costs is playing out.
Expenses as a share of revenue moved down; interest expense as a share of revenue moved down; automation continued to climb. Share repurchases are still part of the capital-return mix.
Where I missed
I expected faster normalization in credit; instead, charge-offs as a percent of revenue were a touch higher than last year’s Q3. I also didn’t model a step-up in acquisition cost per customer; that matters at scale even if LTV stays strong. Yield stayed stable; I had penciled in a modest lift.
The good news
Management still expects charge-offs as a percent of revenue to decline y/y on a full-year basis; my quarterly cadence was too optimistic.
Versus my Q2 update
I said the guidance raise had legs; Q3 confirmed it with another bump. I leaned on operating discipline; Q3 delivered lower operating expense ratio again. I thought credit would already be bending down in Q3; instead, early-summer vintages pushed charge-offs up a bit, even as recoveries improved. I wanted clearer proof that automation would continue to move approval rates higher; Q3 showed 79% auto approvals.
How I update the thesis
Model 6.1 plus LOLA should expand the approval funnel; reduce cycle times; and keep opex lean. Funding costs stepped lower; liquidity looks ample; buybacks provide a floor.
I still see upside in the shares with the same target price of $21. The stock not moving after a clear beat and mostly good news, as discussed above, surprised me. Possible reasons: higher-for-longer rates still squeeze non-prime budgets, charge-offs stayed a bit high, which keeps some investors cautious, CAC per customer rose, some want LOLA and Model 6.1 live before re-rating and ongoing non-prime regulatory noise.
Thought Of The Week: LRN Stock Plunged 50% and I Doubled My Position
On Friday, I ‘read’ Annie Duke’s podcast with Howard Marks (transcript for the podcast in here) but here I leave the actual podcast if you prefer.
This section grabbed my attention:
“Well, the first thing I want to say is about human nature, not about a systematic bias, but I guess what I’m saying is there’s a bias toward overreaction. That’s not a directional bias, but it’s a bias. And so, you know, the way I put it is that in the real world, things fluctuate between pretty good and not so bad, but in investor minds, they go from flawless to hopeless. And so there’s an enormous tendency to overreaction if you think about it.”
Then he continues,
“If you look up at the economy, some years it goes up 2%, some years 1%, some years 3%, some once in a while down 2%. The fluctuations are small. Company profits go up 10% or down 10%, or up 15 or up five. They’re larger because companies are levered. They have financial leverage and operating leverage. So the profits fluctuate more than the economy to which they’re sympathetic. But stock prices go up 30, 50, down 70, up 80, down 20. You know, crazy numbers. The difference is psychology and it’s this flightiness or tendency to exaggerate. So that’s number one”
And then he continued to explain as the company’s intrinsic value doesn’t change that much from day to day, when the stock price goes down a lot is like merchandise at the department store being put on sale. Then he said something true and funny:
“I like hamburgers, and when hamburgers go on sale, I eat more hamburgers.” That’s what we all do. You know, I buy my underwear at Nordstrom’s, and during the annual sale I buy more. Except for in the securities markets. In the securities markets, when the price starts going down, people say, I don’t know. I better take a hard look at this. When it goes down a little, they say, now I’m getting worried. Maybe it’s not such a great idea. When it goes down a lot, they say, I’m afraid I’m going to lose the rest of my money. Get me out. So in other words, the lower the price goes, the less they want something. And the demand curve is downward sloping. Right? And you know, at lower prices, you want more, at higher prices, you want less.”
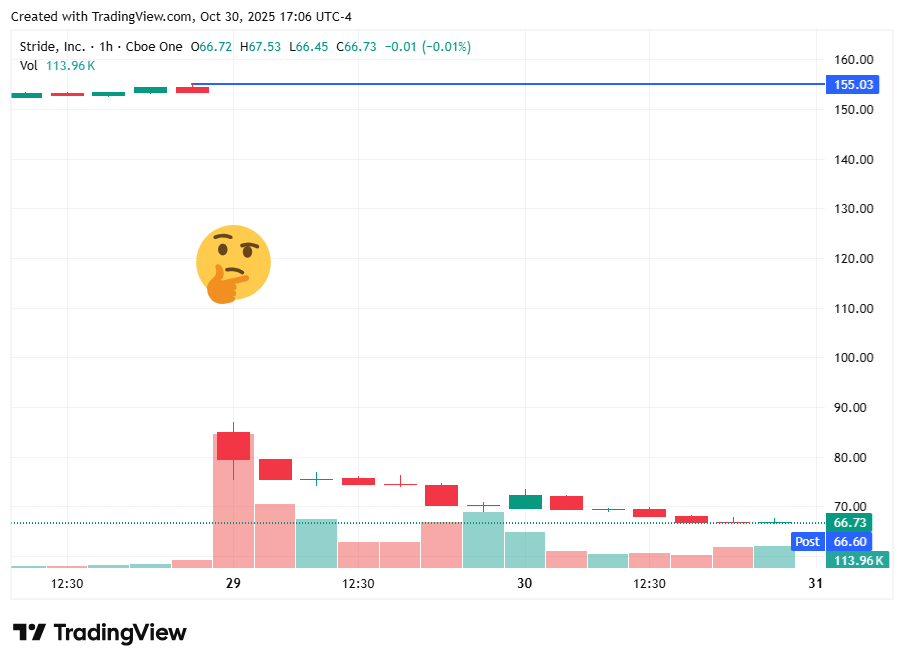
This resonated so much, especially this week with Stride, Inc. (LRN 0.00%↑). LRN just saw its stock cut more than half, dropping from $155 to $66.
The catalyst was a botched platform upgrade and an ultra-cautious outlook from management. I understand why many investors panicked but I’m doing the opposite. On Oct 29th, I sent a trade alert to double down the position from 0.5% of the portfolio to 1%.
My confidence comes from sticking to the facts and my investment thesis, which (so far) has been on target. In my June’s deep dive, I published a detailed model for FY2025 revenue, and the actual results came in 2.2% above my forecast.
Now, with the stock in freefall, I believe the market is missing the bigger picture and undervaluing Stride’s growth potential.
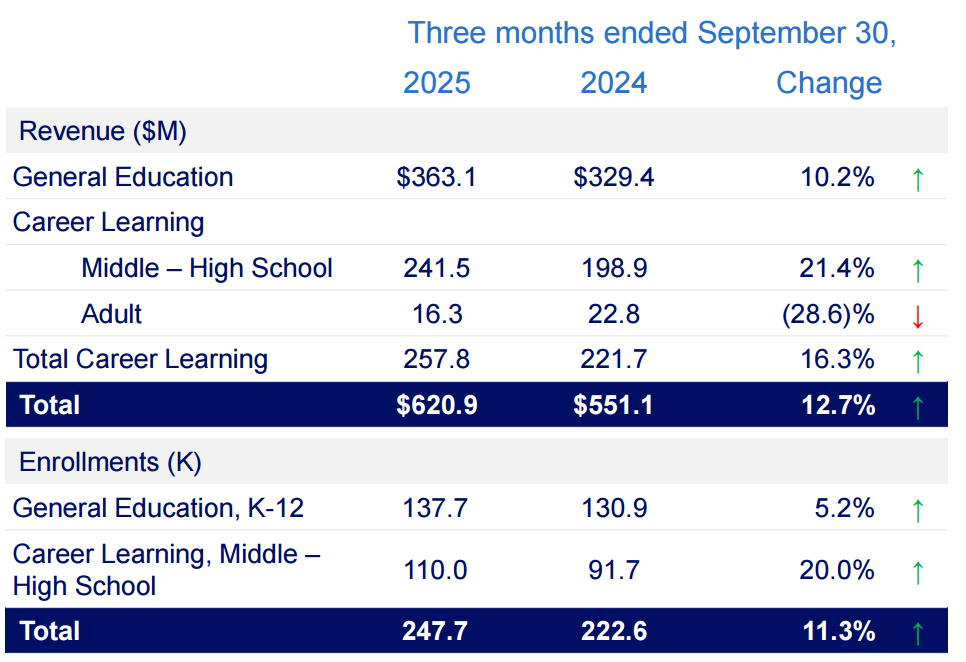
In the recent Q1 report, Stride’s new enrollment platform failed to perform, causing a wave of enrollment disruptions. Management estimates this tech snafu caused the company to miss out on 10,000–15,000 student enrollments at the start of the school year. Regardless of this hiccup, enrollment grew 11.3% y/y.
The CEO admitted the rollout “did not go as smoothly as anticipated,” leading to a poor customer experience with higher withdrawals and lower conversion rates.
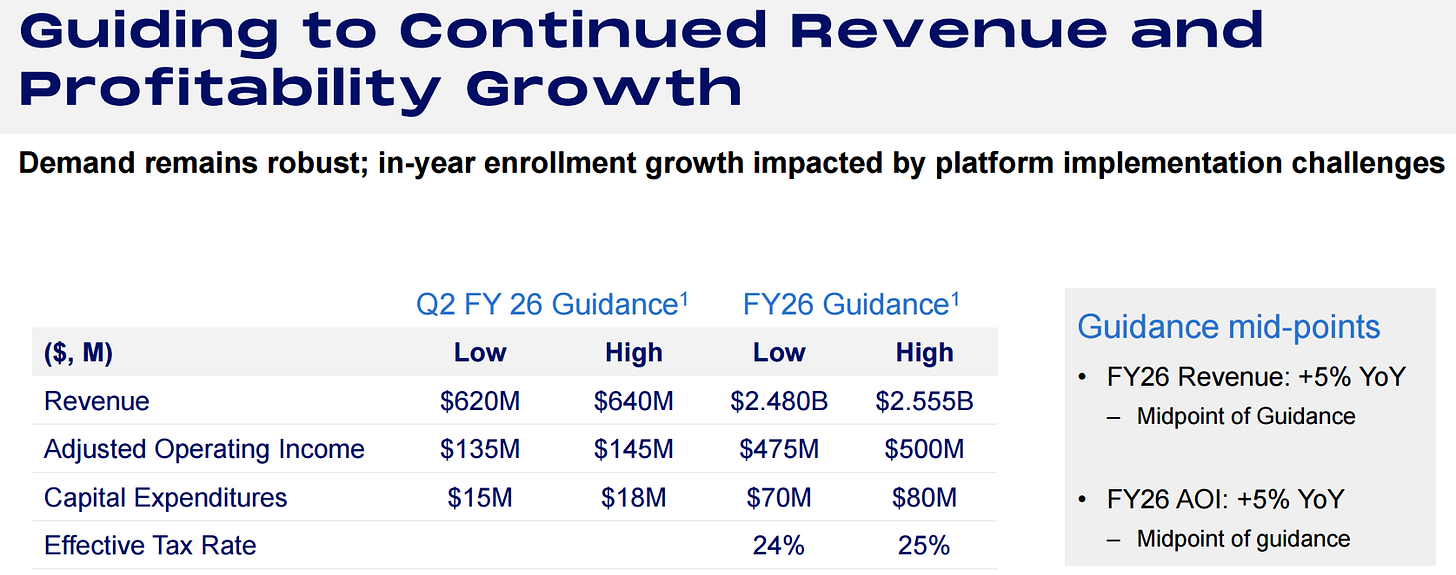
So, they lost some students and gave a muted forecast of 5% revenue growth for FY2026.
A sharp slowdown from 18% annual growth over the past five years.
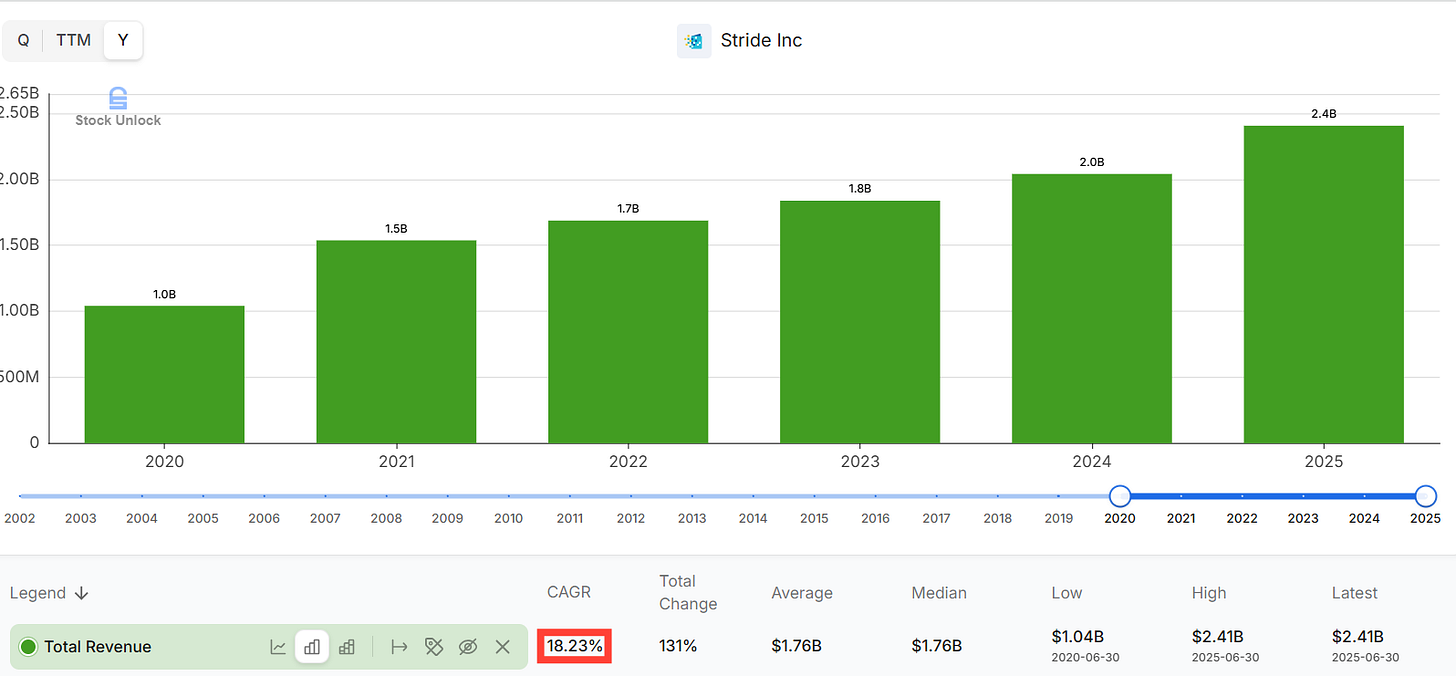
This cautious guidance, combined with the platform hiccups, sent traders running for the exits.
Here’s why I’m staying put and even doubling down: I see Stride’s stumble as temporary, not terminal. The company expects to have the platform issues fully fixed within a year. More importantly, the underlying demand drivers for Stride’s K–12 and career-learning programs remain strong, even if management is guiding conservatively.
In my updated FY2026 model, I’m projecting 7.8% enrollment growth, above the company’s 5% top-line guidance because multiple tailwinds support a faster rebound.
Tailwind #1. Students Are Moving to Stride’s Stronghold States
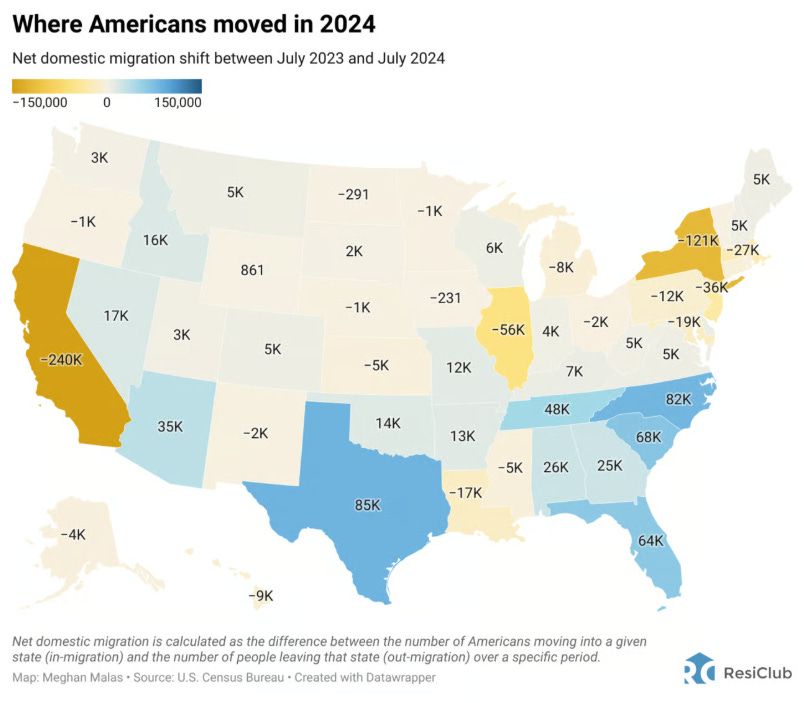
Demographics are destiny in education. The states experiencing the biggest influx of families happen to overlap with some of Stride’s largest markets. From mid-2023 to mid-2024, Texas, Florida, North Carolina, South Carolina, and Tennessee saw the highest net domestic migration gains in the country.
Texas alone added about 85,000 more residents (net) in that period, with North Carolina close behind at 82,000, followed by South Carolina, Florida, and Tennessee.
These Sun Belt states are magnets for young families, which means more school-aged kids entering local systems. Even amid national enrollment declines, fast-growing Southern states are still adding students. For example, South Carolina’s K–12 public school enrollment rose 0.9% last year, one of only nine states to see any increase. In contrast, many Northeast and Midwest states are losing students.
This matters for Stride because the company’s virtual schools and programs are widely available in those high-growth states. Strong population inflows create a tailwind for enrollment beyond the modest 5% growth that management guided. In other words, Stride’s addressable market of students is expanding in places where it operates.
Tailwind #2. School Choice Is Accelerating Adoption
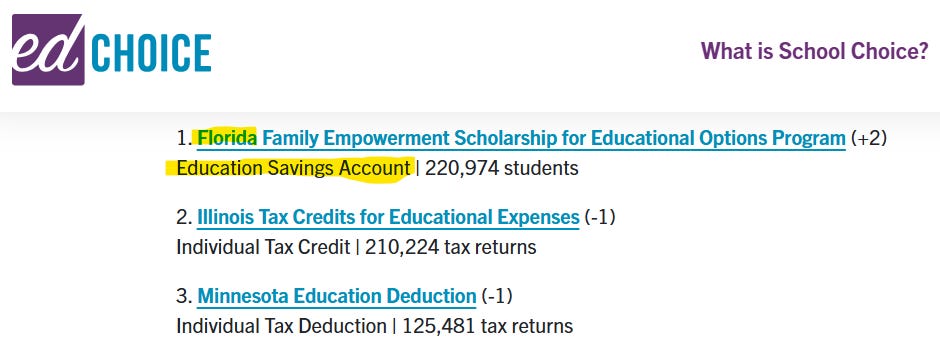
Policy tailwinds are another big factor. Coming out of the pandemic, many states have expanded school choice programs and families are seizing the opportunity. Participation in education savings accounts (ESAs) and vouchers is at record highs in 2025. For the first time ever, the nation’s largest K–12 choice program is an ESA (Florida’s) rather than a tax credit.
Florida rolled out universal eligibility, and now over 345,000 students in Florida are using state-funded ESAs or scholarships, up to 449,000 this year, a 30% jump in one year.
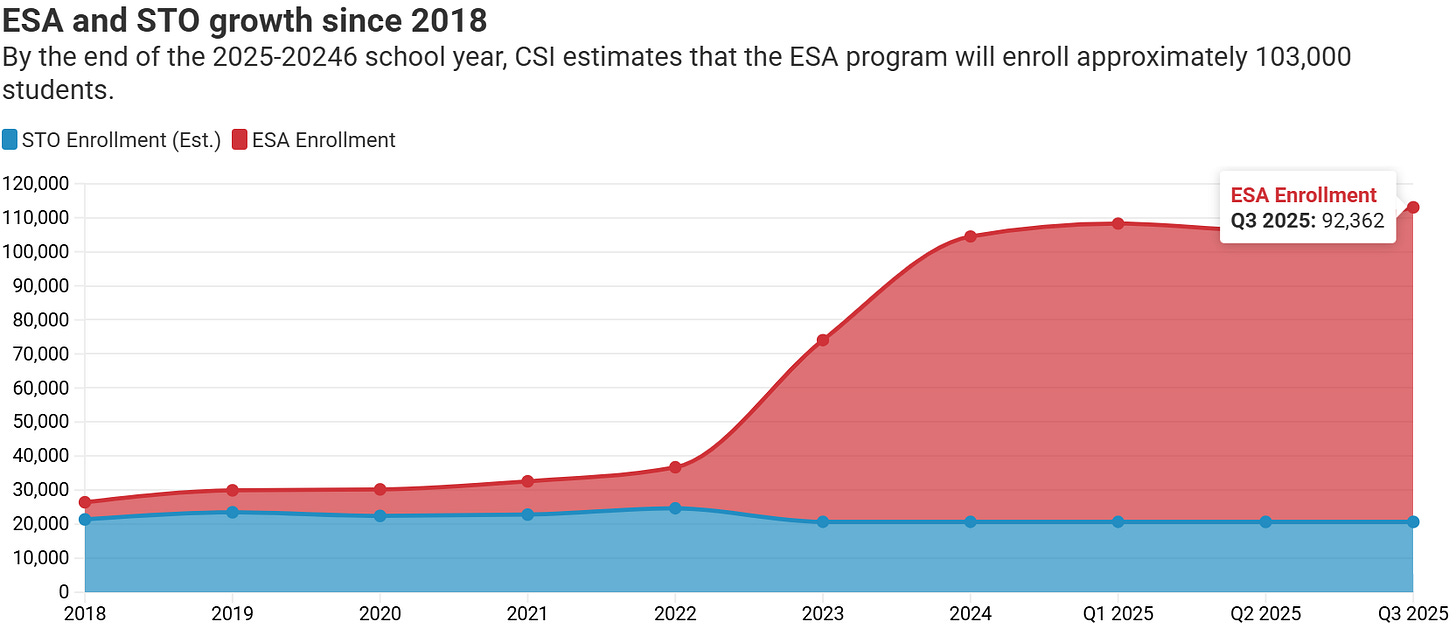
Arizona’s ESA program similarly surged to 92,362 students as of fall 2025, up from 30k in 2022.
Ohio massively expanded its voucher system; its income-based scholarship added 55,000 new students in one year, pushing Ohio’s total voucher usage to record levels. Indiana made its vouchers nearly universal and saw a 32% jump in participation in the 2023–24 school year, the biggest one-year increase ever. In short, hundreds of thousands of students are flocking to alternatives outside traditional public schools, aided by supportive legislation.
This trend directly benefits Stride. Many of those state programs can be used for online schooling or career-oriented programs. Stride operates virtual academies and private programs that can accept ESA funds or serve voucher students in states like Florida, Arizona, Ohio, and Indiana.
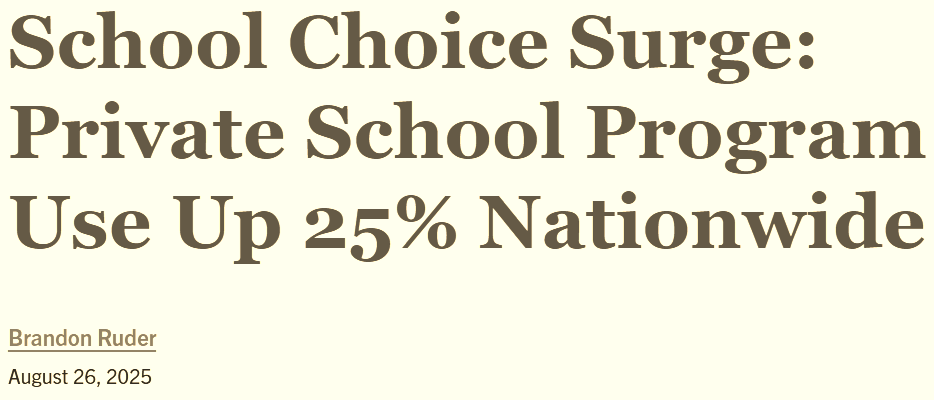
Management’s 5% growth outlook seems to underestimate the boost from these policy changes. When you have +1.3 million kids now in private-choice programs nationally (up 25% y/y), it signals a broader shift. Families are voting with their feet for more flexible learning options. Stride, as a leading online education provider, is positioned to capture that demand. I believe management is playing it safe on guidance, but the ground-level data on school choice enrollment suggests higher growth is more likely.
Tailwind #3. Career Learning Is Gaining Momentum
Stride isn’t just about K–12 academics; a big part of the story is career-focused education and adult learning. Here, too, the data points to strength. After years of decline, community college enrollment is finally rebounding, driven by interest in practical and affordable education.
In fall 2023, U.S. community colleges gained 118,000 students, a +2.6% increase, the largest jump of any higher-ed sector. By fall 2024, community colleges were up nearly 6% y/y, far outpacing four-year universities. Notably, two-year colleges with a “high vocational program focus” saw enrollment surge 16% and actually rose above pre-pandemic levels.
In other words, students are flocking to programs that teach trades, healthcare, IT, and other career skills. Certificate programs are also on the rise as enrollment in undergraduate certificate programs is now 15.6% above 2019 levels after three consecutive years of growth.
Stride has been investing heavily in career learning (e.g. career prep high schools, skills training, and adult online programs). The macro environment is validating that strategy. Importantly, funding for career and technical education (CTE) is secure and growing. The main federal CTE grant (Perkins V) provides about $1.4 billion annually to support high school and postsecondary tech-ed programs and that funding has been stable at record levels. States are also directing funds into workforce development programs. In Illinois, for example (one of Stride’s markets), community colleges just reported that Career and Technical Education enrollment jumped 9.5% in fall 2025. All of this suggests that Stride’s career-oriented offerings should see robust uptake.
Management’s 5% growth guide looks pessimistic in light of community colleges growing mid-single digits or more. If anything, demand for career training is accelerating, not slowing.
Tailwind #4. Online Learning Is Now Normal
Another secular shift working in Stride’s favor: online education has become mainstream and widely accepted by learners. The pandemic forced virtually every student to try online learning, and while most returned to classrooms, comfort with digital learning remains high.
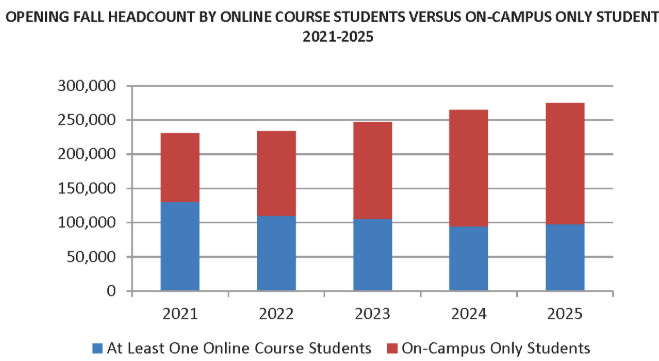
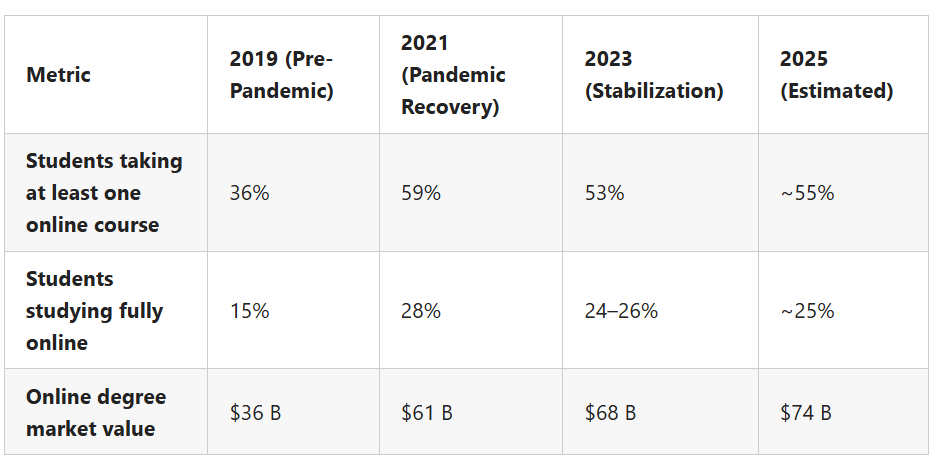
Hybrid and online course enrollment is routine now, even in traditional institutions. For instance, in Illinois community colleges this fall, over one-third of students (35.7%) took at least one online course.
That’s up substantially from pre-COVID days and shows that millions of students (and parents) now see online classes as a normal part of education. Nationally, the latest NCES data indicated over half of all college students took an online course in 2023, a huge jump from ~36% in 2019.
In K–12, we’re seeing a steady state of higher online enrollment even after schools reopened. As of September, Stride 247,700 students enrolled in their schools. A base that is much larger than pre-pandemic and reflects how virtual schooling has moved from niche to a durable segment of the market.
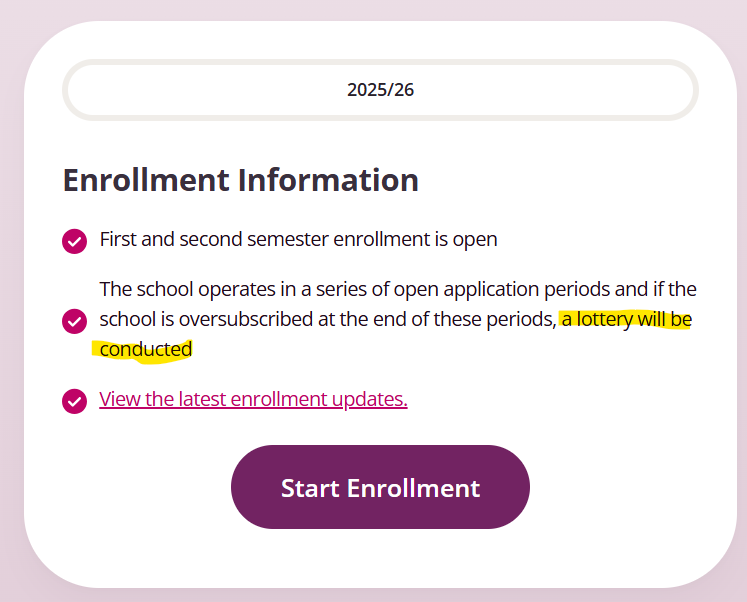
I expect this normalization of digital learning to continue driving families into Stride’s ecosystem. Remember, Stride’s enrollment dropped this fall only because of the platform fiasco, not due to lack of interest. In fact, several of Stride’s virtual schools were oversubscribed and had to run lotteries or waitlists for seats (for example, Massachusetts’ TEC Connections Academy hit its cap of 3,000 students and conducted lotteries for K–1 and other grades).
Demand outstripped capacity in some instances. That’s a very different story than the market panic implies. With the tech issues resolved, I foresee pent-up demand refilling those 10–15k “missed” enrollments, plus additional growth as more families opt for the flexibility of online options.
Tailwind #5. Local Capacity Crunch: Virtual School as a Relief Valve
It’s also worth noting a practical driver: many brick-and-mortar school districts are running into capacity constraints, which indirectly benefits virtual schools like Stride. Fast-growing communities often don’t have enough physical classrooms for all the students moving in.
We’ve seen this in booming suburbs and cities, kindergarten waitlists have appeared in places like New York City and parts of California and Texas. A few years ago in NYC, over 2,300 children were waitlisted for kindergarten seats due to overcrowded local schools. Districts have scrambled to open overflow classes in trailers and satellite campuses.
Similar stories play out in high-growth suburbs today, where new housing outpaces school construction. When a local public school has no available seats or strict age cutoffs, parents start looking for alternatives. Stride’s virtual K–12 programs can accept students from anywhere in the state, making them a natural relief valve for overcapacity. Instead of sitting on a waitlist, a family can enroll with Stride’s online school and get started immediately.
We also see waitlists in choice programs that signal unmet demand for schooling alternatives. In newly launched ESA programs, thousands of families who applied couldn’t get scholarships due to funding caps. (For example, Alabama’s new ESA had 36,000 applicants for only 23,000 slots, and Louisiana had nearly 40,000 apply for just 6,000 awards.) Those excess applicants will seek other options. Possibly homeschooling, smaller private schools, or online programs like Stride.
The bottom line: there is a supply-demand mismatch in K–12 education in several states, and virtual schools are stepping in to fill the gap. This gives Stride a growth runway that isn’t fully reflected in a 5% growth outlook.
Tailwind #6. Families Want Faster, Skills-First Paths
Beyond K–12, a broader cultural shift is underway in how families and students view education. There’s a growing “skills-first” mindset. A belief that the goal of education is to gain useful skills and certifications, not necessarily to spend the longest time in school. This is showing up in opinion surveys: In a 2025 Harris Poll, more Americans said they’d recommend vocational or trade school (33%) over a four-year college (28%) to a graduating high school student. About 24% would advise either going straight into the workforce or an apprenticeship, whereas only 28% chose the traditional college route.
In fact, older generations overwhelmingly favor trade programs. Over 40% of Boomers would tell a young person to pursue vocational training. The sentiment is clear: many parents (and students) are questioning the return on investment of a four-year degree and are open to alternative postsecondary pathways.
Stride directly taps into this trend with its career-learning division and partnerships that allow high schoolers to earn college credit or industry certifications. The company’s programs in IT support, healthcare, business, and other fields cater to families looking for faster, more targeted education that leads to jobs. Major employers are also shifting to skills-based hiring, dropping degree requirements for many roles. This further validates the approach. As families gravitate towards “faster pathways” such as coding bootcamps, community college dual-enrollment, or career academies, Stride stands to benefit.
The company’s management may be tempering expectations for now, but these societal trends suggest demand for Stride’s offerings will only grow in the coming years.
Valuation Update
I now revise my DCF fair value to $209 per share (down from $224). This change reflects a slightly more conservative near-term outlook. In particular, I assume 7.8% revenue growth for FY2026 instead of the +15% I had earlier.
Besides the revenue assumptions detailed above, I made 2 changes.
Change #1. Slight margin compression
I assume slightly lower margins given Q1’s commentary. CFO Blackman reported Q1 gross margin of 39% (down 20 bps y/y) and warned that continued investments will push FY2026 margins below FY2025 levels. CEO Rhyu noted that new platform rollouts “did not go as smoothly as we anticipated,” causing “higher withdrawal rates and lower conversion rates”.
In other words, fixing those tech issues is likely raising short-term costs (e.g. extra support or contractors) and denting revenue per student. Management also reiterated it will keep investing in academic quality and new learning products, which I reflect as a modest drag on near-term operating margin.
Change #2. Higher capex
I now use a capex rate of about 3.0% of sales (up from 2.5%). Stride guided $70–80 million of capex for FY2026, roughly 3% of revenue, to support its platform upgrades. This increase slightly reduces free cash flow in the model.
Free Cash Flow Yield Looks Mispriced
Based on my updated model, I expect Stride to generate $250–300 million in FCF in FY2026. The exact number depends on working capital and cash taxes, but that’s my expected range. At today’s market cap, that implies a FCF yield of 8.6% to 10.4%.
That’s high. Too high for a business with Stride’s cash flow consistency, demand visibility, and asset-light model. This isn’t a cyclical name. It doesn’t swing with commodity prices. It sells a service that school districts and parents commit to months in advance. And it doesn’t need major capex to grow.
A more reasonable yield for a durable mid-single-digit grower with steady returns would be closer to 5.0–6.0%. That’s where well-run education and software businesses tend to settle when the market trusts the growth. At a 6% yield on $275 million of FCF, the implied valuation is $4.6 billion about 58% above today’s level. This implies a nice margin of safety.
Conservative Guide Makes the Upside Sweeter
To sum it up, Stride’s +50% stock plunge looks like an overreaction. Yes, the company hit a pothole with its platform implementation, and that hurt one quarter’s enrollments. But that issue is fixable (and in progress to be fixed).
Meanwhile, all the macro currents are flowing in Stride’s favor. Management’s 5% revenue growth guidance for FY2026 appears overly conservative in this light, likely a reaction to the recent stumble. I expect Stride will outperform that low bar if it captures even a fraction of the tailwinds outlined above. In my view, management is under-promising so it can over-deliver later.
I see the selloff as a gift. The stock now trades as if Stride’s growth days are over, when in reality the company is simply resetting for its next phase of growth. I doubled my position because my conviction in the long-term thesis is unshaken. If anything, the recent data on enrollments, state policies, and market demand makes me more confident that Stride can grow well above 5% and return to double-digit expansion after this year.
It’s crucial to cut through the noise. The noise around Stride right now is fear and uncertainty from a one-off operational error. The signal, in contrast, is a fundamental demand for what Stride provides: education that meets families where they are, both geographically and in life goals. That signal is loud and clear in the data and trends discussed.
Portfolio Update
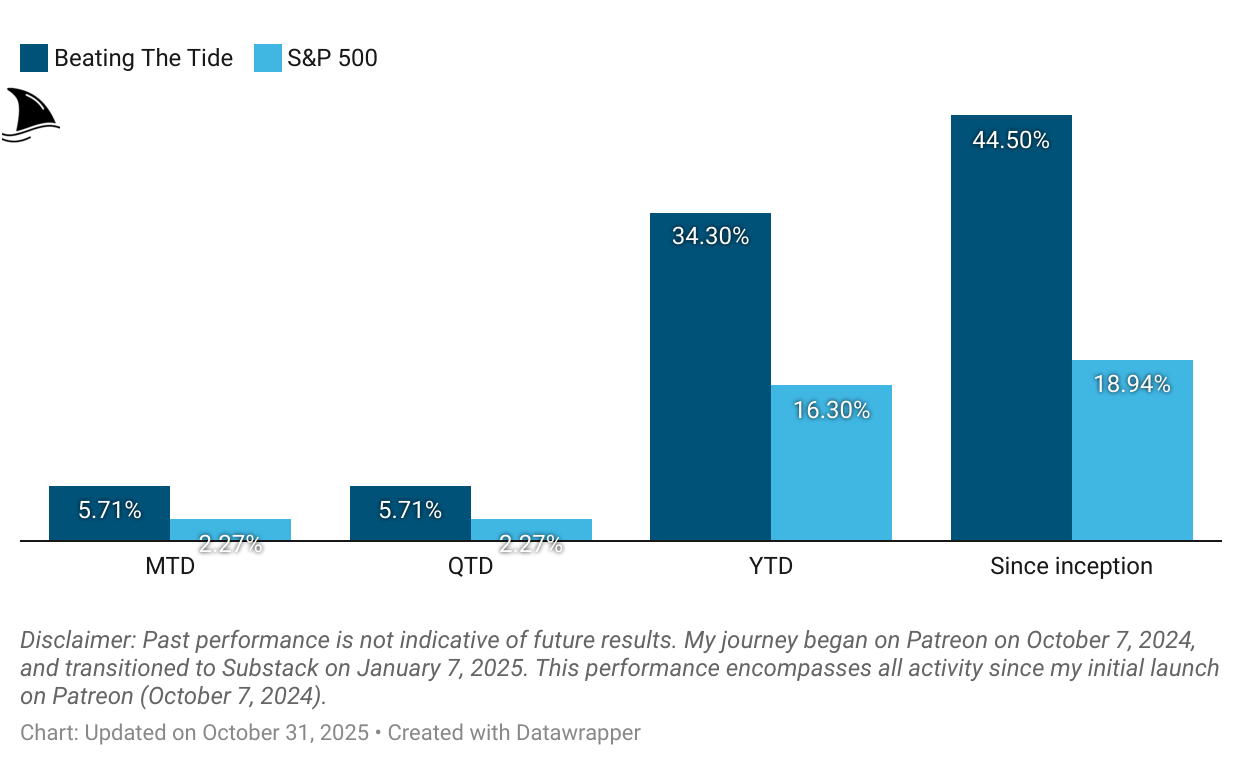
The portfolio closed October with a +5.7% gain expanding our outperformance over the S&P 500.
Month-to-date: +5.7% vs. the S&P 500’s +2.3%.
Year-to-date: +34.3% vs. the S&P’s +16.3%, a gap of 1,800 basis points.
Since inception: +44.5% vs. the S&P 500’s +18.9%. That’s 2.3x the market.
Portfolio Return
Contribution by Sector
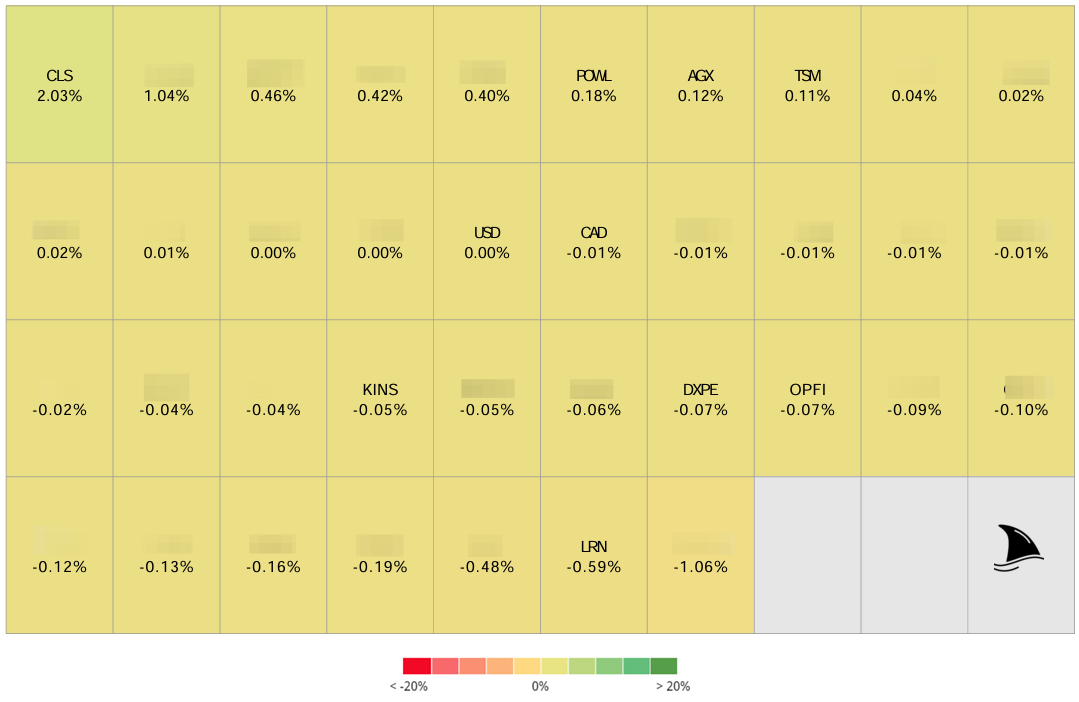
The gains were driven by tech, industrials and healthcare partially offset by education (mainly due to the LRN sell-off).
Contribution by Position
(For the full breakdown, see Weekly Stock Performance Tracker)
+203 bps CLS 0.00%↑ (TSX: CLS) (Thesis)
+18 bps POWL 0.00%↑ (Thesis)
+12 bps AGX 0.00%↑ (Thesis)
+11 bps TSM 0.00%↑ (Thesis)
-5 bps KINS 0.00%↑ (Thesis)
-7 bps DXPE 0.00%↑ (Thesis)
-7 bps OPFI 0.00%↑ (Thesis)
-59 bps LRN 0.00%↑ (Thesis)
That’s it for this week.
Stay calm. Stay focused. And remember to stay sharp, fellow Sharks!
Further Sunday reading to help your investment process:

















You didn't address the key issue, will any of their partner school leave because of this disastrous rollout. Pearson lost its California virtual charter schools because of their own rollout challenges back in 2018, it took a while for those schools to leave. Have you contacted any board members to see if their leadership is upset enough to leave? Probably not. Have you contemplated it? Probably not. I was in the leadership in Pearson Virtual Schools, Connections Education, at the time we had our own challenges back in 2018. Investors know this is a big deal, not just a temporary issue. The loss of partner schools and customer concentration has always been a concern for these folks, particularly after Agora left close to twenty years ago and had the stock fall materially. The stock is trading as if schools might leave, that may not occur for another couple of years but it might happen. Its too early to know.