


Hello fellow Sharks,
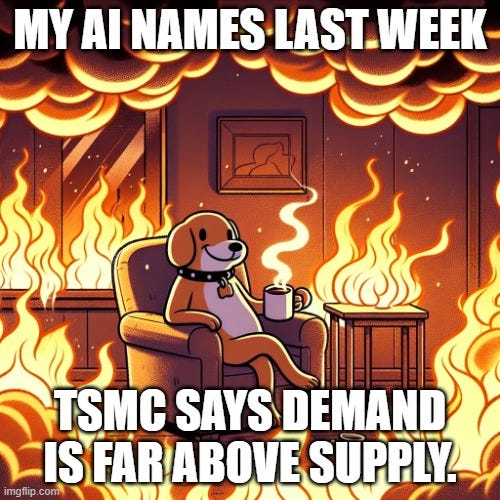
The portfolio fell 9.1% this week (ouch!) while the S&P 500 lost 2.0%, as the AI sell-off did most of its damage on Wednesday. If you want to skip straight to the numbers, jump to the Portfolio Update.
What a week!
Mr. Market definitely woke up on the wrong side of the bed. Someone started to question the sustainability of AI spending, and it hit the entire market. I find it hilarious how a headline can create or destroy billions (or trillions in this case) of dollars in the market. In times like this, I wish I had some more cash to invest. I have some cash sitting in Chile, so I am hoping the market stays where it is while I move it into my IBKR account next week.
Today I was going to talk about TSM’s latest earnings (they were good), but based on subscribers’ questions, I think it is better to focus this Thought of the Week on what is going on and publish the TSM earnings review sometime next week. In the Thought of the Week, I explain why I expected this kind of volatility, why the crack showed up in the bond market rather than in AI demand, and the three numbers that would change my mind.
Enjoy the read, and have a great Sunday.
~George
Table of Contents:
In Case You Missed It
Since last Sunday’s Weekly, I published two pieces:
ECO: The Tanker I Wanted to Chase (and Why I Didn’t): why I passed on a surging tanker stock, and what could change my mind.

A paid update on our September pick: a regulatory penalty, a soft quarter and a 40 bp jump in rates. I cut fair value, kept the BUY and raised the weight to 5%.

Thought Of The Week
The AI Sell-Off Started in the Bond Market
Why I expected this volatility, what actually broke last week, and the three numbers that would change my mind.
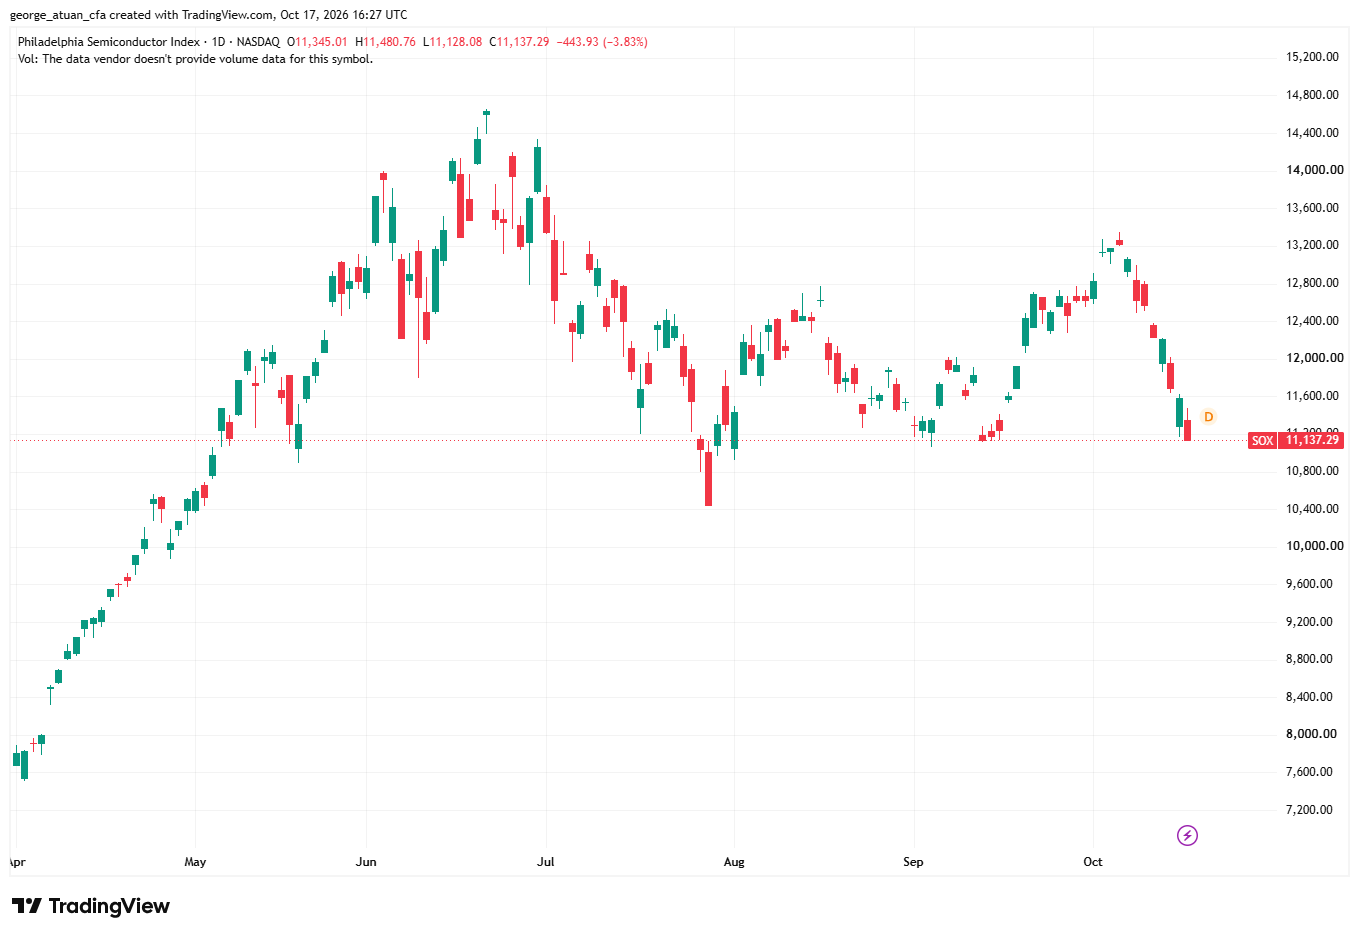
Last week felt like the whole AI trade was being unwound at once. The SOX fell for eight sessions in a row, its longest losing streak since October 2008, and lost 16% from its last up day on October 6. Over six sessions, chip stocks erased more than $1.6 trillion in market value.
Several punches landed in the same week. On Monday, the CEO of Broadcom [AVGO 0.00%↑] said “a lot of investors have no clue what they are investing in” and that some “set very extreme expectations only to find out that it’s almost like they are in a casino”. That is one of the reasons I try to go into a lot of detail, so subscribers understand what they are holding and don’t panic in drawdowns like last week’s. Also, on Wednesday, September inflation came in hot, the 10-year Treasury yield touched 5.33%, and Barclays downgraded Dell [DELL 0.00%↑] to equal-weight. Dell fell 11.3% that day.
Barclays didn’t say AI demand was falling. Its analyst cut Dell to equal-weight and the target to $574 from $603, arguing that Dell’s growth “reflects how well the company has offset memory cost inflation by raising prices,” and that he expects “a meaningful deceleration in growth over the next two years” as memory prices normalize. He also flagged valuation: the seven enterprise hardware names he covers are up 140% this year on average and trade at 21x 2027 earnings, vs. a five-year average of 15x.
I moved DELL from BUY to HOLD in Weekly #98 back in September, at $524, for a different reason.

The number that changed my mind was cash: operating cash flow fell 13% in a quarter where net income grew 255%, and the gap was filled by DELL financing its own customers. Dell’s financing receivables reached $20.4 billion at the end of July, up from $14.3 billion in January, and Dell attributes the growth mainly to its AI servers. The charge-off rate is still low at 0.5%, but it was 0.1% a year earlier.
Barclays worried about memory prices. I worried about who pays for the servers, and when. Last week, the market started asking the second question. DELL closed Friday at $452, down 23% for the week and right at my $450 bear case.
And all week long, CoreWeave [CRWV 0.00%↑]’s bonds kept sliding…let’s dig into what happened here.
What actually broke
CoreWeave rents GPUs to the AI labs and the hyperscalers. Its April-issued bonds traded at 79 cents on the dollar, a 15% yield, and the cost of insuring its debt against default climbed to 1,000 basis points. That price implies a 63% chance of default within five years. This is a loss-making company carrying $35.6 billion of debt plus $16.3 billion of lease obligations, per its latest quarterly filing, and two customers made up 62% of its revenue last quarter.
The model itself is simple. CoreWeave signs a five-year contract with a customer like Microsoft, buys the GPUs from Nvidia, leases the data center and borrows against the contract. The customer’s payments cover power, interest and principal, and management has said a deal pays for everything within two and a half years.
The model works as long as two things hold: the customer keeps paying, and money stays affordable. Last week, nobody questioned the first one. The second one cracked.
When a business is financed as a spread over the risk-free rate, a jump in the 10-year squeezes it from both sides. The existing bonds still pay their original coupon, so the damage isn’t immediate. But the next round of financing costs more, margins on new contracts get thinner, default insurance gets pricier, and that pushes bond yields up again. It’s a loop, and it feeds on confidence.
Notice what the headlines were about: funding, not cancelled orders. Nvidia [NVDA 0.00%↑] has agreed to buy any unsold CoreWeave capacity through April 2032.
What a GPU actually earns
To judge whether this build-out pays, you have to understand what the asset earns. I covered the basics in Weekly #61.

A GPU is a Swiss Army knife, thousands of small processors working in parallel, while a custom chip like Google’s TPU is a scalpel built for one job. For the economics, it is simpler than that. A GPU is an expensive machine that only makes money while someone is renting it.
In Weekly #87, I wrote that “the dominant cost of running a token is not electricity, it’s the amortized cost of the GPU, which means the price of the chip and how busy you keep it.”

Memory is a big part of that price. As I noted in my top pick for 2026, Epoch AI estimates that 45% of the cost of a B200 is HBM memory, while the GPU chips themselves are less than 15%. That is why MU sits in the same chain as DELL and CLS.

Scale it up and the numbers get big quickly. Jensen Huang has said a gigawatt of AI capacity costs $50 billion to $60 billion, $35 billion of which goes to Nvidia. A single GB300 NVL72 rack, with 72 GPUs, now costs just under $5 million.
Here is my back-of-the-envelope math for the H100, the chip at the center of last week’s fight:
An 8-GPU H100 server costs $285,000, or $36,000 per GPU. On Huang’s numbers, chips are 60-70% of a data center’s cost, so the all-in cost with the building, power and networking is $55,000-60,000 per GPU.
Rented at $2.74 an hour, where the Ornn H100 index closed on Friday, and busy 80% of the time, it earns $19,000 a year.
Power barely moves the math. At 8 cents per kWh, it costs 10-15 cents an hour, under 5% of the rent.
That is a payback of 3 years before staff, maintenance and interest. At $1.70 an hour, where one-year H100 contracts bottomed last October, it stretches to 5 years.
Three years against a six-year accounting life works. Five years leaves little room once the interest bill arrives. The whole debate comes down to two variables: the rent, and how long the chip keeps earning it.
The second variable is where the bears focus. Nvidia now launches a new generation every year, and Huang has told customers to “pace themselves” and build “on an annual rhythm.” Nvidia also says its GB300 racks deliver “35x lower cost per token” than Hopper. A GPU bought today on a six-year schedule will see several newer generations before it is fully depreciated.
Do old GPUs lose their value?
This matters because of an accounting choice. Over the last four years, the hyperscalers stretched the useful life of their servers, which spreads the cost over more years and lifts reported earnings:
Microsoft [MSFT 0.00%↑] moved servers from four to six years in fiscal 2023, adding $3.7 billion to operating income that year.
Alphabet [GOOG 0.00%↑] did the same in 2023, adding $3.0 billion to net income.
Meta [META 0.00%↑] went to 5.5 years in 2025, cutting depreciation by $2.9 billion.
Amazon [AMZN 0.00%↑] went the other way. In 2025 it shortened some servers from six years to five, “due to the increased pace of technology development, particularly in the area of artificial intelligence and machine learning.”
Michael Burry called the longer lives “one of the more common frauds of the modern era” and estimated $176 billion of understated depreciation over 2026-2028.
So, are old GPUs holding their value? Partly.
The case for: CoreWeave re-contracted its first 10,000-plus H100s at a price within 5% of the original agreement, and said A100 pricing increased in 2025. A100s launched in 2020. In May, Nvidia said the price of renting an H100 had risen 20% this year, and that customers are “generating profitable revenue beyond the depreciable life of their GPUs.”
The case against: rents fell hard before they recovered. The median hyperscaler rate for an H100 dropped from $9.34 an hour in the second half of 2024 to $6.26 a year later. Someone who bought in 2023 lost most of the hourly yield within two years. Rents are still volatile: the Ornn index went from $3.21 on Wednesday to $2.74 on Friday. And the people telling us old chips hold their value are the ones selling and renting them. In August, CoreWeave’s CFO admitted that renewals are “a very limited part of our fleet.”
My read: old GPUs keep earning while compute is scarce, so six-year lives are defensible today. They are not a law of nature. If supply catches up, the rent on a 2023 chip falls first, and the write-downs follow. We should be watching the scarcity of GPUs.
This is the volatility I expected
I have said before that the AI names will go through bouts of volatility, because the money gets spent years before the returns show up. That is why, since March, I have focused my monthly stock picks on other sectors: the portfolio is ~35% exposed to the AI theme.
The five largest hyperscalers are on track to spend more than $690 billion on capex in FY26, up more than 80% in a year. FactSet expects their free cash flow to be close to zero or negative for all of them except Alphabet and Microsoft, and debt now funds 32% of their capex, up from 9% in FY24.
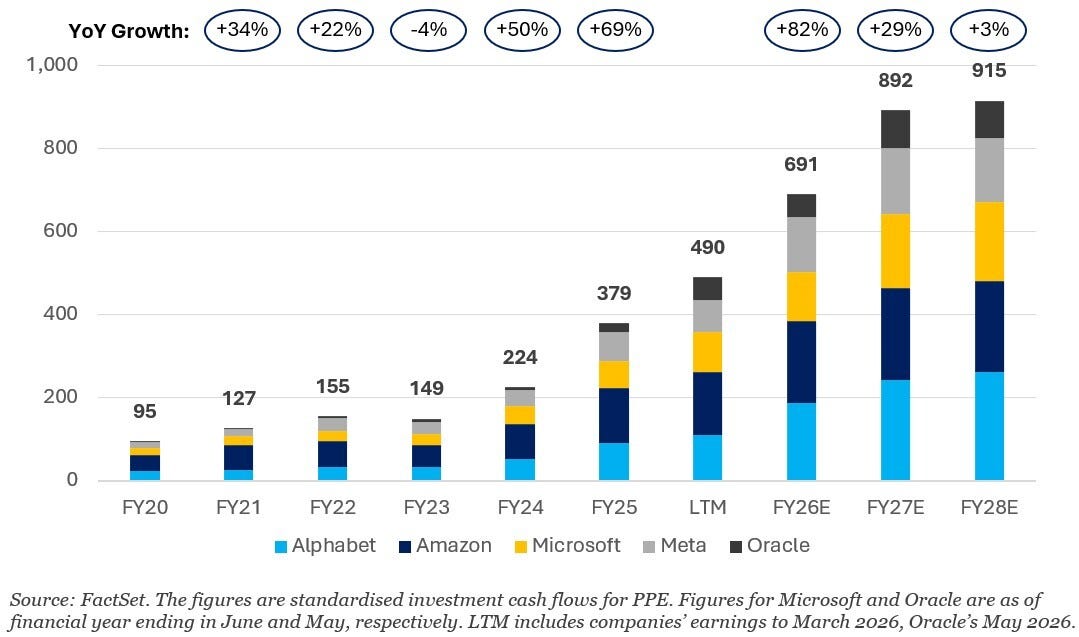
Look at the growth rates at the top of that chart: +82% this year, +29% next year and +3% in FY2028. The spending keeps rising, but the growth almost stops. For the suppliers, that matters more than the level. DELL, CLS and MU book revenue on the level of spending, but their growth, and the multiple the market pays for it, track the change. When capex growth falls from 82% to 3%, supplier growth slows with it, even if no hyperscaler cuts a dollar. That is the digestion year I flagged in Weekly #98, and it is the same deceleration Barclays now models.
So how do I square a 3% growth forecast with TSMC saying demand is above supply? First, out-year consensus has been wrong in one direction this whole cycle: analysts have raised their FY2027 capex estimates for these five companies by an average of 183%, vs. 33% in a typical year. I read that +3% as analysts not modeling beyond guidance. Second, the chart covers five companies. TSMC also sells to the neoclouds, the sovereigns and the AI labs building their own capacity. Third, more of each dollar goes to silicon, as memory per accelerator keeps rising. None of that makes 82% repeatable. Demand above supply describes the level of spending, and supplier growth depends on the change. I’m bullish on the first and cautious on the second, which is why DELL is a HOLD and why my recent picks came from other sectors.
The revenue arrives in installments. OpenAI reportedly told its backers that its annualized revenue is approaching $50 billion, $20 billion below a figure reported earlier. That report hit the tape the Thursday before this sell-off began. Until revenue catches up with spending, every headline about funding gets priced as a referendum on the whole trade.
I flagged this exact risk in Weekly #96.

Hyperscalers account for 40% of long-duration investment-grade issuance, and I wrote that “if yields break through the ceiling despite the buybacks, capex budgets are the first thing trimmed, and our names would feel it before the hyperscalers do.” I called it “a financing watch item, no more than that... for now.” Last week, the watch item moved.
Remember the Citrini Research piece, The 2028 Global Intelligence Crisis? It asked, “What if our AI bullishness continues to be right...and what if that’s actually bearish?” The authors called it “a scenario, not a prediction,” yet the Dow fell 1.7% the Monday after it went viral. A fictional memo helped move real money. Funnily enough, the fictional drawdown in that piece starts “from its October 2026 highs.” I don’t think they have a crystal ball, but the date made me smile.
Bubbles die from a lack of demand
In the five years after 1996, telecom companies poured more than $500 billion into fiber, switches and wireless networks. By 2002, no more than 2% of North American long-distance capacity was being used. Shareholders lost $2 trillion. Cisco went from $2 in 1995 to $80 at its March 2000 peak, more than 200 times earnings, and then fell below $9 in 2002. That bubble died because the capacity sat idle. Prices for bandwidth collapsed, and anyone who had borrowed to own that capacity was wiped out.
Today the problem runs the other way. On Thursday, TSMC [TSM 0.00%↑] reported Q3 revenue of $46.7 billion and now expects 2026 revenue to grow 44% (full analysis on the results sometime next week). The CEO said “We did not see any sign of slowdown,” and that demand “is still far above our capability today to supply”. Asked about the mid-to-high-50s% growth TSMC expects in AI accelerator revenue through 2029, he said it “probably will be higher.”
In Weekly #87, I wrote down what would prove me wrong: the cost per token stops falling, demand saturates, and OpenAI turns out to have no pricing power, all at once. None of those three happened last week. What happened was a repricing of credit.
The bear case deserves a fair hearing
Rates are rising for reasons that have nothing to do with AI, and a higher 10-year raises the cost of every data center under construction. A company can have a full order book and still fail if it has to refinance at the wrong moment. The weakest borrowers in this chain are the neoclouds, and their customers are concentrated in a handful of names.
Prices can also turn. If supply catches up with demand, GPU rental rates could fall the way bandwidth did in 2001, and anyone who locked in financing against today’s prices would be upside down.
And the revenue side still has to deliver. OpenAI’s numbers came in $20 billion below what had been reported, and the market just showed how little patience it has for that kind of gap.
Gartner put a number on the worst case on Wednesday. It says more than $3.5 trillion of AI infrastructure spending could be exposed to impairment by 2030, because covering that spend, the financing and a 12% return would take $8.5 trillion of cumulative revenue, against no more than $3.6 trillion of AI data center revenue. It also expects more than 80% of neoclouds to stop operating independently by 2030.
Three numbers that would change my mind
1. Payback period. This is the North Star for the build-out. On my math above, an H100 pays for itself in 3 years at today’s rent, and CoreWeave’s management says its contracts pay back in two and a half. Against a six-year accounting life, the economics hold even with rising rates. If paybacks stretch because rental prices fall or customers walk away, the math breaks.
2. The 10-year yield and AI credit spreads. If financing costs rise faster than AI revenue, capex gets cut, and as I wrote in Weekly #96, our names would feel it before the hyperscalers do. CoreWeave’s bonds and default insurance are the canary.
3. Hyperscaler capex guidance. As long as TSMC says demand exceeds supply and the hyperscalers keep raising their budgets, the demand side is intact. Watch the growth rate, not just the level: consensus already has it falling from 82% this year to 3% in FY2028. A cut in capex guidance would be the signal that the cycle is turning.
Where our AI names sit in this chain
Not all of our AI exposure carries the same risk. Last week’s problem was financing, so here is how I map our names against it:
DELL lends to its customers. That is the risk I flagged in Weekly #98, and the market priced it last week.
CLS extends no vendor financing, and most of its compute programs are consigned: the customer supplies the silicon, so it never sits on Celestica’s balance sheet. Its AI exposure is the 800G and 1.6T networking that keeps the GPUs busy.
MU sells memory under take-or-pay agreements with minimum prices. Its risk is the memory price cycle, the same thing Barclays is worried about at the server makers.
TSM’s customers are chip designers like Nvidia, Apple and Broadcom, and it just told us demand is above its capacity.
STRL and POWL build and power the data centers. If financing tightens, their risk shows up first as fewer new orders.
The further a company sits from the borrower, the less last week’s problem touches its numbers. The share prices didn’t make that distinction last week but I think that the financial statements will.
What I’m doing
My approach is the one I laid out in Weekly #103: a falling price is a reason to investigate. So far, I maintain:
a BUY on CLS, STRL, MU and TSM
a HOLD on POWL and DELL
Jensen Huang said on Friday that “All of this is going to pass”. He would say that, so I don’t take it as evidence. I take TSMC’s order book as evidence.
Portfolio Update
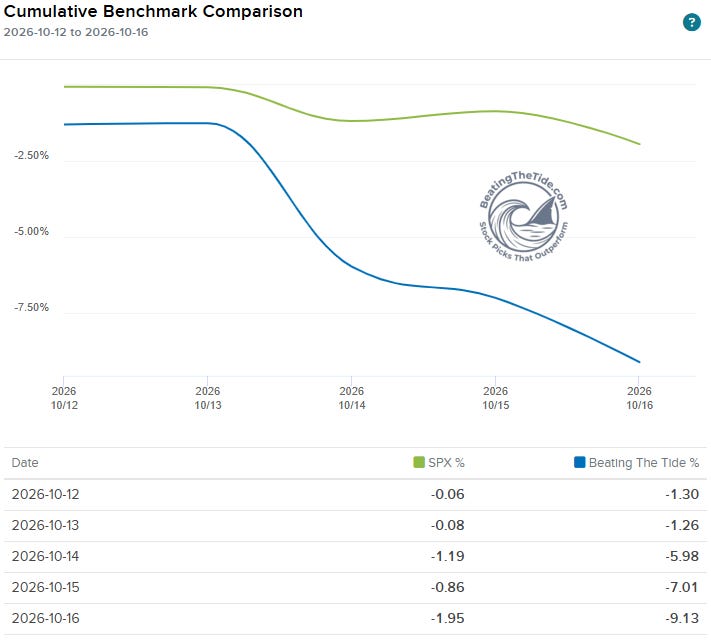
The portfolio lost 9.1% last week while the S&P 500 fell 2.0%. We were down 1.3% at Tuesday’s close, then Wednesday alone took us to a 6.0% loss, and Thursday and Friday added the rest.
Portfolio Return
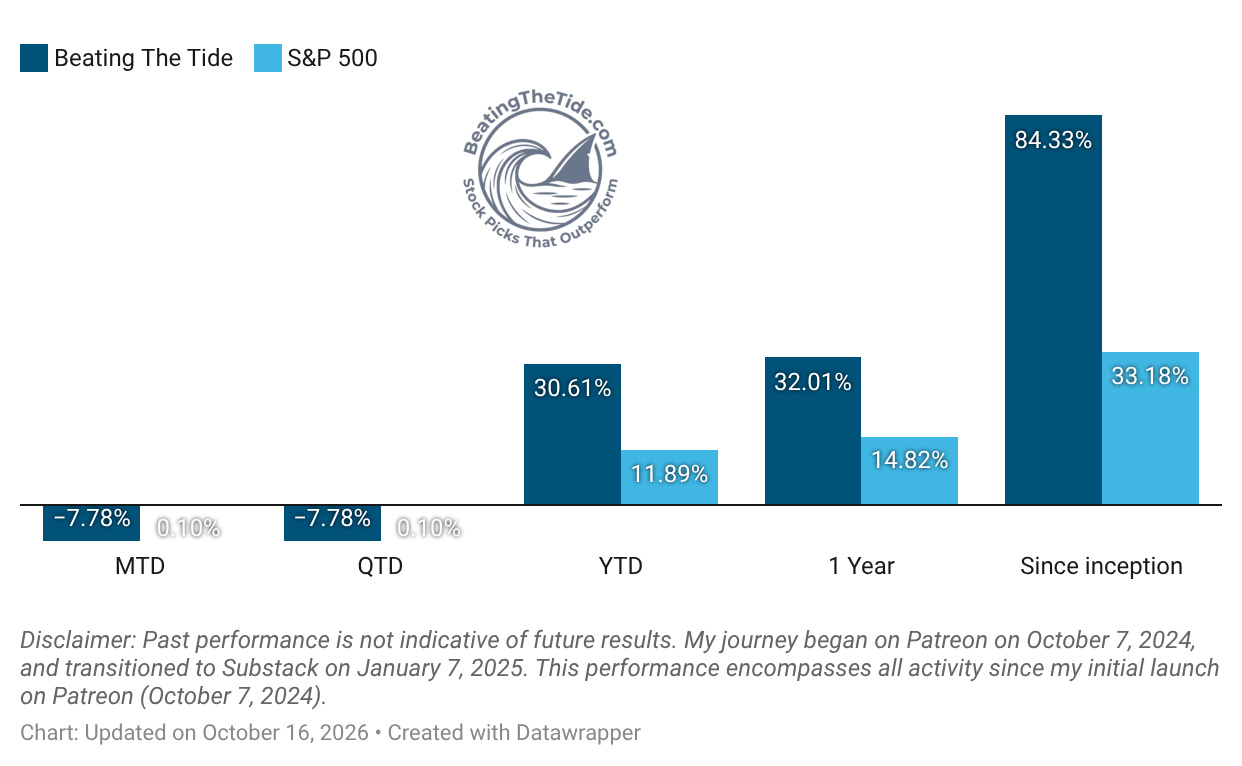
Month-to-date: -7.8% vs. the S&P 500’s +0.1%.
Year-to-date: +30.6% vs. the S&P 500’s +11.9%. That is a gap of 1,872 basis points.
Since inception: +84.3% vs. the S&P 500’s +33.2%. That’s 2.5x the market.
Contribution by Sector

Technology cost 686 bps and industrials 126 bps, while consumer cyclicals added 17 bps, the best of a weak group. Technology took the brunt of a chip sell-off that left the Philadelphia Semiconductor Index with eight straight losses, its longest streak since 2008, after a hot September CPI print and a Barclays downgrade of AI server makers on Wednesday. Industrials, home to our data center builders, accounted for most of the rest.
Contribution by Position
How to read the heat map? Click here.
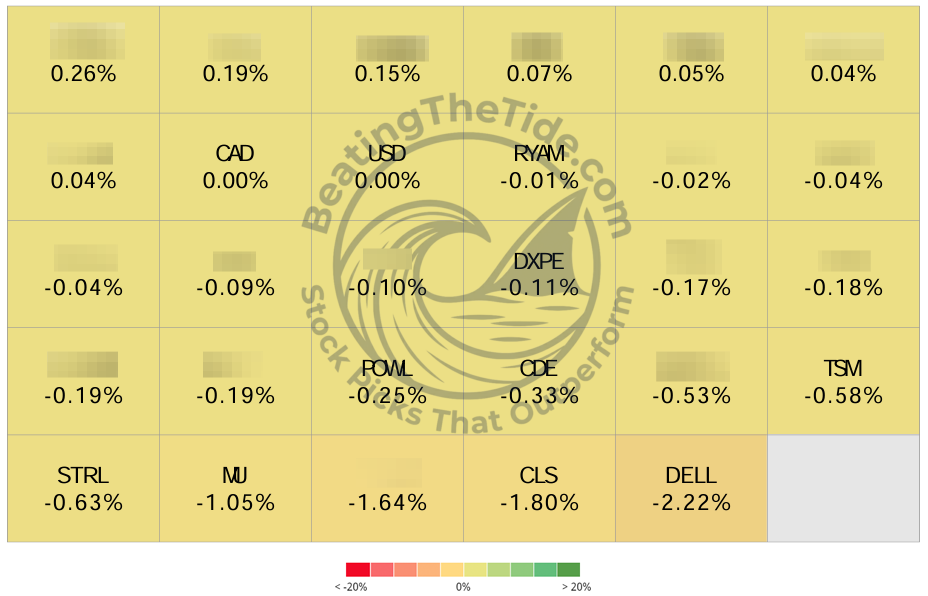
-1 bps RYAM -3.71%↓ (Thesis)
-11 bps DXPE 2.42%↑ (Thesis)
-25 bps POWL 1.10%↑ (Thesis)
-33 bps CDE 0.74%↑ (Thesis)
-58 bps TSM 1.99%↑ (Thesis)
-63 bps STRL 4.60%↑ (Thesis)
-180 bps CLS 3.09%↑ (TSX: CLS) (Thesis)
-222 bps DELL 3.90%↑ (Thesis)
That’s it for this week.
Stay calm. Stay focused. And remember to stay sharp, fellow Sharks!