



Hello fellow Sharks,
Ouch, this Weekly took me longer than I thought!
Well, this week the market hit a new all-time high again, but the portfolio still outperformed, widening the gap to the market. If you want to skip straight to the numbers, jump to the Portfolio Update.
In this Weekly, I decided to remove the paywall on the February Stock Pick. I added this stock to the portfolio at $123 on February 23rd and today it sits at $295 (a bit more than 3 months). So I reviewed the thesis and the valuation. In this Thought Of The Week, I go over whether this stock is still a buy, a hold or an exit.
Enjoy the read, and have a great Sunday.
~George
Table of Contents:
In Case You Missed It
On May 18, I sent my trade alert for the May Monthly pick.

On May 20, I followed up with the deep dive.

I closed ALL and trimmed STRL and recycled the cash into one of the most hated names in consumer staples, a business so unglamorous most people scroll right past it. It collects the waste almost nobody else wants, dead stock, used fryer oil, slaughterhouse leftovers, and turns it into proteins, fats, and renewable-fuel feedstock the economy quietly runs on.
The shares have roughly halved from their highs, a regulatory change just reset the earnings power in its favour, and a pending European deal could re-rate the highest-margin part of the business inside a year. I bought it around 40% below where my own DCF says it belongs. Boring, cash-generative, and mispriced.
The full thesis is in the deep dive above.
Thought Of The Week
Dell: My February Pick Is Up 140%. Here’s What Changed.
I like apples. My favourite type is a crunchy Granny Smith. But sometimes I feel adventurous and I go for a Red Delicious. I think apples are underrated as a fruit; many people would reach for strawberries over apples. But outside diet, apples are everywhere. An apple was the method the Evil Queen used to deliver her poison to Snow White.

Also remember what they say, “An apple a day, keeps the doctor away”.
Most importantly, we have to blame a damn apple for being kicked out of heaven.

Note that one of the most valuable and beloved companies in the world is Apple.
And if you bought the shares, you would have been more than happy.
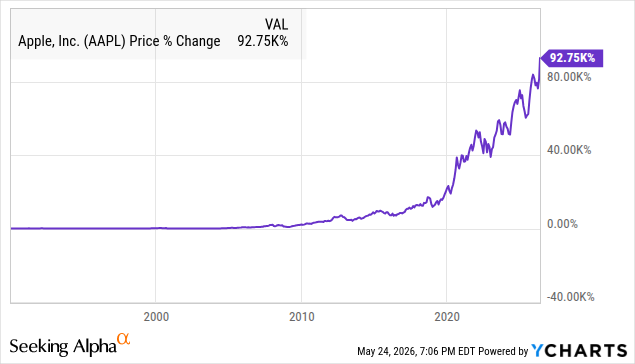
But I am here to tell you that the apple is not always better. Maybe the cultural importance of the apple is so imprinted in our DNA that we stayed laser-focused on AAPL 0.00%↑ and forgot there are other companies in the space. The only catch is that they are boring, almost aggressively boring. For example, my February stock pick has outperformed Apple.
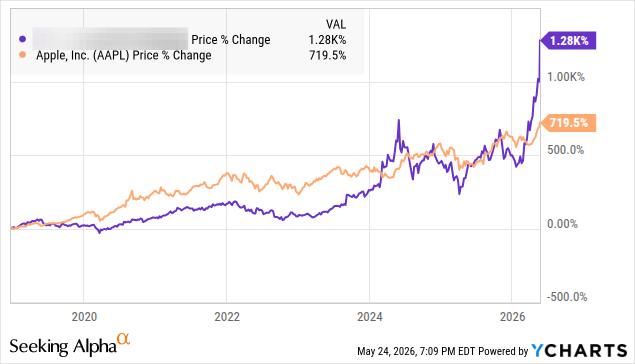
Can you guess which company it is?
It is Dell, yes, the boring laptop company. As you will see below and in the original thesis (for which I just removed the paywall), Dell has no moat, no proprietary technology, no captive audience, no material patents. Dell is an operator in a commodity space, and the reason it's attractive is that it is the best operator in that space. In hardware, where the product itself is undifferentiated, the edge is in how the business is run: a direct-to-customer model, supply-chain discipline that lets Dell reprice faster than rivals, and a negative working-capital cycle that funds growth with other people's cash. That is how thin box-selling margins turn into north of 20% ROIC. The rest of this Weekly is the story of how that edge held up once AI hit the order book.
Back on 23 February, I sent paid subscribers a trade alert: buy Dell at $123.


Four days later I followed with the deep dive.

Today I’m taking both of them public, because the investment has already done its first job, and the more interesting question is what to do from here.
Dell closed last week around $295. From the $123 entry that’s +140% in about three months.
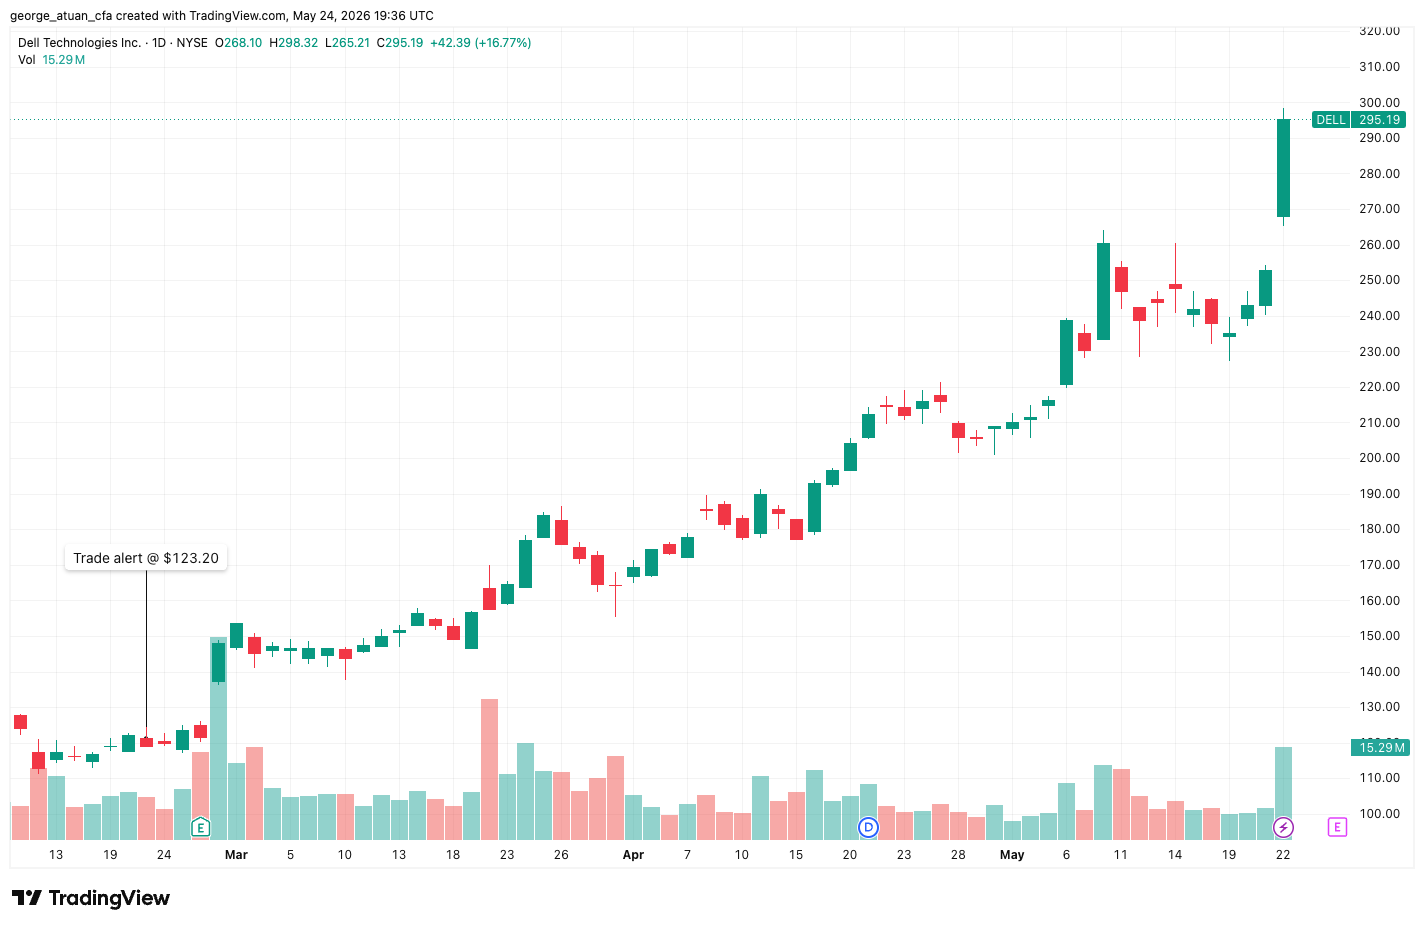
On 26 February, Dell printed a record quarter…

… and handed out FY2027 guidance that ran well past the model I built the thesis on. So this update does three things: it grades the original thesis against the numbers, walks through a revised valuation, and asks whether the risk and reward still make sense after a double.
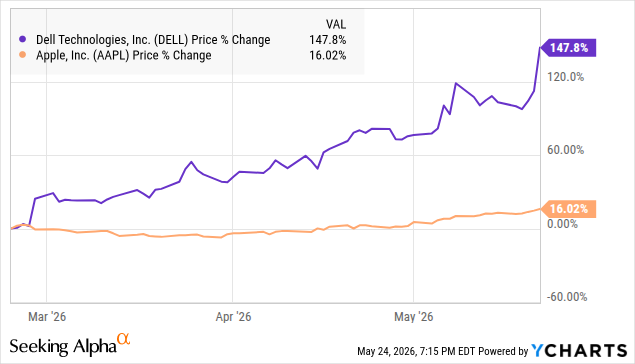
By the way, since adding Dell, it has 9x Apple’s performance.
TLDR
The trigger: Q4 FY2026 (26 February) was a record across revenue, EPS, and cash, and FY2027 guidance came in well above my original model.
Scorecard: of the five original thesis pillars, four are confirmed and one (AI-server margin) is evolving.
Biggest change: AI is no longer a promise. $64.1B of FY2026 orders, a $43B exit backlog, and a guide to $50B of AI revenue in FY2027.
Revised valuation: my DCF base case is $486, up from the original $206, on assumptions at or below Dell’s own FY2027 guidance. At $295 that is +65% upside. A 5,000-run Monte Carlo stress test is more cautious, with a $390 median and 26% of paths below today.
Verdict: BUY, conviction intact. A $486 target is +65% upside against a $200 bear, about 2 to 1 risk/reward, essentially as asymmetric as February’s setup. DELL is still a buy
Thesis scorecard after Q4 2026
In February, I argued three compounding engines were working at once, on top of an operator edge and a cash machine that few people credit. Here’s how the five pillars hold up against the print.
Pillar #1. The operator edge: Confirmed
Original thesis: Dell has no product moat, but in commodity-like hardware the best operator wins. A direct model, supply-chain discipline, and a negative-working-capital machine drive +20% ROIC.
What happened since last update: ISG operating income hit a record $2.9B at a 14.8% margin, opex fell 320bps to 9.9% of revenue, and the cash conversion cycle stayed at minus 32 days even as AI shipments scaled. When DRAM costs spiked, Dell repriced the entire server book on 10 December and tens of thousands of open PC quotes on 6 January, and margins stabilized inside the quarter.
Assessment: This is the load-bearing pillar and it got stronger. The speed of repricing is the operator edge made visible. Confirmed.
Pillar #2. The AI demand wave: Confirmed and strengthening
Original thesis: Enterprise infrastructure spend is shifting toward AI clusters and Dell sits where those orders land. At the deep dive I had Q3 data: $12.3B of AI orders and an $18.4B backlog.
What happened since last update: Q4 alone booked $34.1B of AI orders. FY2026 orders reached $64.1B, shipments $25.2B, and the exit backlog a record $43B. The customer base passed 4,000, broadening across neoclouds, sovereigns, and enterprise, and the 5-quarter pipeline grew even after converting $34.1B. FY2027 guidance calls for $50B of AI revenue, roughly double.
Assessment: The demand wave I described as a thesis is now a backlog with a delivery schedule. Confirmed and strengthening.
Pillar #3. AI today, attach later: Evolving
Original thesis: Win the AI-server footprint first, then attach higher-margin storage, networking, and services as the estate matures.
What happened since last update: Networking revenue was $5.9B (+27%), Dell IP storage demand grew double digits with PowerStore posting its eighth straight growth quarter, and management expects Dell IP to be a larger share of mix in FY2027. But AI-server margins are still mid-single-digit, and the attach uplift is gradual rather than a step-change.
Assessment: Directionally on track, but the margin payoff is still ahead, not here. Evolving.
Pillar #4. The cash machine: Confirmed
Original thesis: Negative working capital plus deferred revenue keeps invested capital low, so ROIC stays high and funds the returns.
What happened since last update: FY2026 generated over $11B of operating cash, the minus 32-day cash conversion cycle held through the AI ramp, and ROIC sits near 28% on the model. Inventory rose to position for $13B of Q1 AI shipments, but the cycle itself didn’t deteriorate.
Assessment: Confirmed. The balance sheet did exactly what the thesis needed it to.
Pillar #5. The shareholder flywheel: Confirmed and strengthening
Original thesis: Dell returns +80% of adjusted FCF through buybacks and dividends, the share count shrinks, and per-share value compounds without hypergrowth.
What happened since last update: FY2026 returned $7.5B and repurchased 54M shares, more than double FY2025.
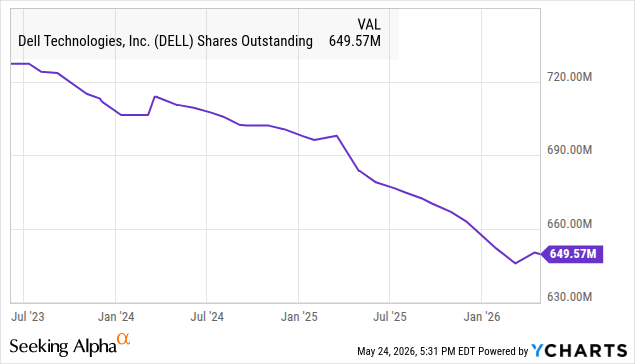
For FY2027 the dividend was raised 20% to $2.52 and the board added $10B to the buyback authorization.
Assessment: Confirmed and strengthening. The flywheel is spinning faster.
Q4 FY2026 results review
The quarter was a clean beat on numbers that matter. Revenue and EPS both set records, and the cash flow that funds the flywheel came through.

ISG carried the quarter. Infrastructure revenue was a record $19.6B, up 73%, with AI server revenue of $9.0B and ISG operating income a record $2.9B at a 14.8% margin, up 240bps sequentially. AI revenue rose more than 4x y/y. This is the proof point the thesis needed: Dell can scale AI volume and still expand segment profit because storage mix and traditional-server profitability carry the margin.
CSG is where the operator chose growth over margin. Client revenue rose 14% to $13.5B and Dell took share, but operating margin sat at 4.7% because management deliberately delayed PC price increases to capture the buyer base before raising on 6 January. That’s a choice, not a problem, provided the margin normalizes, which management says began immediately after the January reset.
Guidance: then vs now
The single most important change since February is the forward guide. When I wrote the deep dive, my model assumed a far more modest FY2027. Management’s actual guidance is materially higher.

Management credibility: Dell has a pattern of guiding conservatively and beating, and the second-half FY2027 guide was described as deliberately prudent on supply.
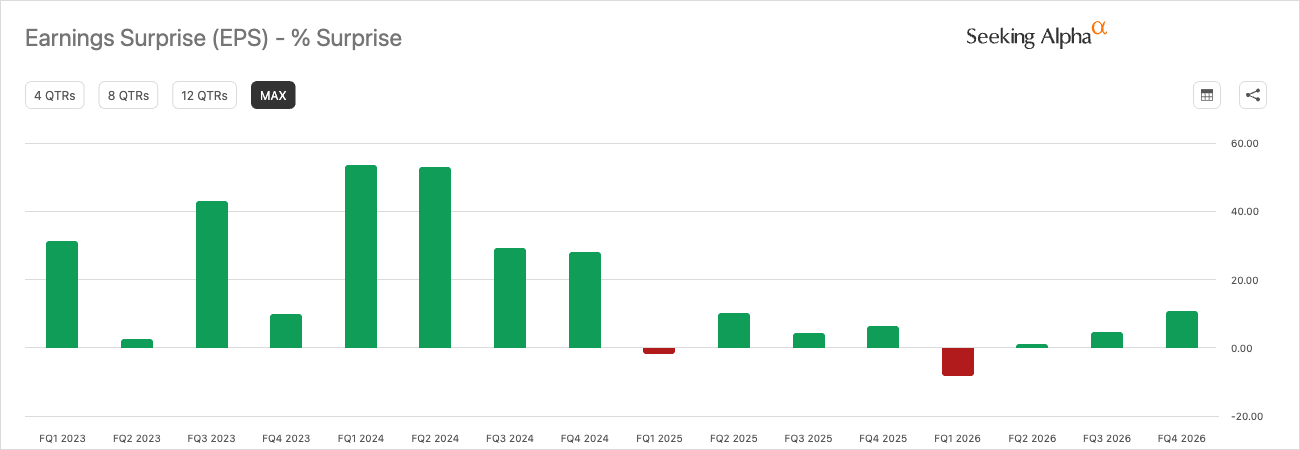
I treat the revenue guide as closer to a floor than a ceiling. The one place to stay honest is reported gross margin: as AI grows to 35% of revenue at mid-single-digit margins, the blended gross margin is pressured even as it rises excluding AI mix.
Valuation: from $206 to $486, and the assumptions behind it
My original base-case fair value was $206 per share, about +73% above the $123 entry, built on WACC of 8.6%, an unlevered beta of 1.31, and 2.5% terminal growth. I wrote it before Q4 and flagged it as likely conservative, because the FY2027 guide already looked stronger than my model. It was.
Last week, I rebuilt the DCF on the assumptions above, and it lands at a $486 base case, +65% above today.
The $486 base case is not a stretch. It falls out of the DCF on assumptions that sit at or just below what Dell guided for FY2027. The two tabs below are the build.
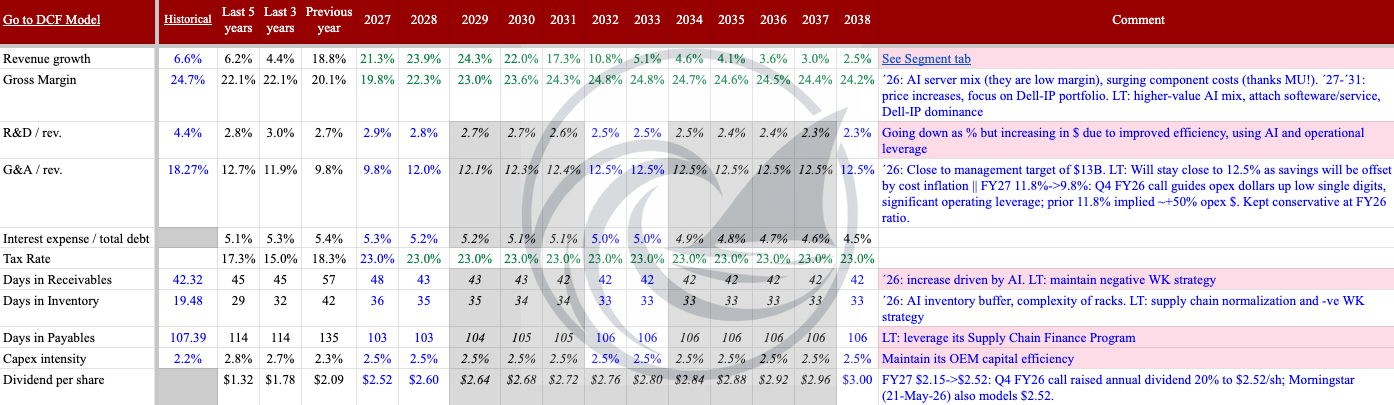
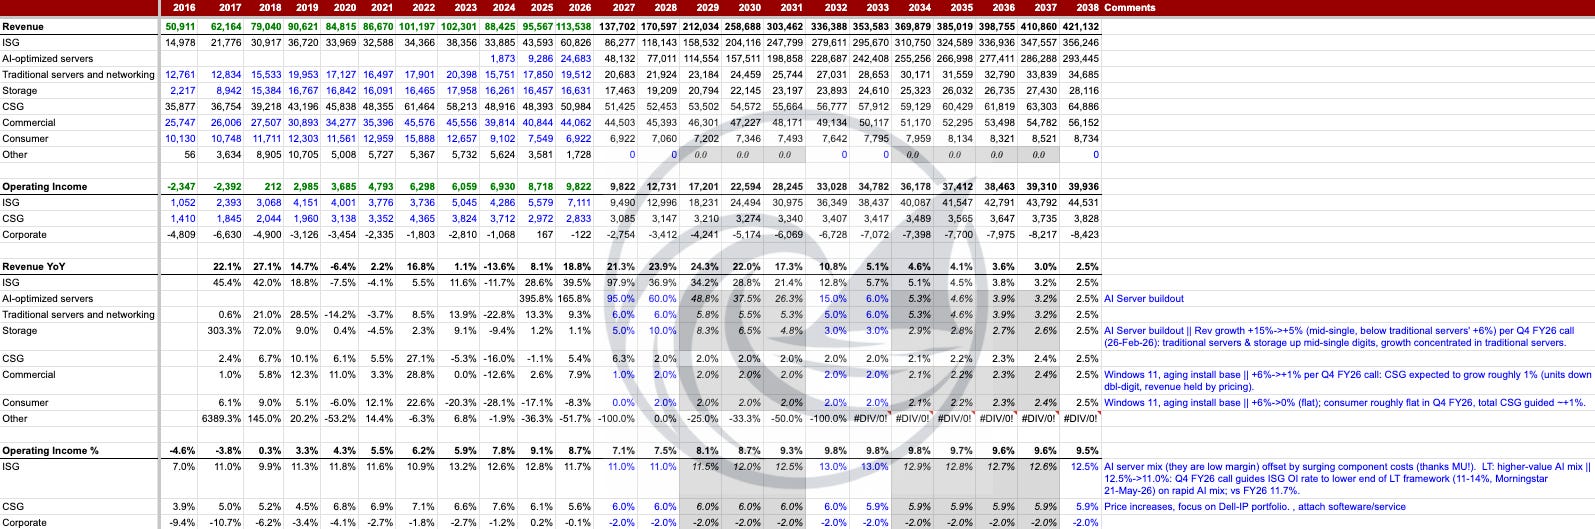
You can review the full model here: View DCF Model
On the segments tab I model FY2027 AI-server revenue up 95%, just under the company’s roughly 100% guide; traditional servers up 6% and storage up 5%, the mid-single-digit range management called for; and CSG up 1%, matching its guide. ISG operating margin sits at 11%, the low end of Dell’s 11 to 14% framework, exactly where management pointed on AI mix.
On the assumptions tab, gross margin steps down to 19.8% as the AI mix dilutes it, G&A falls to 9.8% of revenue for the operating leverage management promised, capex holds at 2.5%, and the dividend rises to $2.52. That builds to about $138B of FY2027 revenue, inside the $138B to $142B guide, discounted at an 8.5% WACC to a 2.5% terminal, and produces a fair value of $486. Every input is at or below Dell’s own guidance, which is why I treat $486 as probable rather than optimistic.
To pressure-test it, I also ran 5,000 Monte Carlo simulations inside the model, varying the five inputs that matter most. The distribution is more cautious than the point estimate: a median of $390, a mean of $418, and a wide range that reflects how much still rides on AI.
The five Monte Carlo inputs, and why I chose them
I’d rather show the full assumption set than hide behind a single point estimate.
I built that Monte Carlo as a free Google Sheets add-on. If you want it for your own models, you can download it here, free.
The five stochastic drivers, each drawn 5,000 times:
AI server revenue growth: 28% CAGR (2027-2032) mean, 3% standard deviation.
ISG operating margin: 11.5% mean, 2% standard deviation, the lower end of Dell’s 11-14% framework.
CSG operating margin: 6.0% mean, 1% standard deviation.
WACC: 8.5% mean, 1% standard deviation.
Capex intensity: 2.5% of revenue mean, 1% standard deviation.
Held fixed: traditional servers and storage growing 4% a year, CSG 1.5%, a 23% tax rate, 2.5% terminal growth, the negative-working-capital cash benefit Dell consistently delivers, 640M diluted shares, and net debt of roughly $19B. Corporate costs run at 2% of revenue.
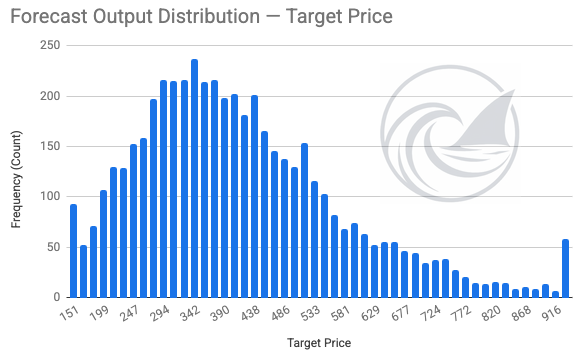
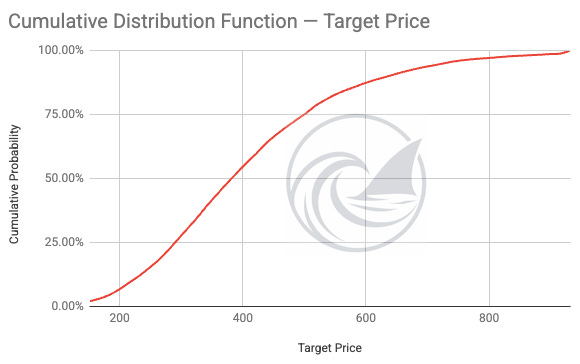
Reading the distribution: the median sits at $390 and the mean at $418, higher than the median because the AI upside tail is fat, the 90th percentile is $646 and the 95th is $734. The downside is real too: the 5th percentile is $196, the 10th is $229, and about 26% of the 5,000 paths land below today’s $295. This is not a one-way bet.
Where the risk lives: the simulation’s sensitivity output is more useful than the point estimate. ISG operating margin drives about 48% of the variance in fair value, WACC another 40%, and the AI growth rate only 11%; CSG margin and capex are rounding errors. The valuation hinges far more on whether Dell holds its server margins, and on what rate you discount at, than on the exact AI number.
What the market is pricing
Here’s the part that keeps me holding. At $295, Dell trades near the 25th percentile of my simulation, where the 25th-percentile outcome is roughly $298. The market is underwriting a below-median AI and margin path. About three-quarters of the simulated outcomes still sit above today’s price, and the mean at $418 is +42% higher. You don’t need the bull case; you need the below-median case to be too pessimistic.
Risk and reward today
Has the run used up the asymmetry? Do the math and the answer is no. In February, at $123, the $206 target was +67% upside against a $75 bear, a -39% downside, about 1.7 to 1. Today, at $295, the $486 target is +65% upside against a $200 bear, a -32% downside, about 2 to 1. The upside percentage is almost identical, and because the bear floor has risen from $75 to $200 the downside percentage is actually smaller, so the setup is about as asymmetric as it was in February, arguably a touch better.
Risk register
The thesis can still be wrong. Here’s what would do the damage, strongest first.
First, AI-server margins stay mid-single-digit forever. The entire attach thesis (Pillar #3) rests on storage, networking, and services pulling blended margins up over time. If AI stays a low-margin pass-through and hyperscalers keep the pricing power, Dell grows revenue without growing economic profit, and the multiple compresses.
Second, an AI digestion air-pocket. Backlog is not revenue until it ships, and a hyperscaler capex pause or a sovereign deal slipping would make the $43B backlog convert slower and lumpier than the guide implies.
Third, a DRAM and NAND cost super-cycle. Spot DRAM is up 5.5x in six months (this helps our MU 0.00%↑ position). Dell reprices fast, but if component inflation outruns the pricing engine, ISG and CSG margins compress before the cost is passed through. This is the live risk into the FY2027 second half.
Fourth, PC and CSG weakness. Management guides CSG to roughly +1% with units down double digits. If the Windows refresh disappoints, even that modest growth is at risk, and CSG margin stays pinned near 5%.
Fifth, the valuation. At 34x earnings Dell trades close to the sector’s 35x, but that is double its own 5-year average of 16x.
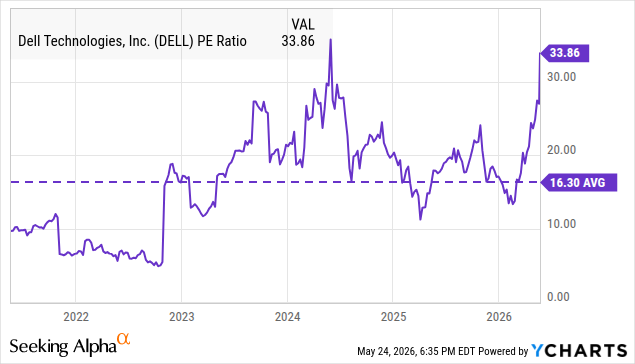
The cheap operator the market mistook for a box-shifter has re-rated, and a multiple at twice its historical norm leaves little room for a stumble, so the stock now needs execution, not just a re-rating.
If Dell trades down meaningfully, the most likely cause is customer concentration: the neoclouds, sovereigns, and hyperscalers that drive the AI orders also hold the bargaining power, and a single large customer renegotiating terms can move a quarter. That’s the structural tension in being the best operator in a business with no pricing moat.
Performance vs peers
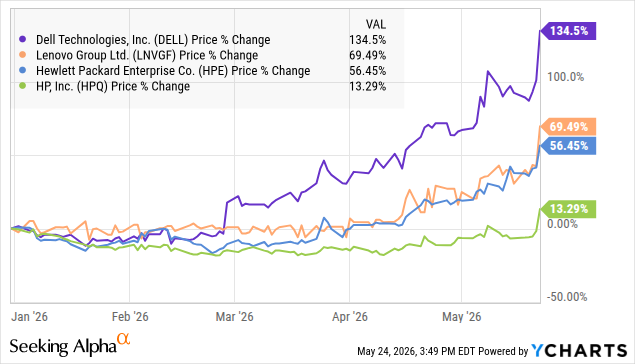
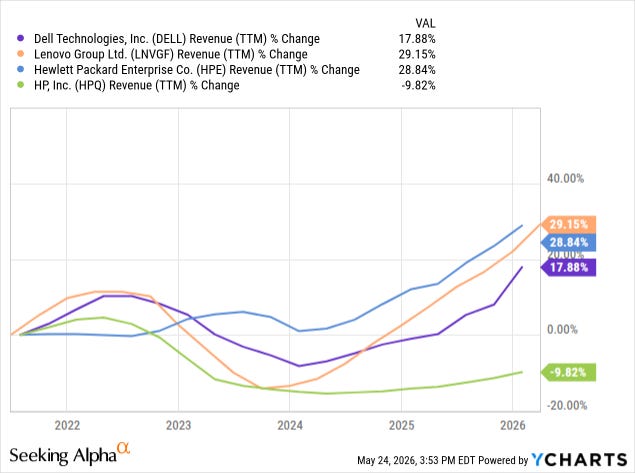
YTD Dell is up 134.5%, the best in its hardware peer group: Lenovo +69.5%, HPE [HPE 0.00%↑] +56.5%, and HP [HPQ 0.00%↑] +13.3%. The whole AI-hardware complex re-rated, but Dell led it. The charts below explain why the market singled Dell out.
Here’s the twist. Dell didn’t win on growth. On trailing revenue Dell is up 17.9%, behind Lenovo’s 29.2% and HPE’s 28.8%; only HP shrank, at -9.8%.
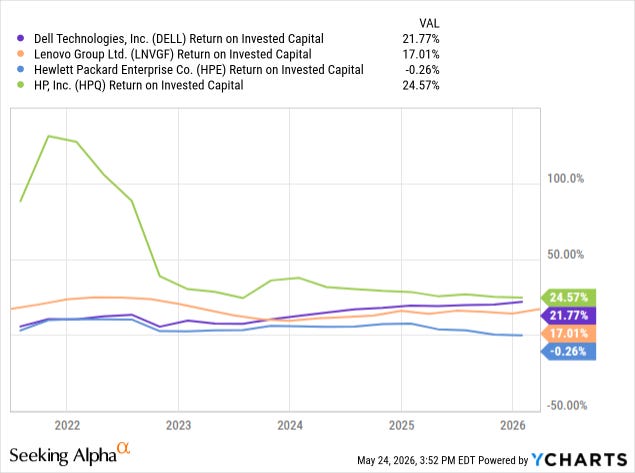
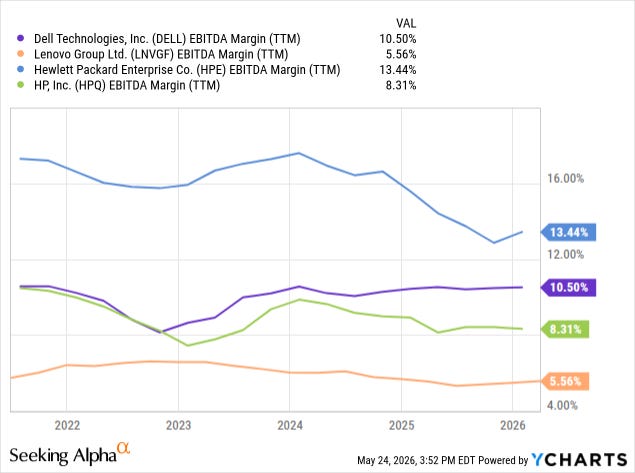
It won on returns. Dell’s ROIC is 21.8%, second only to HP’s 24.6% and far ahead of Lenovo’s 17.0%, while HPE, the apparent margin leader at a 13.4% EBITDA margin, earns essentially nothing on capital at -0.3%.
Dell’s own EBITDA margin of 10.5% sits mid-pack, but it converts that margin into elite returns. That gap is the operator thesis in one place.
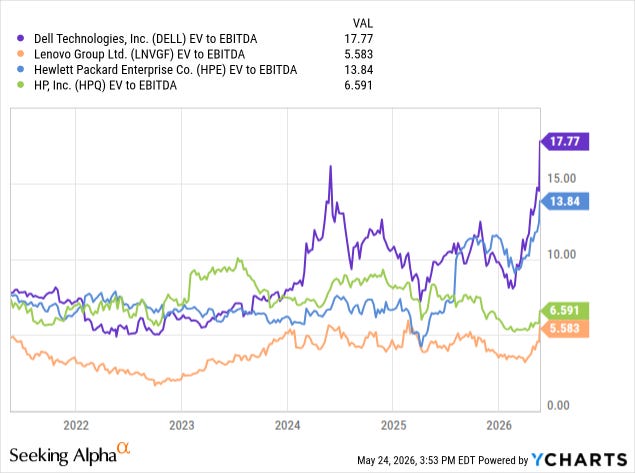
The re-rate shows up in the multiple. Dell now trades at 17.8x EV/EBITDA, the richest in the group, against HPE at 13.8x, HP at 6.6x, and Lenovo at 5.6x. In February Dell was the cheap operator the market mistook for a box-shifter. After the stock run, it is the premium name, and that multiple is the clearest sign the relative trade has played out: the market now credits the operator edge it ignored three months ago.
What to watch: Q1 FY2027
Dell reports Q1 FY2027 on 28 May.

I expect beats on both the top and the bottom line; the $43B AI backlog, strong server demand into the quarter, and the read-through from Lenovo all point that way. What I wouldn’t bet on is the kind of jump the stock had last week. That move came off Lenovo’s results, where blow-out AI-server and infrastructure growth lifted the entire hardware group, Dell included, on the read-through. A good chunk of the good news for Dell’s own quarter may already be in the price. A beat that merely meets the higher bar the market has now set is not the same as a beat that surprises it, so I’m positioned for a solid print and a muted reaction.
Verdict
BUY, conviction intact. At $295 against a $486 base case, Dell offers +65% upside with roughly 1 to 2 risk/reward, and the operator edge, the AI backlog, and the buyback flywheel keep compounding per-share value.
Portfolio Update
The market continues to hit all-time highs. But the portfolio advances more than the S&P 500, widening the outperformance (+1.84% vs. +0.88%).
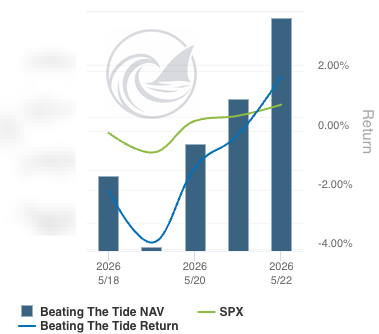
Portfolio Return
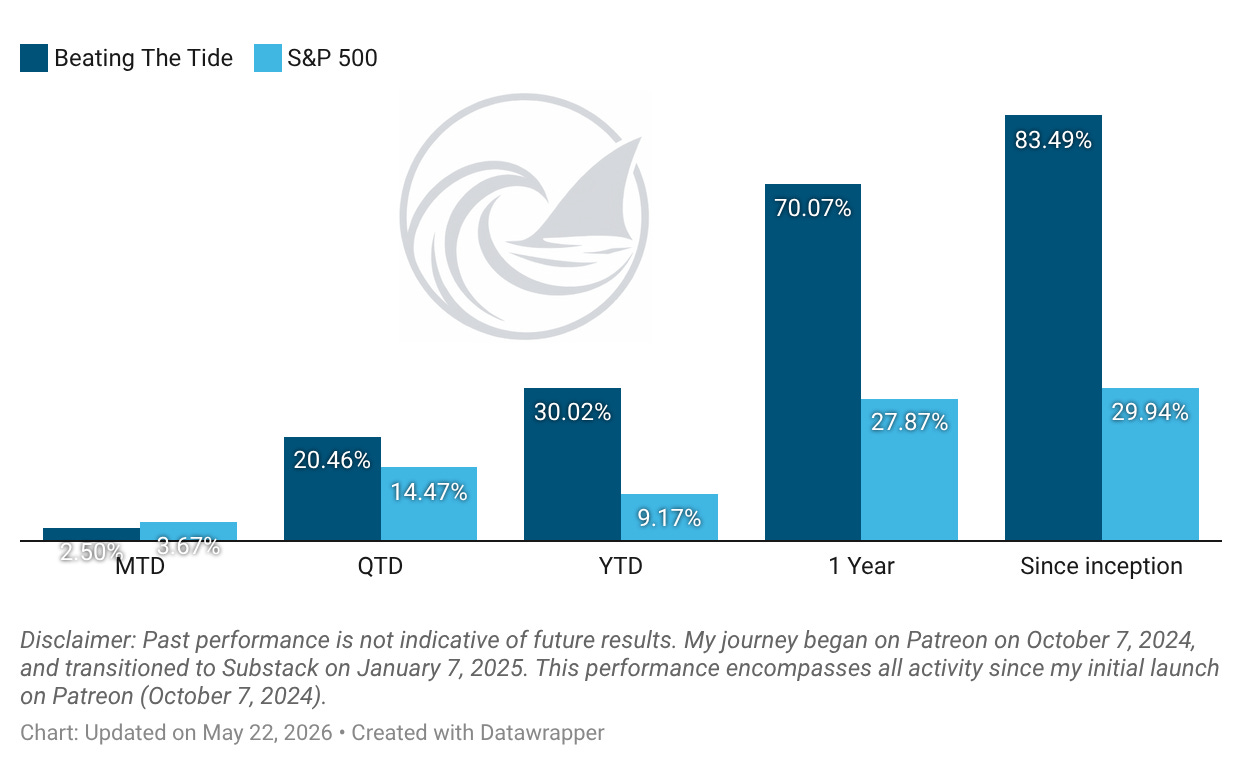
Month-to-date: +2.5% vs. the S&P 500’s +3.7%.
Year-to-date: +30.0% vs. the S&P 500’s +9.2%. That is a gap of 2,085 basis points.
Since inception: +83.5% vs. the S&P 500’s +29.9%. That’s 2.8x the market.
Contribution by Sector

Tech led the gains, partially offset by industrials.
Contribution by Position
(For the full breakdown plus commentary on earnings results and the big movers, see Weekly Stock Performance Tracker)
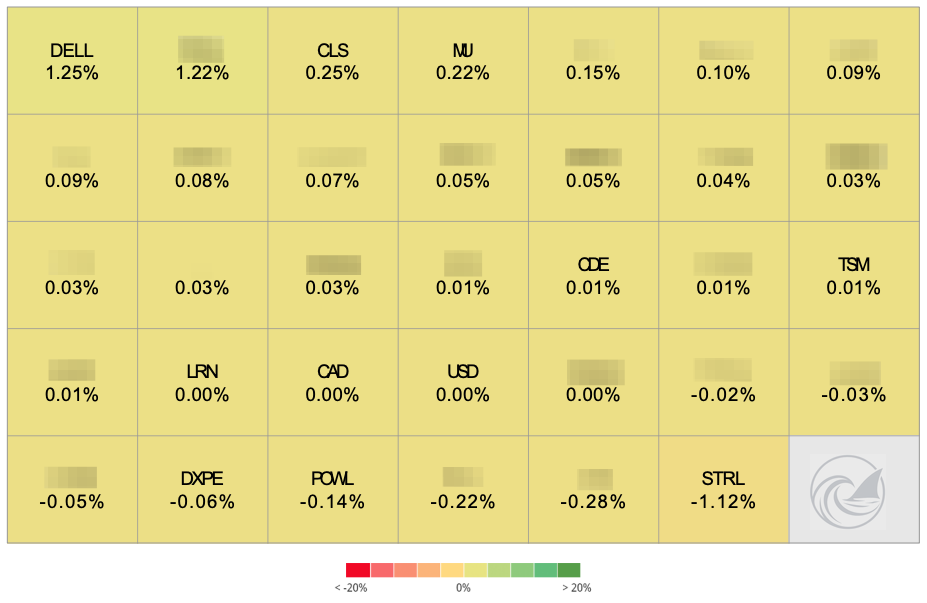
+125 bps DELL 0.00%↑ (Thesis)
+25 bps CLS 0.00%↑ (TSX: CLS) (Thesis)
+1 bps CDE 0.00%↑ (Thesis)
+1 bps TSM 0.00%↑ (Thesis)
flat LRN 0.00%↑ (Thesis)
-6 bps DXPE 0.00%↑ (Thesis)
-14 bps POWL 0.00%↑ (Thesis)
-112 bps STRL 0.00%↑ (Thesis)
That’s it for this week.
Stay calm. Stay focused. And remember to stay sharp, fellow Sharks!
Further Sunday reading to help your investment process: