

Weekly #75: 7 Mines, 3 Metals, One Thesis
Portfolio +6.4% YTD, 4.7x the market since inception. Plus, seven North American mines, $2B in expected free cash flow, and a metals cycle tailwind. Is CDE still a buy after a 42% drop?

 investment thesis focused on North American assets, lower geopolitical risk, and valuation upside")
Hello fellow Sharks,
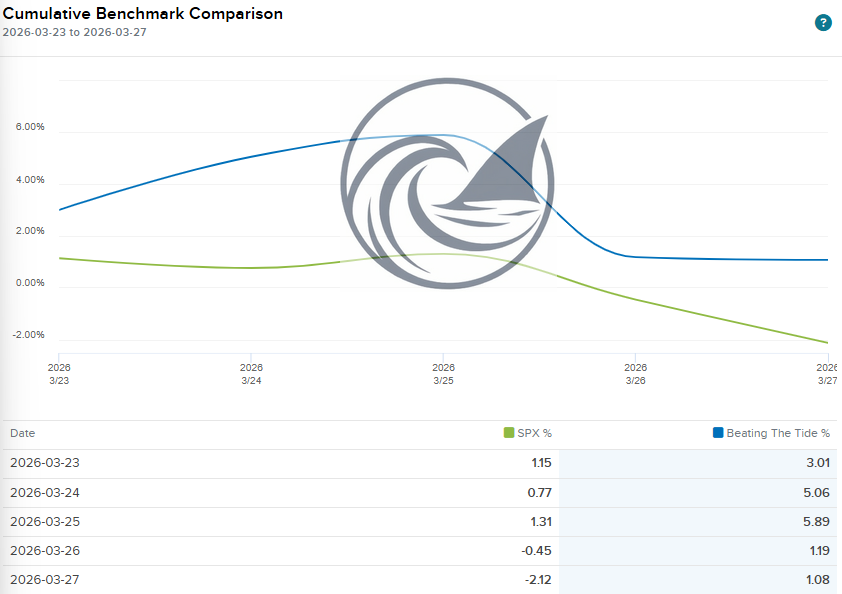
The war drags on and the S&P 500 keeps falling. The portfolio, meanwhile, keeps climbing. This week it widened the gap further, now sitting at 4.7x the S&P 500 since inception. If you want to skip straight to the numbers, jump to the Portfolio Update.
Getting work done this week was a challenge. We fly back to Toronto on April 3rd, so the last few days have been a blur of errands and logistics. Between packing and chasing paperwork, one thought kept surfacing: a line from Elon Musk about rules. His argument is that the only real limitation is physics. Everything else is a choice. He was talking about the military and NASA layering pointless bureaucratic rules onto spaceflight, rules that no one created with a purpose and no one can trace back to a reason. They exist because someone wrote them down decades ago and no one ever questioned them.
That reminded me of the monkey ladder experiment. The setup: put five monkeys in a cage with a ladder and a banana at the top. Every time a monkey climbs toward the banana, spray all five with cold water. Eventually, the monkeys stop any monkey from climbing the ladder, even after you replace the original five one by one. New monkeys enforce the rule without knowing why it exists.
Sound familiar?
Why am I telling you this? It has nothing to do with investing, except that it does. I spent several hours this week trying to get a travel document from a Chilean government ministry. To get that document, I needed a document from a different ministry. That second ministry required a document from a third ministry, which requires a document from the first ministry. A circular reference, except this one has no Ctrl+Z. Chilean bureaucracy is in a league of its own.
Here is the investing angle: the companies that disrupted entire industries were almost always built by people who got fed up with the existing system and refused to accept it. Reed Hastings did not start Netflix because he saw a market opportunity in DVDs. He started it because Blockbuster charged him a $40 late fee and he was frustrated enough to do something about it. Frustration is underrated as a founding motivation. I will save that thread for another week.
This week, I go deep on CDE. It is a position I did not choose. I inherited it when NGD merged with Coeur Mining. By the time NGD and CDE merged, we locked in a 85.8% gain.

Here is the original NGD thesis.

That raises a fair question: should I hold it or cut it loose?
Short answer: keep it.
For the long answer, grab a coffee.
Enjoy the read, and have a great Sunday.
~George
Table of Contents:
Thought Of The Week
Coeur Mining (CDE): The New North American Precious Metals Powerhouse
Two years ago, Coeur Mining [CDE 0.00%↑] was a company fighting for survival. Leverage had ballooned past 4x. FCF was negative $297M. The Rochester mine expansion, a bet-the-company $730M project, was running behind and over budget. The stock traded below $3.
 weekly stock price chart from 2019 to 2024 on NYSE, showing peak near $12.75 in early 2021 during silver and gold bull market, followed by multi-year decline to lows near $1.50 in 2023, with partial recovery toward $3-4 range in 2024 — Coeur Mining stock history, CDE investment thesis, silver miner valuation, precious metals equity analysis")
Today, Coeur sits on $554M in cash, carries net leverage of negative 0.2x, and just closed a $7B merger that creates the only all-North American senior precious metals producer. Management is guiding for $3B in EBITDA and $2B in FCF for 2026. They just authorized a $750M buyback and declared their first-ever dividend.
The turnaround is real. The question now is whether the market has caught up.
Since the January highs, gold has pulled back from $5,589 to $4,500.
 January to March 2026 via Pepperstone, showing gold’s historic rally from approximately $4,300 to an all-time high near $5,592, followed by sharp pullback to $4,507 by late March 2026 — gold price 2026, gold all-time high, precious metals bull market, gold miner investment case, CDE Coeur Mining gold exposure, XAU/USD price history")
Silver has dropped from $121 to $69.
 January to March 2026, showing silver’s explosive rally from approximately $75 to an all-time high near $121.52 per ounce in late January 2026, followed by sharp correction back to $69.88 by late March 2026 — silver price 2026, silver all-time high, silver bull market, silver miner valuation, Coeur Mining CDE silver exposure, precious metals investment thesis, XAG/USD price history")
CDE has fallen from $27.72 to $17.10.
 daily stock price chart on NYSE, January to March 2026, showing CDE rally from approximately $18 to a 2026 high near $27.72 in late January alongside the silver and gold price surge, followed by sharp correction back to $17.13 by late March 2026 — Coeur Mining stock 2026, CDE price target, silver miner stocks, gold miner equities, CDE investment thesis, precious metals equity performance, Coeur Mining SilverCrest merger")
That creates a window worth examining. Because behind the noise is a business that has fundamentally changed its cost structure, its balance sheet, its production profile, and its strategic position.
TLDR
CDE is a US-based precious metals producer with seven wholly-owned North American operations producing gold, silver, and now copper following its March 2026 acquisition of New Gold [NGD 0.00%↑].
The bull case rests on a transformed cost and production profile: 2025 adjusted EBITDA tripled to $1B, FCF surged to $666M, and the NGD merger is expected to push combined 2026 EBITDA past $3B with $2B in FCF.
The key risk is the 42% pullback in CDE shares mirrors a 20% correction in gold and silver prices from January peaks. If metals prices mean-revert further, the inflated earnings power evaporates. Integration risk from the New Gold merger also looms.
My NAV model values Coeur at roughly $19.88 per share on a conservative base case. But the base NAV understates true value: unpriced resource optionality, exploration platform value, mine-life extensions, and the K-Zone copper-gold deposit.
From Near-Death to North American Leader: The Coeur Mining Story
CDE was incorporated in 1928 and is headquartered in Chicago. For most of its history, it was a mid-tier silver and gold producer, often punching below its weight. The company cycled through acquisitions, divestitures, and operational struggles across the Americas and beyond.
The turning point came in the early 2020s. Under CEO Mitch Krebs, who has led the company for over two decades (first as CFO, then CEO), Coeur made two high-stakes bets. First, it committed $730M to expand its Rochester mine in Nevada into one of the largest open-pit heap-leach silver operations in the US. Second, it acquired SilverCrest Metals in February 2025 for $1.8B, adding the high-grade Las Chispas silver-gold mine in Mexico.
Both bets were risky. Rochester’s expansion ran over budget and behind schedule, pushing leverage above 4x at one point. But by mid-2025, Rochester was hitting its stride, crush tonnage was climbing toward design capacity, and Las Chispas was gushing cash. In 10.5 months of contribution, Las Chispas generated $286M in FCF.
Then in November 2025, CDE announced a $7B all-stock acquisition of NGD, adding the New Afton copper-gold mine in British Columbia and the Rainy River gold mine in Ontario. The deal closed on March 20, 2026, creating a seven-mine, all-North American platform.
That is three transformative moves in three years. The company went from a stressed balance sheet with four mines to a net cash position with seven mines across three countries, producing gold, silver, and copper. Whether you think that is brilliant capital allocation or empire building depends on what the next two years bring.

How the Business Makes Money: Seven Mines, Three Metals
CDE is a straightforward business. It mines precious and base metals from the ground, processes them, and sells the output at prevailing market prices. Revenue is a function of two variables: ounces produced and price received. Costs are a function of geology, operational efficiency, energy prices, labor, and government take.
Post-merger, the combined company operates seven mines
Las Chispas (Sonora, Mexico): The Cash Cow
An underground silver-gold mine acquired from SilverCrest in February 2025. In its first 10.5 months under CDE, it produced 54,705 oz of gold and 5.1M oz of silver and generated $286M of FCF. That is a staggering return. Average grades of 4.4 g/t gold and 409 g/t silver make this one of the highest-grade operations in the world. The mine has five years of reserve-based life (2030) with exploration upside from new vein discoveries (Augusta, Promesa, Lupita). 2026 guidance calls for 55,000 to 65,000 ounces of gold and 5.5 to 6.3 million ounces of silver.
Palmarejo (Chihuahua, Mexico): The Workhorse
An underground gold-silver complex that produced 100,768 oz of gold and 6.5M oz of silver in 2025, generating $155M in FCF. Palmarejo’s story has an important wrinkle: 40-50% of its gold production is sold to Franco-Nevada under a streaming agreement at $800 per oz. With gold at $4,500, that means CDE hands half its Palmarejo gold to Franco for roughly 18 cents on the dollar. That is a meaningful drag on profitability.
The good news is CDE is aggressively exploring east of the Franco-Nevada area of interest, where 70% of the 2026 exploration budget is now allocated. Maiden resources at San Miguel, La Union, and Independencia Sur are all royalty-free. The 2025 reserve update extended Palmarejo’s mine life by five years and grew reserves by 36-40%. If CDE can shift more production outside the Franco boundary over time, the economics improve materially.
Rochester (Nevada): The Beast Waking Up
America’s largest source of domestically produced silver. Rochester is an open-pit heap-leach operation that underwent a $730M expansion. In 2025, it produced 60,178 oz of gold and 6.1M oz of silver, with y/y increases of 54% and 40%. FCF reached $101M after being negative in prior years.
The operation is still ramping toward its target crush size of 5/8 inch (it ran at P80 around 0.84 inch in Q4 2025). As crush size improves, silver recoveries should climb toward 60%, which would be a meaningful production tailwind. Rochester has a 16-year reserve mine life and a large adjacent land package (Lincoln Hills, Wilco) with brownfield expansion potential. 2026 guidance: 70,000 to 90,000 oz of gold and 6.4 to 7.8M oz of silver. This mine has more upside left than the market appreciates.
Kensington (Alaska): The Steady Eddie
An underground gold mine that produced 106,068 oz of gold in 2025 and generated $92M in FCF. The Q4 quarter was Kensington’s best ever: $51M of FCF on the back of 29,567 oz at $1,533/oz costs. A multi-year underground development program has improved operational flexibility and extended reserve life to roughly five years. 2026 guidance: 98,000 to 110,000 gold oz.
Wharf (South Dakota): The Surprise
An open-pit heap-leach gold mine that CDE bought for $99.5M in 2015. It has since returned over $600M in cumulative FCF. In 2025, it generated $162M in FCF. The big news: a 2025 reserve update nearly doubled mine life to 12 years and tripled inferred resources to 1.5M oz. A fire at the tertiary crusher in Q4 will weigh on early 2026 production but a new, larger crusher is being installed in Q2 2026, which should improve throughput, recoveries, and energy costs going forward. 2026 guidance: 72,000 to 90,000 gold oz (back-half weighted due to crusher replacement).
New Afton (British Columbia, Canada): The Copper Card
A block-cave copper-gold mine that is CDE’s entry into copper production. The C-Zone cave is ramping up in 2026 with throughput expected to reach 15,000 tonnes per day. Nine-month 2026 guidance: 60,000 to 80,000 oz of gold and 50M to 65M pounds of copper. The longer-term story here is the K-Zone, where an initial resource of 48M tonnes of M&I plus 6M tonnes of inferred was announced. This represents a potential multi-decade mine life extension, with a feasibility study kicking off in the second half of 2026. Capital investment for K-Zone development will likely run around $600M, spread over several years leading up to 2032.
Rainy River (Ontario, Canada): The Volume Producer
A large open-pit and underground gold mine that produced 290,236 oz of gold in 2025 and is positioned for its highest-ever annual production. The reserve-based mine life was extended by two years out to 2035 with the addition of a Northwest pit extension. Nine-month 2026 guidance: 230,000 to 275,000 gold oz. The CFO noted that even with only nine months of contribution, Rainy River and New Afton are expected to be CDE’s two largest FCF contributors in 2026. That is a telling data point.

The Macro Backdrop: Why Precious Metals Miners Matter Now
The backdrop for this thesis is a precious metals market that has undergone a structural shift. Gold hit a record $5,589 per oz in January 2026 before pulling back to around $4,500 today. Silver touched $121 before correcting to $69. Copper sits above $5 per pound.
The structural drivers behind this metals cycle remain intact. Central banks added over 1,000 tonnes of gold to reserves in 2024, the third-largest annual increase on record. Countries like China, Poland, and Turkey continue buying regardless of price. Geopolitical uncertainty, from the Russia-Ukraine conflict to Iran tensions to disruptions in the Strait of Hormuz, keeps safe-haven demand elevated. The Fed has signaled a shift toward easing, which historically supports gold by lowering the opportunity cost of holding non-yielding assets. Wells Fargo, JPMorgan, and UBS all have year-end gold targets of $6,000-$6,300.1
The recent pullback in metals prices is worth acknowledging. Gold dropped 20% from its January peak. Silver fell even harder, from $121 to $69. These drawdowns are painful but not unprecedented in a secular bull market. Gold saw similar corrections in both the 1980s and the 2010s bull runs before resuming its uptrend.
 from 1971 to 2026, showing the full long-term history of gold prices including the 1980 peak near $800, the two-decade bear market consolidation from 1980 to 2000, the 2000s bull run to approximately $1,900 in 2011, the subsequent multi-year correction and recovery, and the parabolic 2024-2026 rally to an all-time high near $5,592 — gold long-term price history, gold bull market cycles, gold correction and recovery pattern, precious metals secular bull market, gold price all-time high 2026, gold miner investment thesis")
The question is not whether volatility will continue but whether the structural demand drivers remain in place. I believe they do.
For miners, the math at current prices is extraordinary. Even at $4,500 gold, CDE’s lowest-cost mine (Palmarejo at $700-$900/oz) earns a margin of $3,500 per oz. Even Kensington, the highest-cost legacy CDE mine at $1,750-$1,950/oz, earns margins above $2,400. That kind of pricing power has not existed in the gold mining industry for decades.
On the supply side, global gold mining output is expected to peak around 2027 before plateauing. New mine development takes 10 to 15 years from discovery to production. There is no wave of new supply coming. Companies that already have producing, long-lived assets in safe jurisdictions are positioned to capture that scarcity premium. CDE, with seven mines averaging roughly 10 years of remaining mine life and all located in Canada, the U.S., and Mexico, fits that profile.
Competitive Positioning: What Makes This Platform Different
The precious metals mining landscape is dominated by Newmont [NEM 0.00%↑], Barrick [B 0.00%↑], Agnico Eagle [AEM 0.00%↑], and a handful of other large-caps. CDE is not in that weight class on a production basis, but it occupies a unique niche that is hard to replicate.
First, it is the only senior producer with all assets in North America. This matters more than it sounds. Mining in Africa, Central Asia, or Latin America (outside of Mexico) introduces political risk, currency risk, tax risk, and community risk that investors increasingly discount. CDE faces none of this. Its biggest jurisdiction risk is Mexico, where it has operated for years and has established relationships.
Second, the metals mix is unusual. Post-merger, revenue splits roughly 65% gold, 30% silver, and 5% copper. CDE remains a top-five global silver producer. That silver exposure provides differentiated torque in a silver bull market that many peers lack. The copper component, though small, adds a hedge against precious metals weakness (copper follows industrial demand, not just safe-haven flows).
Third, the FCF yield is among the highest in the sector. Management guided for $2B of FCF on a $16.7B market cap. Even adjusting for the recent pullback, that implies a double-digit FCF yield of 12% at current metals prices. Most senior gold producers offer mid-single-digit yields.
Where CDE is vulnerable: it lacks the mega-scale and Tier 1 asset base ofAEM or NEM. None of its individual mines, except perhaps the Rainy River-New Afton combination, would be considered world-class on their own. The portfolio works because of diversification and aggregate output, not because of a single dominant asset. If any two mines underperform simultaneously, the thesis weakens.

Management and Capital Allocation
Mitch Krebs has run CDE for over a decade. His track record is mixed but improving. On the positive side, the SilverCrest acquisition looks brilliant in hindsight. The Wharf mine, bought for $99.5M, has returned over $600M. The Rochester expansion, while painful, is now producing results with record crush tonnage and climbing FCF.
On the negative side, the Rochester expansion ran over budget and over time, inflicting real financial stress. CDE also diluted shareholders substantially over the years: the share count more than doubled to over 640M before the NDG deal added more.
 shares outstanding chart from 2021 to 2026 via YCharts, showing share count rising steadily from approximately 300 million in 2021 to 640 million by 2024, then jumping sharply to over 1.035 billion shares following the SilverCrest (NDG) acquisition close in early 2026 — Coeur Mining dilution history, CDE shares outstanding, SilverCrest merger share issuance, CDE shareholder dilution, precious metals miner capital structure")
The company sold assets (Northern Empire, Preciosa) during the balance sheet crisis that could have added value long-term.
The new capital allocation framework announced in March 2026 is sensible. Management has three priorities in order: invest in high-return organic growth (brownfield exploration, sustaining capital, projects like K-Zone, Silvertip, East Palmarejo), maintain a net cash balance sheet with the new $1B revolving credit facility, and return excess capital through a $750M buyback program and a small inaugural dividend ($0.02 per share semiannually).
The preference for buybacks over dividends is wise at this stage. The stock is trading well below consensus targets (analyst average of $28.75 vs. current $17), and buybacks at these levels would be accretive. The token dividend signals a commitment to returns without locking in a fixed obligation that would be painful if metals prices fell.
One area to watch: the authorization to increase shares outstanding from 900M to 1.3B. Ostensibly, this was for the NGD deal. But that kind of authorization creates optionality for future dilution. I will be watching closely whether management uses equity for future M&A.
ROIC was a peer-leading 26% in 2025. That number, more than any other, tells you that the capital allocation is working.

Financials: What the Numbers Say
The 2025 Scorecard
FY2025 revenue: $2.07B, up 96% y/y. Net income: $586M ($0.95 per share). Adjusted EBITDA: $1.03B (50% margin). FCF: $666M. Cash at year-end: $554M. Total debt: $341M. Net leverage: negative 0.2x.
These are not normal numbers for CDE. Two years earlier, the company generated $142M in EBITDA and burned $297M in FCF. The transformation is driven by three forces: higher metals prices, the Rochester expansion reaching scale, and the addition of Las Chispas. Each contributed roughly a third of the improvement.

The Balance Sheet Transformation
The balance sheet story is one of the most compelling aspects of the thesis. At Q2 2024, CDE carried $629M in debt with cash of only $74M, producing net debt of $535M at a leverage ratio of 1.7x. By December 2025, total debt had fallen while cash had exploded, resulting in a net cash position of $213 million. The leverage ratio flipped to negative 0.2x.
 quarterly cash and total debt chart from Q2 2024 to Q4 2025, showing dramatic balance sheet transformation: cash and cash equivalents (green bars) rising from $74 million in Q2 2024 to $554 million by Q4 2025, while total debt (blue bars) declined from a peak of over $629 million to $341 million over the same period, illustrating CDE’s shift from a net debt position of approximately $535 million to a net cash position of $213 million — Coeur Mining balance sheet improvement, CDE debt reduction, CDE net cash, silver miner deleveraging, Coeur Mining financial transformation 2024 2025")
The NGD deal brings additional financial capacity. NDG ended Q4 2025 with roughly $532M in cash. Combined with CDE’s cash position, that is over $1B of cash at closing. Add the new $1B revolving credit facility and total liquidity approaches $2B. The CFO noted they are working toward an investment-grade credit rating, which would further reduce borrowing costs.

Valuation: A Net Asset Value Approach
For a multi-asset miner like CDE, the right valuation framework is net asset value. Multiples-based approaches (EV/EBITDA, P/E, FCF yield) have their place for a quick screen, but they obscure what matters most: the sum-of-parts value of seven distinct mines, each with its own reserve base, cost structure, mine life, and jurisdictional tax rate. NAV forces you to value each asset on its own merits and then add them up. It also surfaces where the optionality sits.
I built a full NAV model for CDE with individual mine-level DCFs, stream deductions, resource option values, and corporate-level adjustments. The base assumption for metal prices are $5,500 gold, $100 silver and $7 copper using a 7% discount rate.
The Base-Case NAV

What the Assumptions Mean
The model projects each mine’s annual gold and silver (and copper, for New Afton) production over its reserve life, applies metal prices, deducts costs applicable to sales (CAS), sustaining and development capex, and taxes at the applicable jurisdictional rate. The after-tax FCF stream is then discounted at 7% to arrive at each mine’s NPV.
The 7% discount rate deserves explanation. For senior gold producers like Agnico Eagle or Barrick, 5-6% is standard. For mid-tiers with execution risk, 8-10% is more appropriate. I use 7% because Coeur is still in the middle of three things: integrating the NGD acquisition, ramping the Rochester expansion to full capacity, and transitioning New Afton from B-Zone to C-Zone. All three carry execution risk that justifies a premium. As these de-risk over the next 12-18 months, a 5%-6% rate becomes defensible.
The Franco-Nevada stream is modeled as 50% of Palmarejo’s gold production from the original concession at the lesser of $800/oz or spot. At today’s gold prices, Franco-Nevada effectively gets half of Palmarejo’s gold for roughly 18 cents on the dollar. This costs Coeur approximately $387 million in present value. The silver lining: over 70% of Palmarejo’s 2026 exploration budget targets the Paramount and Fresnillo concessions, which are explicitly excluded from the stream. Every ounce discovered there accrues 100% to Coeur.
The Royal Gold stream at Rainy River takes 6.5% of gold production at 25% of spot price. This is a smaller drag but still material.
Why the Base NAV Is Not the Full Story
A NAV of $19.88 per share against a stock price of $17 might look like the market is properly valuing CDE shares. It is not. The base-case NAV is deliberately conservative. It values proven and probable reserves, a conservative assumption for resources, uses an 7% discount rate, and relies on metal prices below most outlooks.
There are six levers that move the NAV closer to, and then above, the current stock price.
First, the discount rate. If CDE executes on Rochester’s ramp, integrates New Gold smoothly, and maintains its net cash balance sheet, a 6% rate is justified. That alone lifts NAV to $20.57 per share.
 NAV per share increasing from $18.09 at a 10% discount rate to $21.31 at a 5% rate, highlighting valuation upside from lower cost of capital assumptions in CDE investment thesis")
Second, the K-Zone. My base case carries this at $750M, a pure placeholder. The maiden K-Zone resource is 715,000 gold oz plus 606M pounds of copper in M&I alone, plus 86,000 gold oz and 77M pounds of copper in inferred. At current prices, the in-situ metal value exceeds $6 billion. A feasibility study kicks off in the second half of 2026, using existing New Afton infrastructure, which slashes capital intensity. The K-Zone could effectively double New Afton’s mine life. At even a conservative 15% of in-situ value, that is $900M or more. A $1B value is plausible.
Third, mine life extensions. Rochester and Wharf both have far more resources than reserves. Rochester has 353,000 gold oz plus 51.5M silver oz in M&I resources outside reserves, plus the Wilco project with 531,000 inferred gold oz nearby. Wharf has 1.19M M&I gold oz plus 1.49M inferred outside its 1.25M oz reserve. If you add three to five years of production from resource conversion, the mine-level NPVs increase materially.
Fourth, the exploration platform. Coeur is spending $160 million per year on exploration across the portfolio. Quality gold explorers typically generate two to five times value per dollar spent. At a 3x multiple with a 40% risk discount, this exploration program is worth $288M. If you believe Coeur’s recent track record (Palmarejo’s 97% increase in inferred resources y/y, K-Zone maiden resource, Rochester resource growth) justifies a 4-5x multiple, the number climbs to $320M-400M.
Fifth, the cash balance. The model uses $554 million in cash (December 31, 2025). But CDE generated $222M in operating cash flow in Q4 2025 alone. By the NGD close date (March 20, 2026), they likely added another $150M-250M in cash generation, plus whatever cash sat on NGD’s balance sheet. A $700M-$800M starting cash position for mid-2026 is more realistic, adding $0.15-$0.25 per share.
Sixth, metal price assumptions. My base case is above management’s guidance but still below most Street estimates. The sensitivity is clear. A $500 move in gold adds $1.63 per share. Silver contributes $1.83 for every $20 move. Copper matters less, with each $1/lb increase worth about $0.26 per share.
Putting It Together: Why This Is a Buy
While the base-case NAV of $19.88 is the target price, think of it more as a floor. The conservative anchor that tells you what CDE’s existing reserves are worth at a higher discount rate with “industry-average” exploration success, resource conversion, or mine-life extension (they have been more successful).

The Bear Case: Why a Rational Person Would Hesitate
The bull case writes itself at current metals prices. The bear case is harder but more important. Let me steel-man it.
Reason #1. Metals Prices Can Fall Hard and Fast
Gold dropped 20% in two months. Silver dropped even more. CDE dropped 42%. This is the reality of owning a high-beta miner. CDE’s 24-month beta is approximately 1.9. Every 10% move in gold translates to roughly a 20% move in CDE. If gold returns to $3,000 (still well above long-term averages), EBITDA roughly halves. If it returns to $2,500, several of CDE’s mines operate at or near breakeven. At $2,000, the thesis breaks entirely.
I view a return to $2,000 gold as unlikely in the near term given structural central bank demand and geopolitical risk, but I cannot rule it out. Any investor in CDE must accept this as the primary risk.
Reason #2. Integration Risk Is Real
CDE is digesting two major acquisitions in twelve months (SilverCrest and NGD). Having worked on several integrations in my corporate days, I can safely say that integration is never as smooth as management presents. Rainy River has been a historically challenging asset. New Afton is in the middle of a zone transition (B-Zone winding down, C-Zone ramping up). There will be accounting complexity (GAAP vs. IFRS treatment differences already inflated Rainy River’s reported CAS by over $1,000/oz). Cultural integration across three countries is nontrivial.
If integration stumbles, if Rainy River’s underground development falls behind, if New Afton’s C-Zone ramp disappoints, the $3 billion EBITDA target will miss. And the market will punish that miss harshly given the elevated expectations.
Reason #3. The Franco-Nevada Drag at Palmarejo
With gold above $4,000, selling half your Palmarejo gold at $800 per ounce is excruciating. This stream cost CDE an estimated $150-180 million in forgone revenue in 2025 alone. The stream covers virtually all current production for the next few years. While exploration east of the boundary is promising, there is no near-term fix. This is dead weight on an otherwise strong portfolio.
Reason #4. Mine Life Concerns
While the combined reserve base is substantial at 10 years of mine life, gold miners are always depleting their inventory. Some of their mines, notably Kensington (five years) and Las Chispas (five years), have shorter lives that require continuous exploration success to extend. If drill results disappoint, the production profile declines and the valuation multiple compresses.
Reason #5. Share Dilution History
CDE has a long history of diluting shareholders. The share count went from 400M in 2024 to 642M (pre-NGD deal), and now is over 1B. The authorization to increase to 1.3B shares creates the possibility of further dilution. The buyback helps, but at $750M, it would only retire roughly 44M shares at current prices, 4.3% of the float.
Reason #6. Tax Exposure Is Rising
Cash taxes paid in 2025 totaled $178M, with 80% going to Mexico. For 2026, cash tax guidance is $475M-600M for the combined company. US federal NOLs are down to $530M and at current profitability will be exhausted within two years. As the tax shield erodes, a larger share of operating cash flow gets siphoned to governments.
Variant Perception: What the Market May Be Missing
The consensus view on CDE seems to be: it is a high-beta precious metals play that just did a big deal at a potential metals cycle top. The recent 42% drawdown reflects that skepticism.
Here is what I think the market is underappreciating.
First, the FCF profile is self-reinforcing. Unlike the 2022-2023 period where FCF was negative because of Rochester capex, the heavy spending is done. All seven mines are now in production or late-stage ramp. Sustaining capex is predictable. Growth capex (K-Zone, Silvertip) is years away from peak spending. The FCF generation at any reasonable metals price is substantial enough to fund buybacks, debt reduction, and exploration simultaneously.
Second, the exploration pipeline is undervalued. Wharf’s mine life nearly doubled to 12 years with minimal drilling spend. Palmarejo’s eastern exploration is opening up 70,000 royalty-free acres with only 3% explored. Rochester has brownfield expansion options at Lincoln Hills (4x the reserve grade, 1km from the crusher) and Wilco. New Afton’s K-Zone could extend that mine’s life by decades.
Third, the copper exposure adds a free option. New Afton produces 50-65 million pounds of copper annually. At $5/lb, that is $250M-325M of revenue from a metal with its own structural deficit story tied to electrification and the energy transition. Most precious metals funds and ETFs do not explicitly value this copper contribution.
Fourth, the path to investment-grade credit is underappreciated. If CDE achieves IG ratings, borrowing costs fall, institutional access expands, and the stock potentially qualifies for inclusion in additional indices. The CFO explicitly flagged this as a near-term goal.
Catalysts and What to Watch
Over the next 6 to 18 months, several data points will confirm or challenge the thesis.
The Q1 2026 earnings report (expected early May) will be the first to include even partial NGD contributions. Watch for the combined guidance, integration commentary, and any surprises on Rainy River or New Afton costs. Rochester’s crushing metrics through winter will show whether the ramp is sustainable year-round. New Afton’s C-Zone throughput ramp to 15,000 tonnes/day is a key operational milestone. The K-Zone feasibility study launch in H2 2026 will provide the first detailed look at this long-term growth option.
The initial buyback activity post-Q1 earnings will signal management’s conviction. Credit rating upgrades from S&P and Moody’s are expected in the near term. And of course, gold and silver prices remain the single biggest variable.
Verdict
Coeur Mining at $17 is a Buy. The base-case NAV of $19.88 per share is my conservative target price. The risk is primarily metal prices. A sustained move below $3,500 gold would require re-evaluation. Integration risk is real but manageable given Coeur’s clean execution on SilverCrest.
The original New Gold thesis we published in June 2025 gained 85.8% before the CDE acquisition closed. The combined entity represents a more diversified, more liquid, and more powerful way to play the same structural precious metals theme. The opportunity has evolved, not ended.
Portfolio Update
As the war drags on, the S&P 500 keeps falling. Opposite to the S&P 500, our portfolio is up, widening the gap.
Portfolio Return
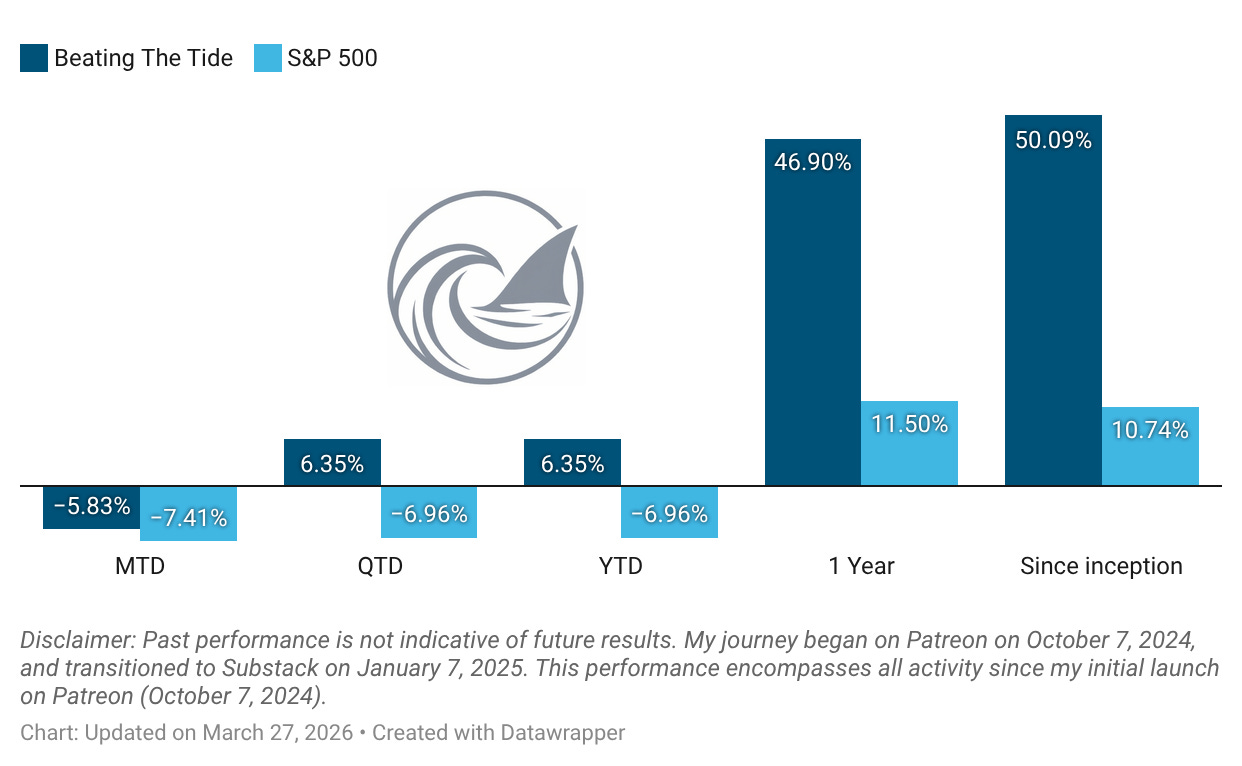
Month-to-date: -5.8% vs. the S&P 500’s -7.4%.
Year-to-date: +6.4% vs. the S&P 500’s -7.0%. That is a gap of 1,331 points.
Since inception: +50.1% vs. the S&P 500’s +10.7%. That’s 4.7x the market.
Contribution by Sector
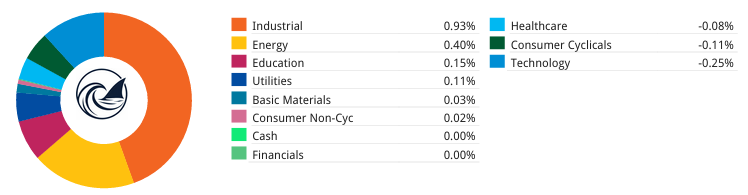
Industrials and energy led the gains, offset by tech and consumer cyclical.
Contribution by Position
(For the full breakdown plus commentary on earnings results and the big movers, see Weekly Stock Performance Tracker)
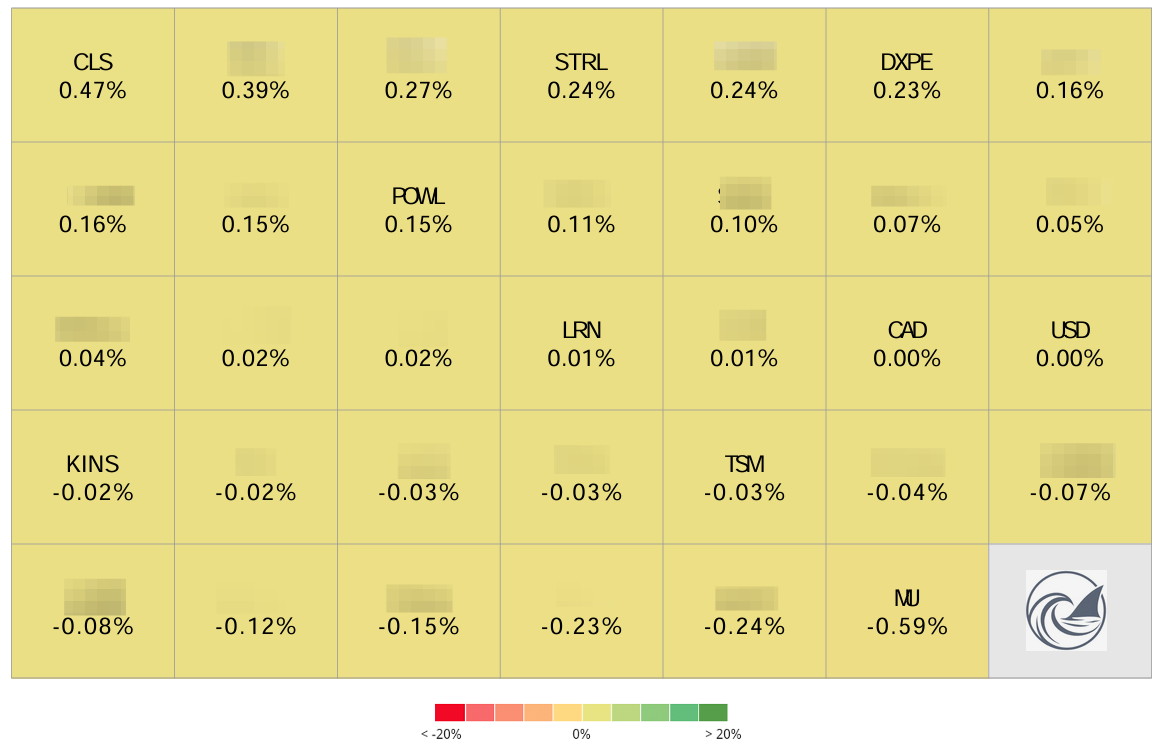
+47 bps CLS 0.00%↑ (TSX: CLS) (Thesis)
+24 bps STRL 0.00%↑ (Thesis)
+23 bps DXPE 0.00%↑ (Thesis)
+15 bps POWL 0.00%↑ (Thesis)
+1 bps LRN 0.00%↑ (Thesis)
-2 bps KINS 0.00%↑ (Thesis)
-3 bps TSM 0.00%↑ (Thesis)
That’s it for this week.
Stay calm. Stay focused. And remember to stay sharp, fellow Sharks!
Further Sunday reading to help your investment process:
Never Stop Asking Why, Using the “5 Whys” to Solve Problems and Pick Stocks
The Rise and Fall of Moats: When Walls Built to Protect Become Traps
How I Earn $3,000-$7,000 a Month While Waiting to Buy Great Stocks Cheaper
www.reuters.com/business/finance/jp-morgan-expects-gold-prices-reach-6300oz-by-end-2026-2026-02-25/
au.finance.yahoo.com/news/wells-fargo-resets-gold-price-153300506.html
Excellent writeup thank you. The NAV model is very helpful. A couple catalysts I have in my own variant view to watch:
1. S&P 500 inclusion: Explicit management goal as per Mining Forum Europe remarks. Medium term outlook as they need to stay above $22.7B market cap.
2. $B nNewCo spin later this year: This will create a market clearing price for a company with the same North America profile as $CDE, and should be a rerating catalyst.
*posted on X also
Love the detailed analysis George but I was hoping you could explain some of the numbers a little more.
Currently the market is valuing CDE at ~$17, based on their guidance of 2026 metal prices which are pretty much around where they are today.
Your model of Gold at 5500 is around 22% higher than current price. Similarly Silver at $100 in your model is ~43% higher than today, and Copper at 9% higher.
So if your model is projecting a (conservative) NAV which is 17% higher than the current market value, but relies on more significant movements in the underlying metals pricing, doesn't that suggest that it is in fact actually overpriced at todays metal prices? You mention the stock has about a 20% move for each 10% move in Gold, that would imply a much larger price increase from today (in fact if your model projects a 17% increase in stock price based on Gold being 20% higher wouldn't it just be simpler to bet on Gold?).
I know from your writing you are focused on a reasonably sized margin of safety, and 17% on the current market price doesn't seem significant enough to be a buy given the assumptions. I'd be interested to see more detail in the model on how you expect the valuation to perform under the bear case metal prices outlined, or to explain something else that I must be missing!