


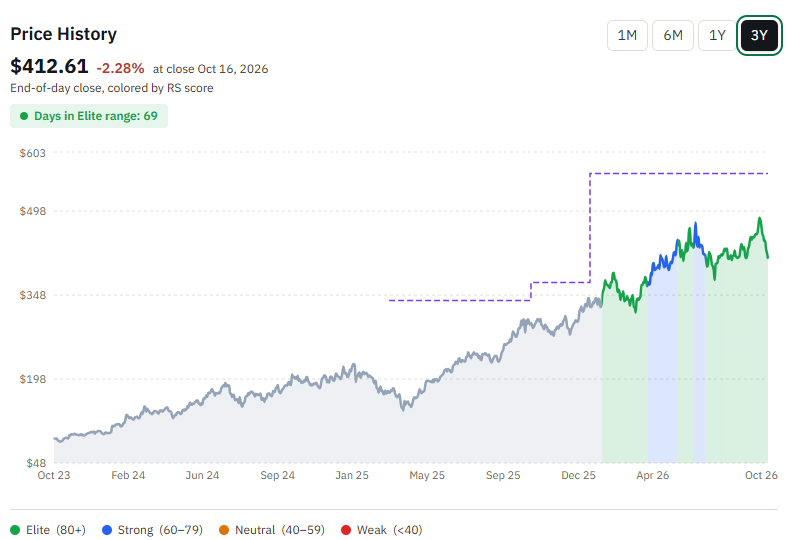
TSMC’s shares have had quite a ride in the last 3 years.
Since adding TSM to the portfolio in March 2025, it is up 149%.

Last week was ugly. The Philadelphia Semiconductor Index fell for eight sessions in a row, its longest losing streak since 2008, and TSM fell 15% from its October 5 record close to $413 on Friday. In the middle of it, on Thursday, TSM reported its third quarter.
In Weekly #104 I argued that the crack showed up in the bond market rather than in AI demand.

CoreWeave [CRWV 0.00%↑]’s bonds traded at 79 cents on the dollar, the 10-year touched 5.33% and Mr. Market started treating every funding headline as a verdict on the whole AI trade. I also promised the TSM review this week, because TSM is the cleanest test of that argument. It sits at the far end of the chain from the borrowers. Its customers are chip designers who commit to capacity years ahead, and its order book tells us what the people who actually buy the silicon are planning.
Revenue grew 41% y/y and came in $0.9B above the top of guidance. Management raised the 2026 growth outlook for the fourth time this year, to 44%, guided Q4 revenue +58% y/y at the midpoint and said 2026-2028 capex will be “significantly higher” than the prior three years. The CEO put it plainly: “We did not see any sign of slowdown.”
So here is the update: what Q3 delivered, how each of my five original thesis pillars held up, what I changed in the model, and why my target goes from $565 to $582.
Table of Contents:
TLDR
Trigger: Q3 2026 results on October 15. Revenue grew 41% y/y in dollars and 51% in NT dollars, net income grew 69% and beat consensus.
Guidance: The 2026 revenue growth guide went to 44%, from “close to 30%” in January. Q4 implies +14% q/q and +58% y/y at the midpoint.
Thesis: All five pillars hold. Pricing power is normalizing as N2 and the overseas fabs dilute margins, and the moat is getting more expensive to defend.
Valuation: Target raised to $582 from $565. At $423, the stock prices FCF growth of 19% a year for a decade vs. 29% a year in my model through 2029.
Rating: BUY maintained.
How TSM ranks
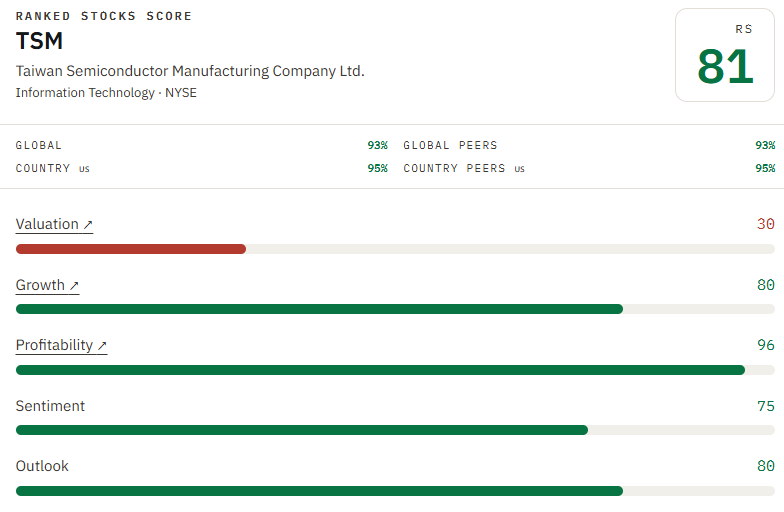
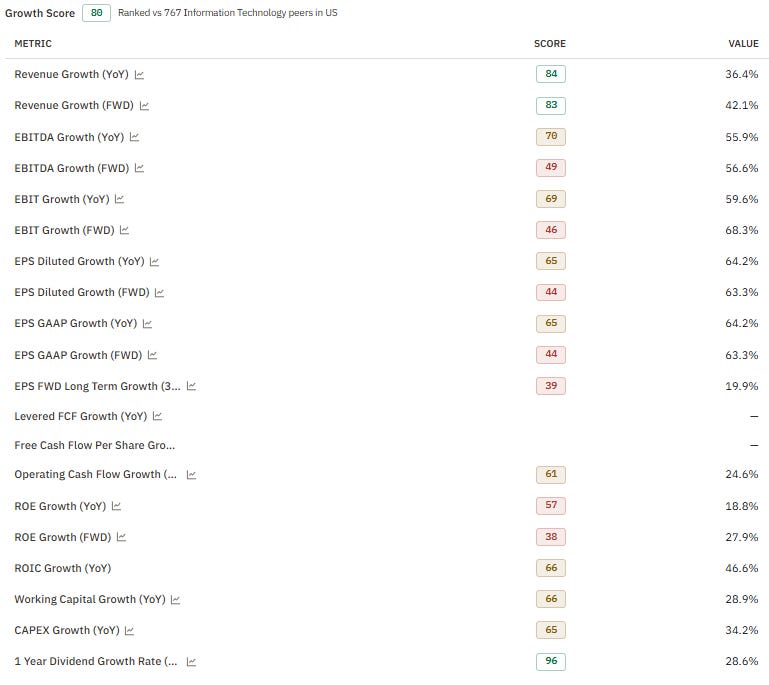
TSM scores in the Elite band, and the shape of the score is the investment case in one picture: everything is green except the price.
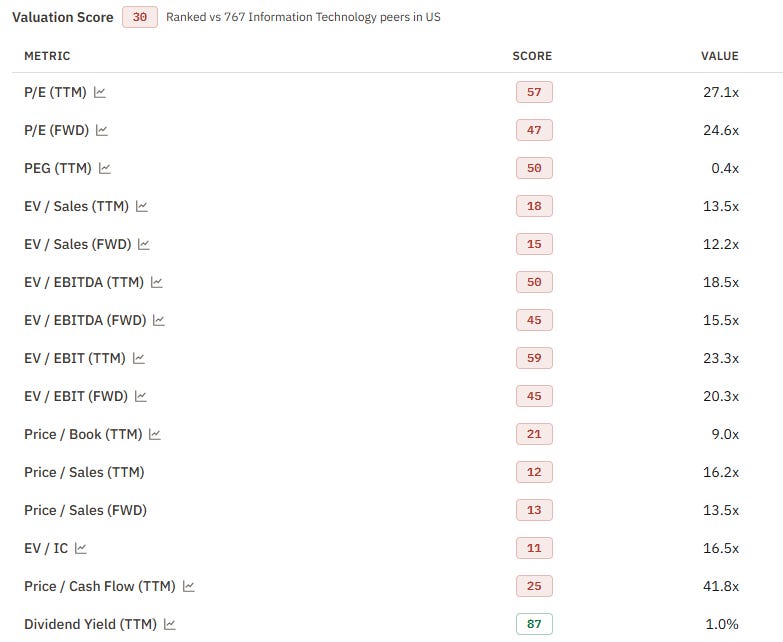
Valuation 30. The low score comes from the sales-based and asset-based multiples. EV/Sales, P/S, P/B and EV/IC all screen poorly, because a business earning a 51% net margin will always look expensive per dollar of revenue or per dollar of book. The earnings-based metrics tell a different story: PEG and forward P/E score near the middle of the peer group.
Growth 80. Revenue growth scores well on both trailing and forward numbers. The weak spots are the forward EBIT, EBITDA and EPS growth rows, which score in the 40s even though the growth rates themselves are strong. The peer group simply grows faster on those lines, because many of them are coming off a lower margin base. TSM’s margins are already near the top, so its earnings can only grow a little faster than revenue.
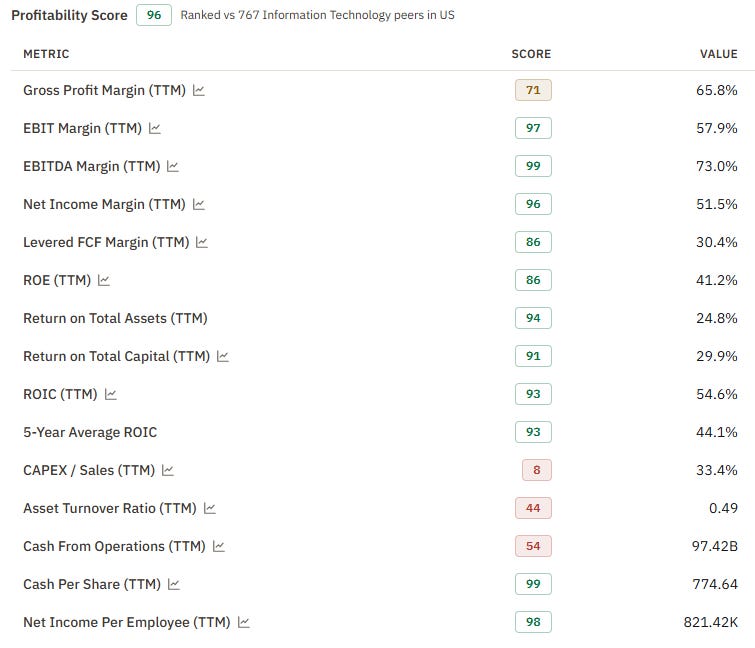
Profitability 96. This is the score that matters for a compounder. Margins, ROIC and the five-year average ROIC all score above 90. The one red line is capex to sales, which is the cost of staying ahead, and it is about to go higher.
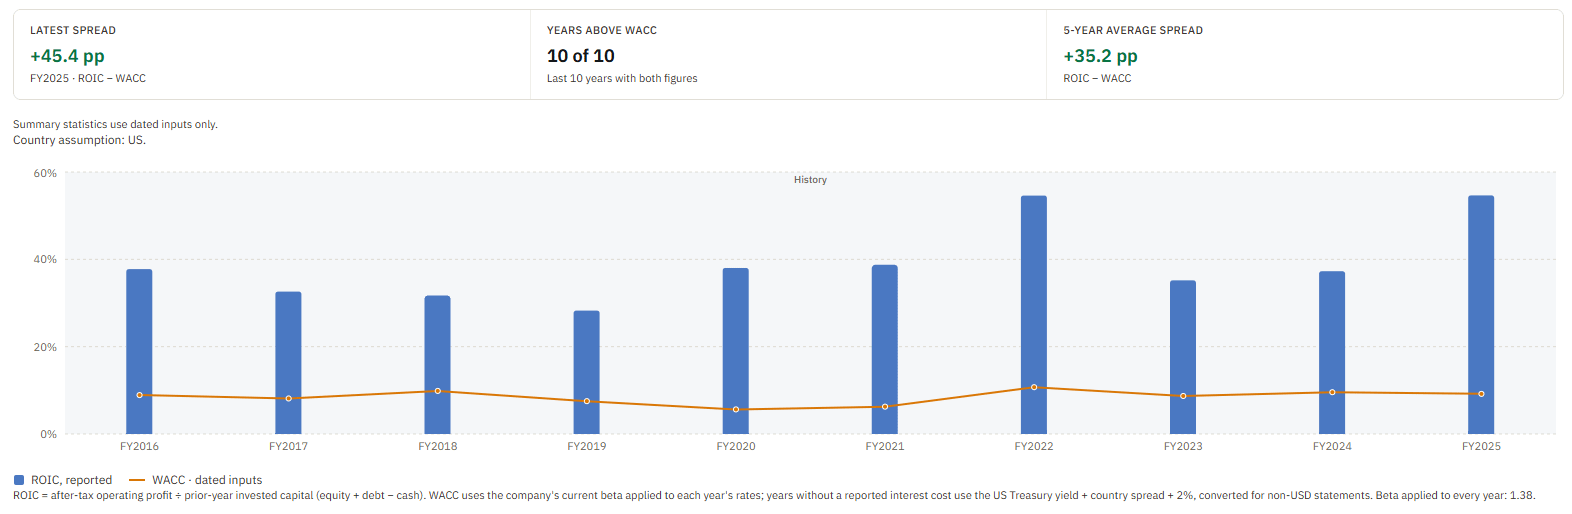
The spread between returns and the cost of capital is what keeps that capex from destroying value. TSM has earned more than its cost of capital in every one of the last ten years, and the gap was the widest of the decade in FY2025.
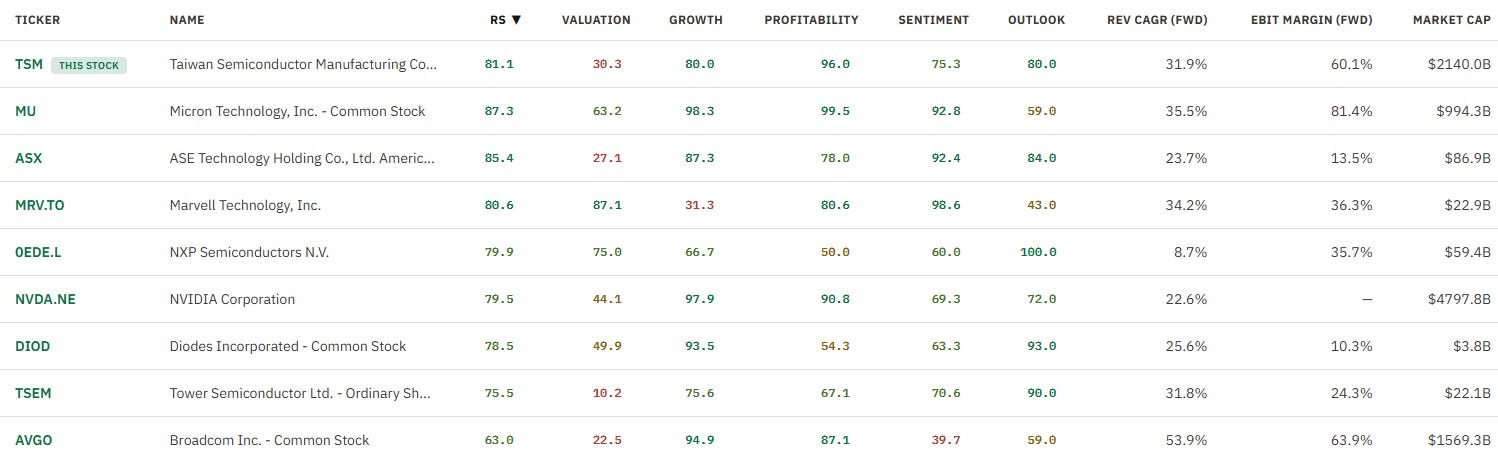
Against its closest peers, TSM has the second-best profitability score behind MU (another position in our portfolio), while most of the group scores higher on growth and only ASX, AVGO and TSEM score lower on valuation. Where TSM stands apart is the combination: the third-highest forward EBIT margin in the group, behind MU and AVGO, and a faster forward revenue CAGR than NVDA, at more than $2T of market cap.
Thesis scorecard after Q3 2026
I laid out five pillars in the original deep dive in March 2025, and graded them after every print since, most recently in Weekly #78 in April and in Weekly #91 in July.


Pillar #1. Technical monopoly at the leading edge: Confirmed
Original thesis: TSM is the only foundry that can make 3nm and below at commercial volume and yield. The gap with Intel [INTC 0.00%↑] and Samsung is structural.
Evolution: Confirmed in every update. In April, N2 was on track and A14 got a firm 2028 date.
What happened since last update: N2 went from 3% of wafer revenue in Q2 to 8% in Q3 as its steep ramp began. N2-family capacity will more than double in 2027. A14 risk production is on track for 2027 with volume in 2028, and management now expects A14 to be a bigger node than N2, with more customers engaged than N2 had at the same stage. Advanced packaging is in production at 5x reticle size, with 9x and 14x in development.
Assessment: Confirmed. The one item I’m watching is High-NA EUV, which TSM will adopt in 2030, later than Intel. TSM’s position is that it adopts tools when the cost and maturity are right, and its track record on EUV supports that. The 12-inch photomask program with ASML [ASML 0.00%↑] announced in September is how it plans to make High-NA affordable when it arrives.
Pillar #2. Structural AI demand: Confirmed and strengthening
Original thesis: AI accelerator demand compounds for years, and TSM captures most of the wafer and packaging economics.
Evolution: HPC went from 55% of revenue in Q4 2025 to 61% in Q1 and 66% in Q2.
What happened since last update: HPC grew 22% q/q to 68% of revenue. Management said demand is still “far above” its capacity, that it is sending its own teams to check US data center construction and power supply, and that the mid-to-high-50s% AI accelerator revenue CAGR for 2024-2029 “probably will be higher.” Agentic AI is adding CPU and networking demand on top of the accelerators, and that demand sits outside the narrow AI definition.
Assessment: Stronger. The only caution in the print came from the other end of the business: consumer and price-sensitive segments, where memory and component inflation is squeezing demand going into 2027.
Pillar #3. Pricing power ahead of the cost curve: Confirmed, normalizing
Original thesis: TSM re-prices new nodes at premium ASPs, absorbs overseas cost dilution and holds gross margin in a 53-58% band through the cycle.
Evolution: Gross margin went from 59.9% in 2025 to 66.2% in Q1 and 67.7% in Q2. The original band became a floor.
What happened since last update: Gross margin fell 130 bps q/q to 66.4% as N2 started to dilute, and the Q4 guide of 65-67% includes more N2 plus the overseas fabs. Overseas dilution should come in closer to 2 points this year and widen to 3-4 points in the later years as more US fabs ramp. On the other side, Nikkei reported 5-10% price increases on advanced nodes from January 2027, with 10-15% more for HPC capacity above committed volumes.
Assessment: Q2 was probably the margin peak for this cycle, and I model 64.5% for 2027. That is still more than 8 points above the 56% “through the cycle” floor management has set for itself, and the CEO’s own framing is the right one: “there is no ceiling for TSMC’s profitability, but a dramatic increase will not happen overnight either.”
Pillar #4. Moat driven by scale, capex cadence and customer lock-in: Evolving
Original thesis: TSM can outspend everyone on capex and still earn mid-20s% ROE, which keeps the competitive set narrow.
Evolution: Confirmed in every prior update, with 2026 capex moving from $52-56B to $60-64B.
What happened since last update: ROE reached 45.5% in Q3 while TSM has nearly 20 fabs in progress: 13 leading-edge and packaging fabs in Taiwan and five to six overseas. It added another N3 fab in Tainan for 2028, pulled the second Arizona fab into Q3 2027, and confirmed it is evaluating Texas and talking to Tesla [TSLA 0.00%↑] about its Terafab, with one condition: “the fab has to be run by TSMC.” It also signed GlobalFoundries [GFS 0.00%↑] to supply silicon interposers because back-end capacity is short.
Assessment: The moat is wider than it has ever been. What changed is the price of defending it. Tool inflation is “real,” in the CFO’s words, 2026-2028 capex will be “significantly higher” than the previous three years, and part of the US build is political rather than commercial. Returns are still far above the cost of capital, so this is no threat to the thesis today. It does mean the next leg of growth earns less per dollar of capex than the last one, which is why I grade this pillar Evolving.
Pillar #5. Mispricing relative to earnings power: Confirmed
Original thesis: TSM earns a software-like return on capital but trades on a cyclical semiconductor multiple.
Evolution: The target moved from $338 to $370 to $565 as each print widened the gap between the business and the price.
What happened since last update: Since the April update, revenue guidance went from “above 30%” to 44% and the stock gained 11%, less than the SOX.
Assessment: In April, the stock traded at $370 against my $565 target and I called anything below $260 a gift. Today it trades at $423 against a $582 target, with a $325 bear case.
Q3 2026 earnings: the numbers
Revenue grew 41.2% y/y in dollars and 50.9% in NT dollars, and beat the top of guidance by $0.9B. Net income grew 68.7% and beat the LSEG SmartEstimate by 2.3%, the sixth record quarter in a row.
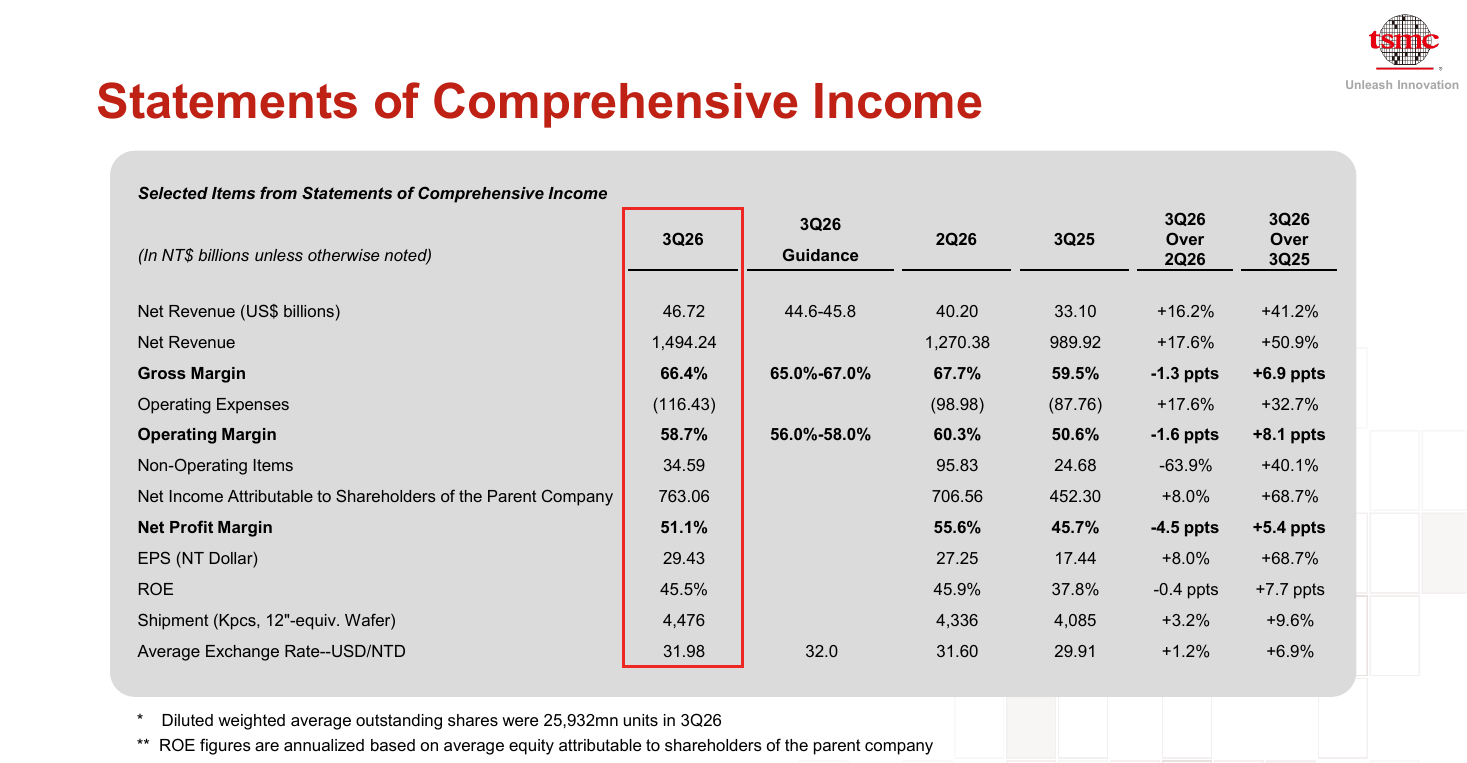
Net income grew less than revenue on the quarter, and the reason is below the operating line. Operating income grew 14% q/q, in line with the margin step-down, but non-operating items fell to NT$35B from NT$96B in Q2. The operating business is where the quarter was made, and operating margin came in 70 bps above the top of the 56-58% guide.
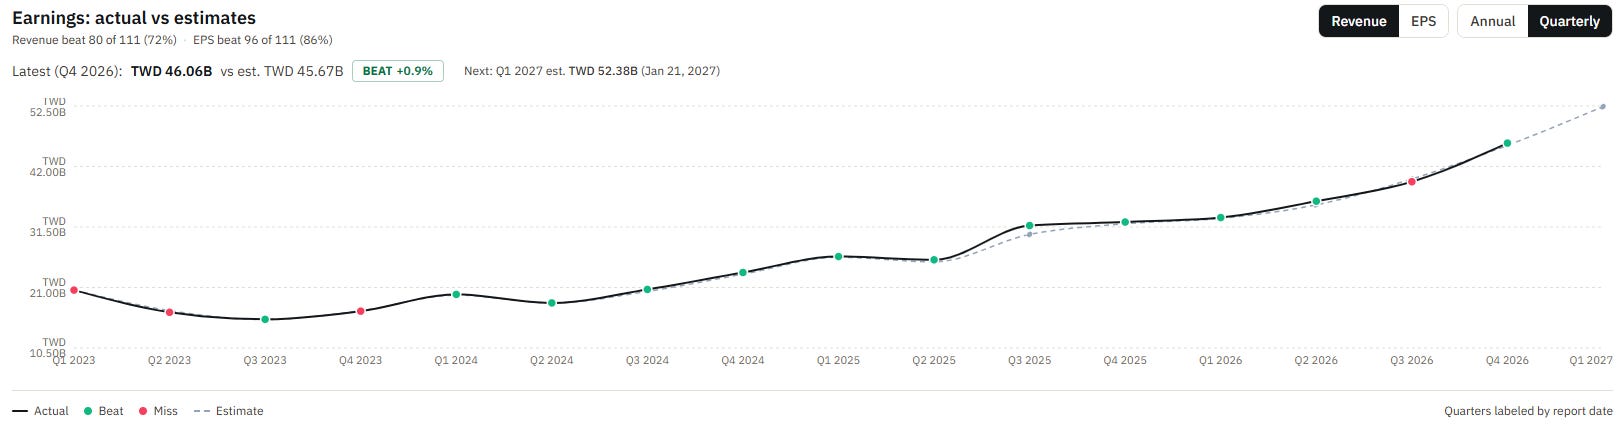
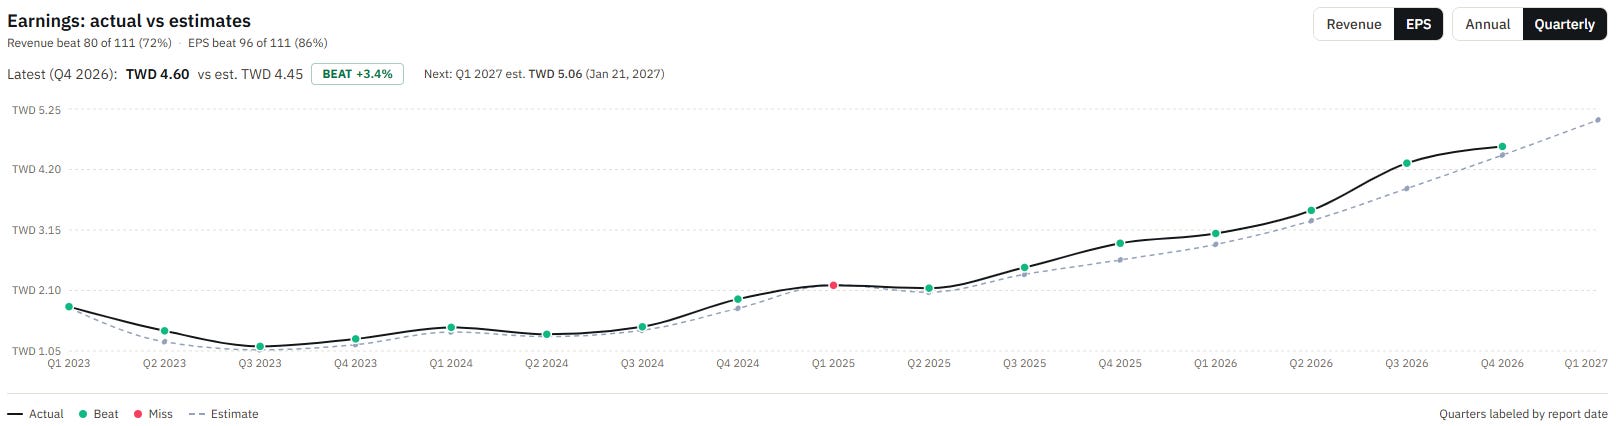
Revenue landed at or above the top of the guide for the third quarter in a row, and EPS cleared the estimate again.
N2 is ramping steeply, and it shows in the mix. N2 reached 8% of wafer revenue and N3 grew to 33%. Advanced nodes (7nm and below) are 79% of wafer revenue.
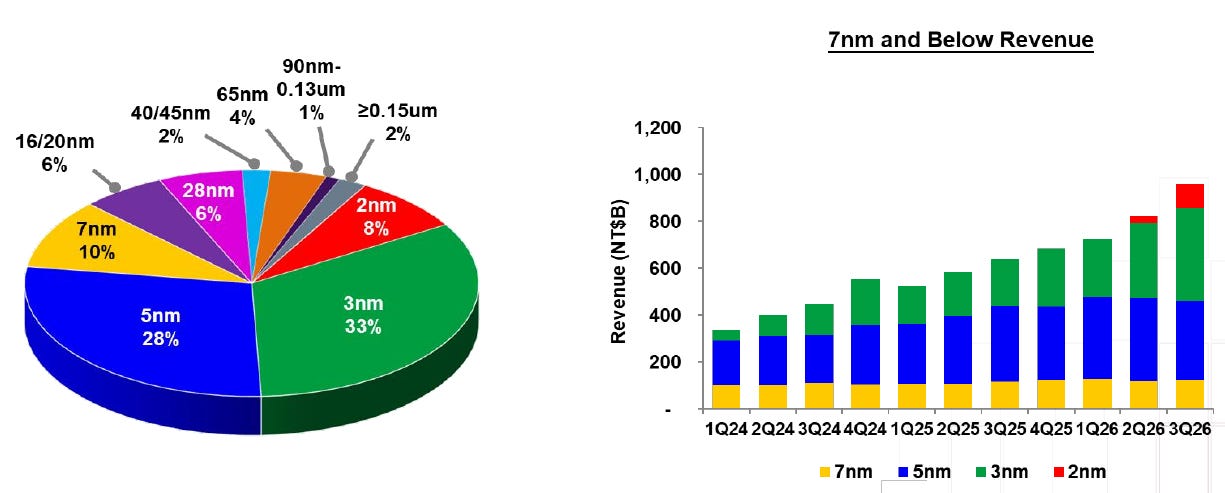
For anyone new to how a foundry’s margin works: a new node is expensive in its first year for two reasons. The tools are depreciated from day one, while volume is still ramping, so each wafer carries a large share of fixed cost. And yields start lower, so more wafers are scrapped. As volume grows and yields improve, the same depreciation is spread over many more good chips and the node becomes accretive. N3 followed that path and crossed the corporate average this year. N2 is starting it now, which is why gross margin dipped while revenue jumped.
The revenue growth is mostly mix and price, with volume a smaller part. Wafer shipments grew 9.6% y/y while revenue in dollars grew 41%, so revenue per 12-inch-equivalent wafer rose 29%. Most of that is mix, as N3, N2 and advanced packaging take a larger share of the wafers. The like-for-like price increases come in 2027.
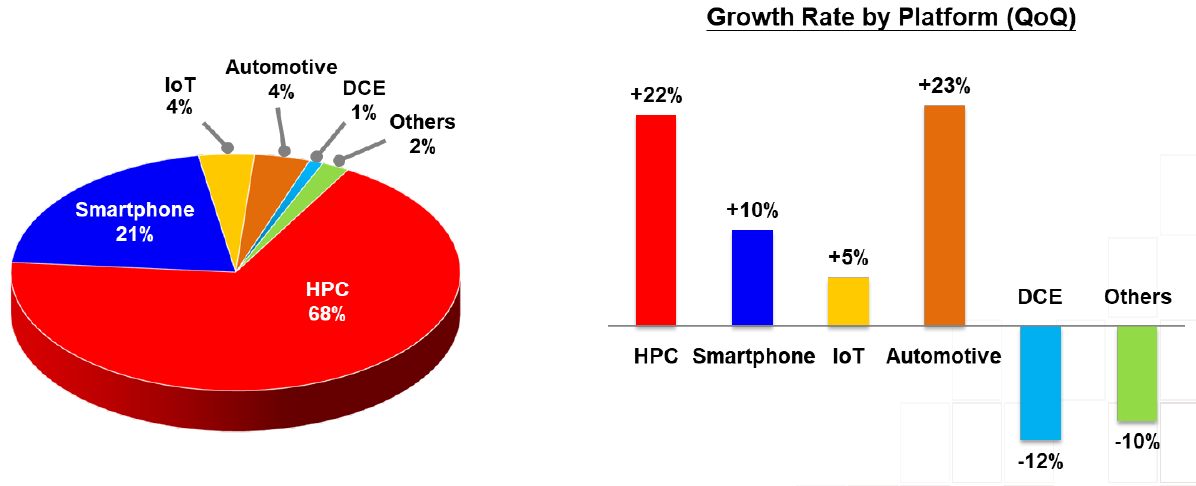
HPC carried the quarter, and smartphones held up better than the 2027 caution suggests. HPC grew 22% q/q and smartphone 10% q/q, helped by N2 launches. Management’s caution on 2027 applies to consumer and price-sensitive segments, and it was explicit that its customers are concentrated in high-end phones, where memory prices matter less.
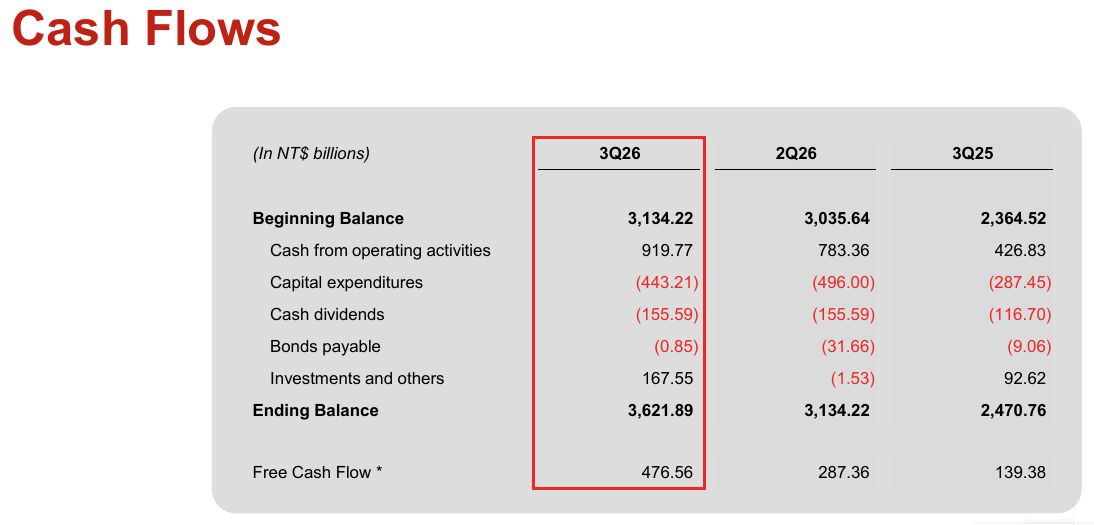
FCF more than tripled y/y. Operating cash flow was NT$920B and capex NT$443B ($13.8B), leaving FCF of NT$477B ($14.9B), vs. NT$139B a year ago and NT$287B in Q2.
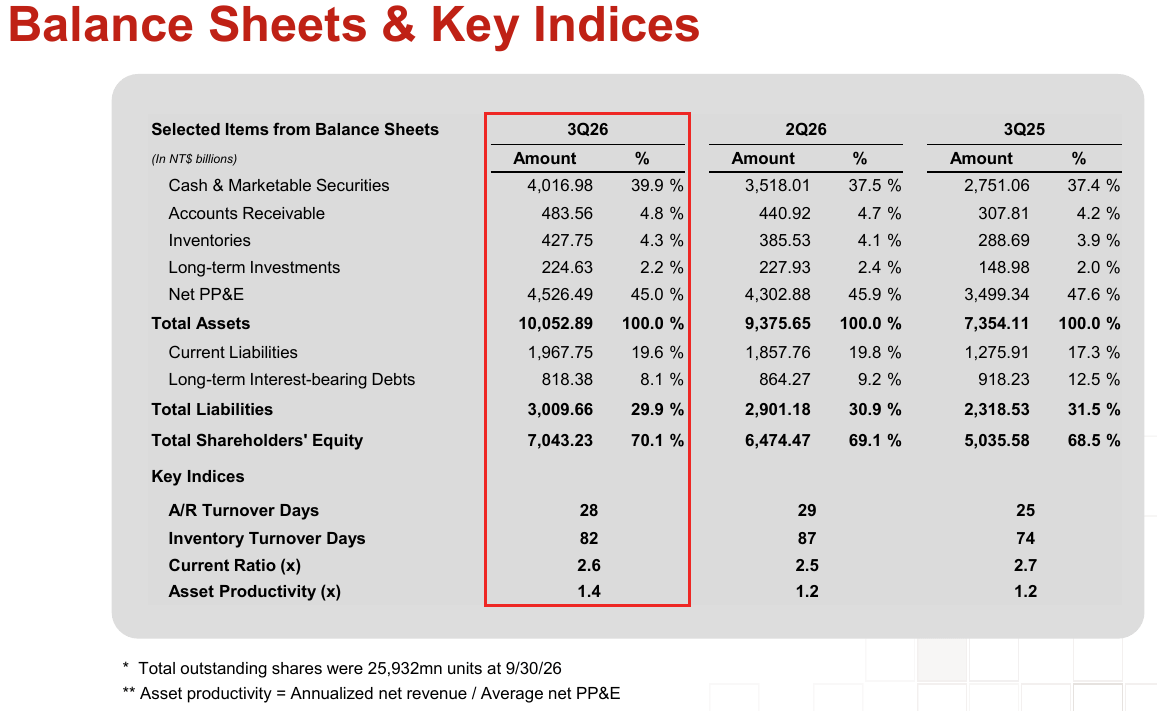
The balance sheet keeps getting stronger while the capex wave builds. Cash and marketable securities reached NT$4.0T ($126B) against NT$818B of long-term debt, so cash exceeds long-term debt by NT$3.2T. Inventory days fell to 82 from 87 as wafer shipments grew. That cash is what lets management promise a much bigger capex budget and a steadily rising dividend at the same time, after raising the quarterly dividend to NT$7.
Guidance: the fourth raise of 2026
Every quarter this year, TSM raised the full-year number, and the capex budget followed.

The Q4 guide is the strongest quarter TSM has ever guided: $52.3-54.3B of revenue, +14% q/q and +58% y/y at the midpoint, with gross margin of 65-67% and operating margin of 56.5-58.5%.
That guide puts 2026 revenue near $176B, up 44% from $122B. In January, the company was guiding to “close to 30%,” which would have meant $159B. The gap is $17B of revenue in a single year, delivered at a higher margin than anyone modeled in January.
The one soft spot is 2027 consumer demand. Management said it is “being prudent in our business planning going into 2027” because consumer and price-sensitive segments are being hit by rising component prices. Smartphones are 21% of revenue. I read it as a reason to model 2027 growth below 2026, which I already do. AI demand is a different matter: management called it “extremely robust” in the same breath.
Management credibility: this team guides low and delivers. In each of the last three quarters, revenue landed at or above the top of the guide, gross margin landed above the midpoint, and operating margin beat the top of the range.

The pattern matters for how to read the Q4 guide. Revenue has landed at or up to $0.9B above the top of the range, and margins above the midpoint. I treat the top end of the Q4 range as the base case, which would put 2026 growth closer to 45%.
What last week’s sell-off got wrong about TSM
In Weekly #104 I listed three numbers that would change my mind on the AI trade: GPU payback periods, the 10-year and AI credit spreads, and hyperscaler capex guidance. Two of the three moved against the bulls last week. Here is why TSM is the name in that chain where those moves matter least today, and where they could matter in 2028.
The financing stress sits two steps away from TSM. The neoclouds borrow to buy GPUs. Nvidia [NVDA 0.00%↑], AMD [AMD 0.00%↑] and Broadcom [AVGO 0.00%↑] sell them the chips. TSM makes the chips for all of them and gets paid regardless of which designer wins the socket or which cloud wins the customer. If a neocloud fails, its GPUs get resold or its capacity gets taken over, and NVDA has already agreed to buy CoreWeave’s unsold capacity through April 2032. The wafer demand moves to another customer of TSM.
The rate move is already in my discount rate. My model uses a 5% risk-free rate and a 5% long-term cost of debt, so the 10-year at 5.1-5.3% is already in the valuation. It matters more through the customers: higher rates raise the cost of every data center under construction.
The capex growth rate is the real 2028 question. FactSet has the five largest hyperscalers spending $691B in FY26, $892B in FY27 and $915B in FY28, growth of 82%, 29% and 3%. If that holds, AI wafer demand still grows in 2028 from a much higher base, but the growth slows. That is why my model fades revenue growth to 24% in 2028 and 20% in 2029, below the AI accelerator CAGR management keeps raising. Out-year consensus on hyperscaler capex has been too low this whole cycle, so I treat FY28 at +3% as a floor rather than a forecast.
TSM’s own planning tells us what it sees. A company that is building nearly 20 fabs, adding N3 capacity it historically would never add to a mature node, and asking GlobalFoundries for interposers is a company short of capacity. TSM sets its capex on customers’ multi-year roadmaps, which it sees two to three years in advance because of design lead times. The 2026-2028 capex step-up is the clearest read we have on what its customers have committed to.
Valuation: target raised to $582
I updated the model for the Q3 results, the Q4 guide and the 2027 outlook. These are the assumptions after the update.
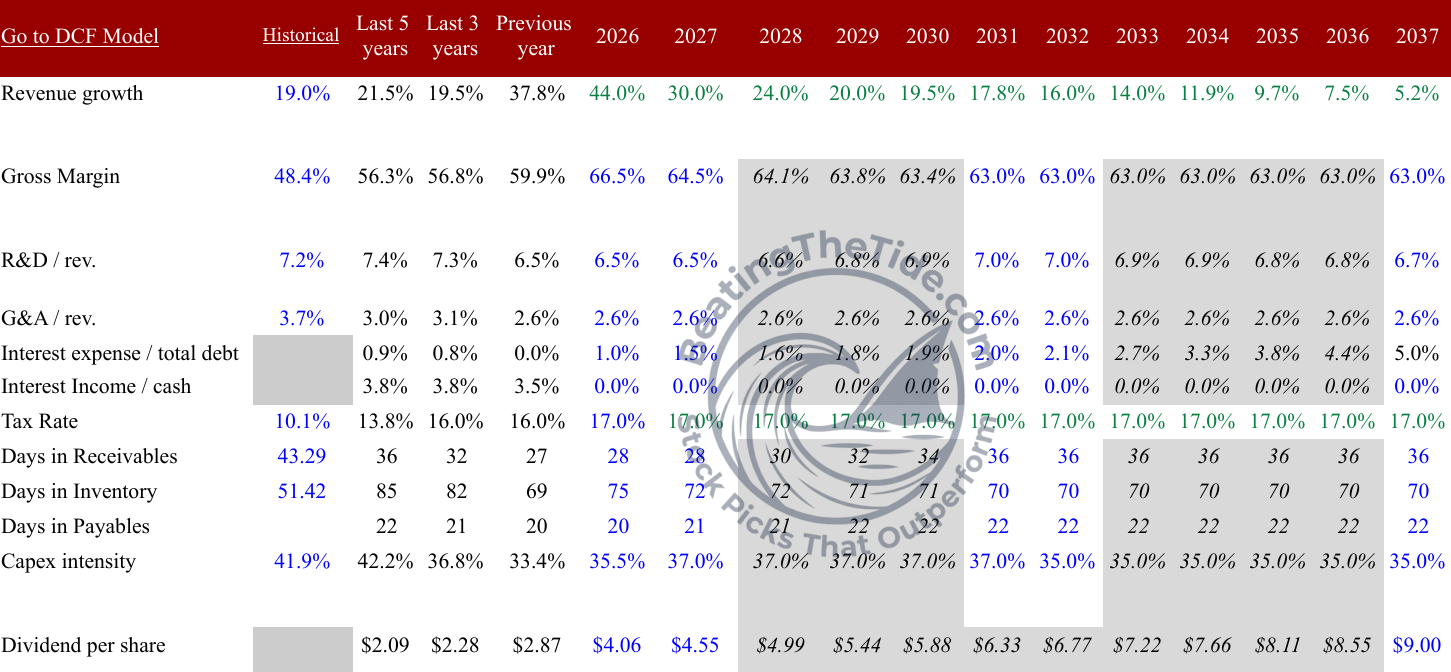
The revenue path is the assumption that moved the most, and it is now built by platform in the topline model, with HPC industry growth of 49% in 2026, 36% in 2027 and 28% in 2028. 2026 goes to 44% from 30%, in line with guidance. 2027 goes to 30%, which assumes N2 capacity more than doubles as management said it will, the 2027 price increases stick, and consumer demand stays soft. I then fade growth to 24% in 2028 and 20% in 2029 as hyperscaler capex growth slows. Gross margin goes to 66.5% for 2026, steps down to 64.5% in 2027 on N2 and the US fabs, and settles at 63% in the long term. Capex intensity goes to 37% from 2027 to reflect the heavier 2026-2028 spending, against 33% in 2025.

The discount rate goes to 9.7% from 8.1%, while terminal growth stays at 3.5%. The increase is due to the increase in the long-term cost of debt goes up to be more inline with the 10-year US government bonds. And the target debt weight falls to 35%, because TSM runs a net cash balance sheet and has no reason to borrow. Cash, investments and debt now come from the September balance sheet.
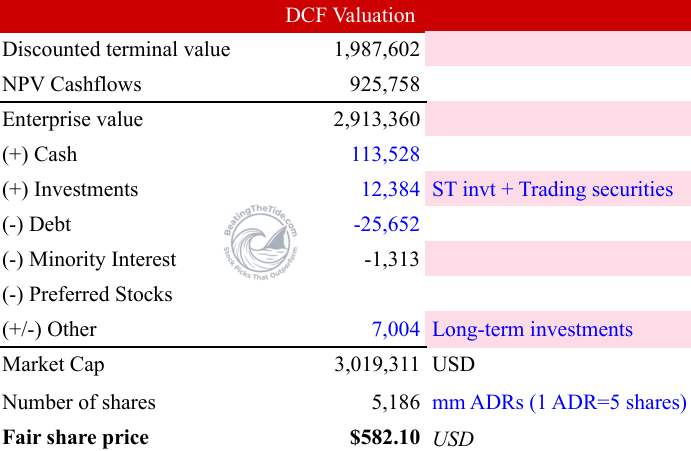
What the price implies. At $423, TSM’s market value is $2.2T. Discounting at the same 9.7%, that price is consistent with FCF growing 19% a year for ten years from the $32B of 2025, and 3.5% after that. Put the other way, the price implies a 10% annual return on my cash flows. My model has FCF reaching $88B in 2029, a 29% annual growth rate, and FCF already reached $15B in Q3 alone. Mr. Market is pricing growth a third slower than mine for the next decade.
What $582 requires. The target is 29x my 2027 EPS of $20.06 per ADR and 20x my 2029 EPS of $29.33. It asks for revenue growth above 20% through 2029 and gross margin above 63%, the path that management’s guidance and capex plans point to. If AI wafer demand flattens in 2028 instead, the target is too high. At $423, the stock trades at 21x my 2027 EPS and 14x 2029.
The bear case is $325. Hyperscaler capex stops growing in 2028, TSM’s revenue growth slows to 15% in 2027, gross margin falls back to 60% as N2 and the US fabs dilute without full price increases to offset them, and the stock re-rates to 17x $19 of EPS. That is 23% below today’s price, against 38% upside to the target, a risk/reward of 1 to 1.6.
Risk register
Materialized: none. Overseas dilution and N2 dilution are showing up in the margins, but within guidance and as planned. Neither changes the thesis.
Faded:
N3 margin drag. N3 crossed the corporate average gross margin this year, as management said it would in January.
Middle East chemicals and gases, the new risk I flagged in April. It didn’t come up in the quarter or the call.
N2 yield risk. N2 went from 3% to 8% of wafer revenue in one quarter with gross margin still at 66.4%. A node with a yield problem doesn’t ramp like that.
Unchanged:
Taiwan. Still the largest risk, and still impossible to model (I add a 150 bps premium to the discount rate to account for this). The overseas fabs reduce it slowly, at the cost of the margin dilution above.
Customer concentration. HPC is 68% of revenue and a handful of designers drive it. A single hyperscaler pausing would show up within two quarters.
Currency. The NT dollar weakened to 32 from 30 a year ago, which flattered NT dollar growth. A reversal would cut reported NT dollar margins.
New:
AI financing. The weakest buyers of AI compute are borrowing at 15% and their credit insurance prices a 63% chance of default over five years. TSM’s customers are not the borrowers, but if the neoclouds stop buying, its customers will order less. What would make it real: hyperscaler capex guidance cuts in the January prints.
Capex growth deceleration in 2028. If FactSet’s +3% for FY28 turns out to be right, my 24% growth for 2028 is too high.
The price of the moat. Tool inflation, US fabs at a 3-4 point margin dilution and political projects like Texas or Terafab lower the return on each new dollar of capex. TSM still earns a 45% ROE. The question is where incremental returns settle once 2026-2028 capex lands.
Intel is back on the watch list. I moved Intel to the faded column in April after 18A stumbled. Since then, INTC has gained 31%, management was asked directly about an IDM customer insourcing more capacity, and Intel will use High-NA before TSM. TSM’s answer is that A14 is attracting more customers than N2. I want to see A14 customer counts hold through 2027.
Performance vs. peers
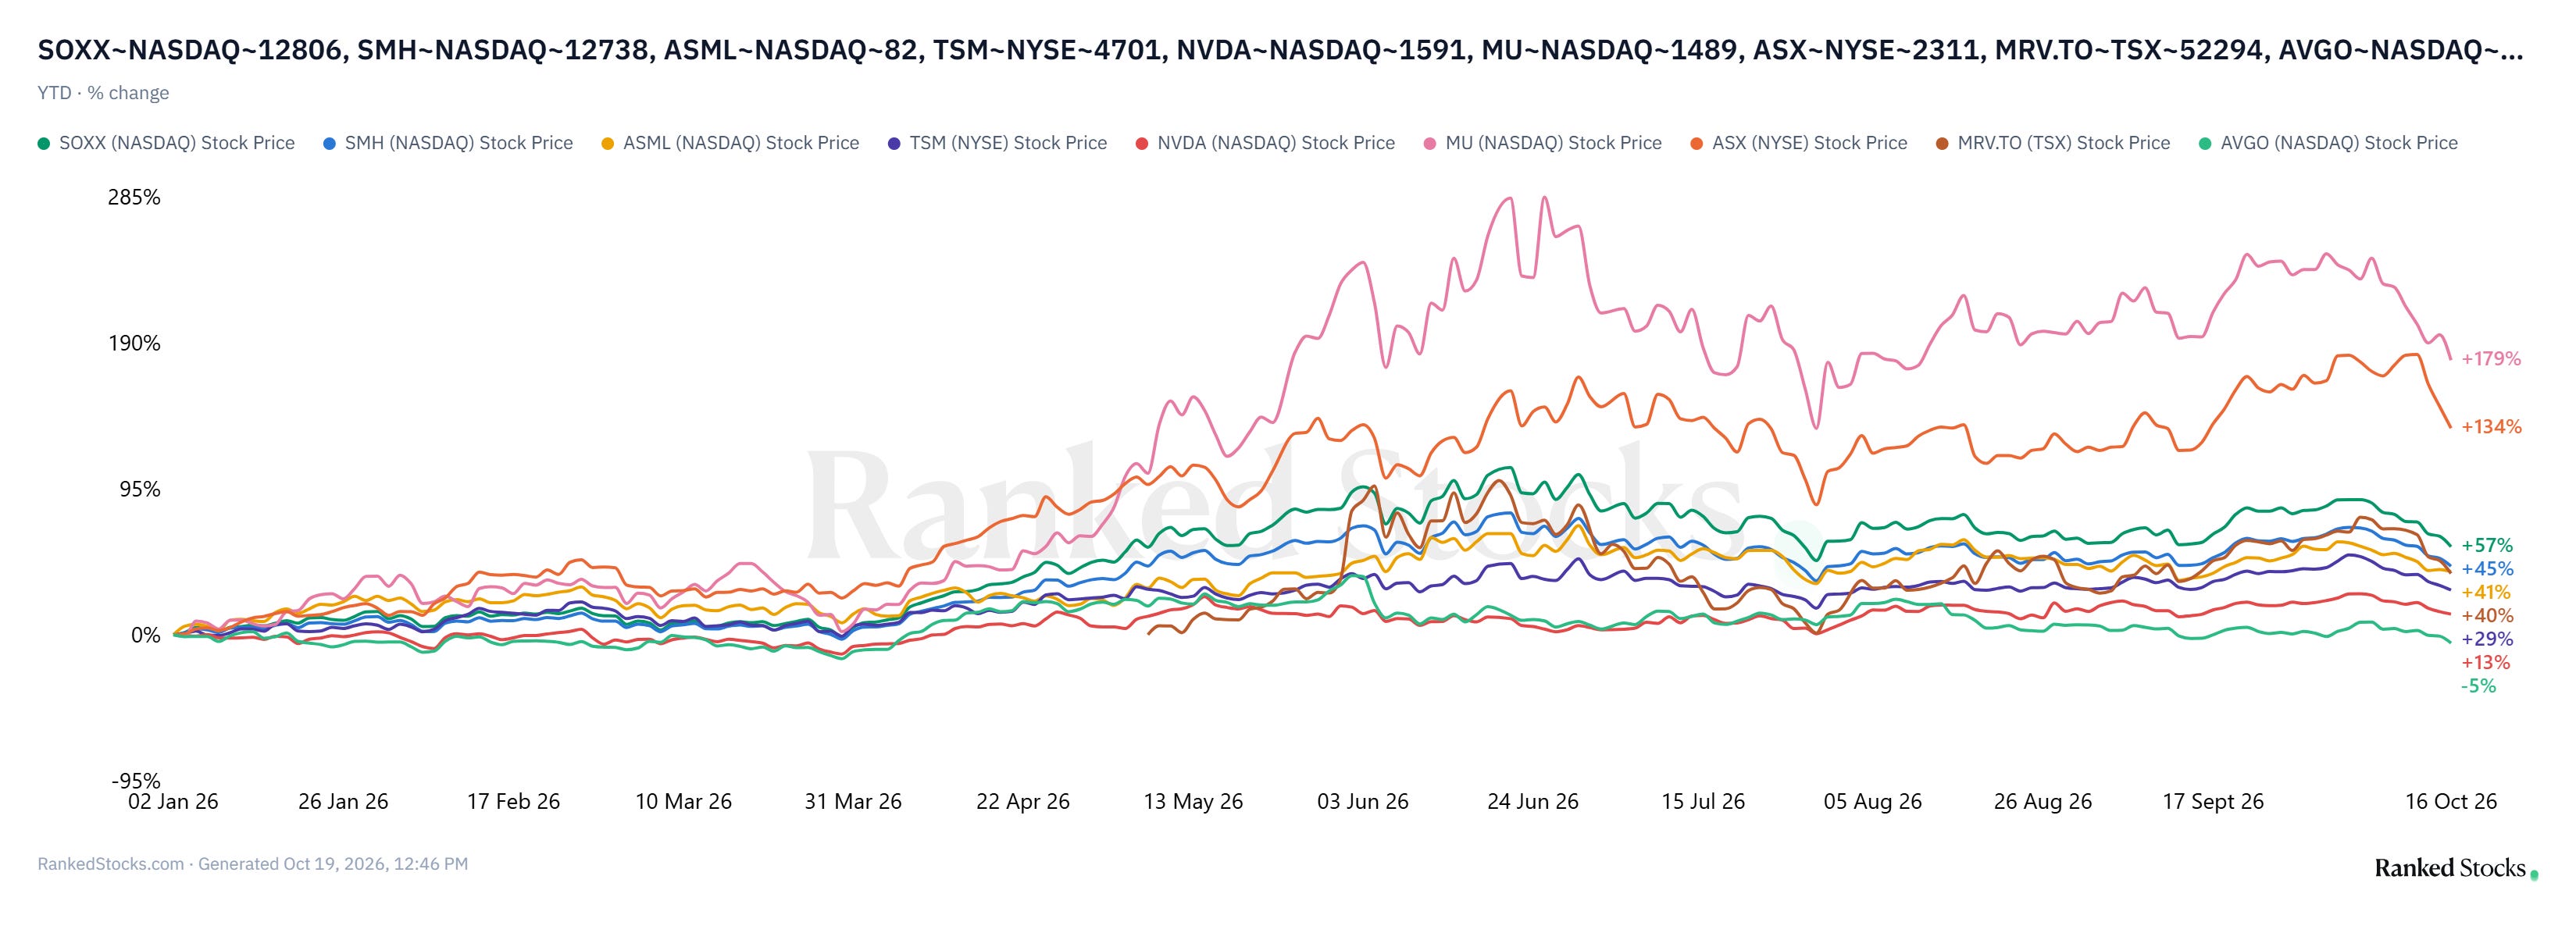
Year to date, TSM trails the SOXX and SMH semiconductor ETFs, ASML and Marvell [MRVL 0.00%↑], and sits far behind MU and ASX, the memory and packaging names that rode the AI capacity shortage hardest. It is ahead of NVDA and AVGO. That is the pecking order of the AI trade this year: the bottlenecks around the chip re-rated first, and the biggest bottleneck of all re-rated least. In last week’s sell-off TSM fell in line with the group, so Mr. Market didn’t separate the foundry from the most financing-exposed names. That is the gap I want to own: TSM grew Q3 earnings 69% y/y, faster than all but two of these share prices moved this year.
Verdict
TSM stays a BUY, and I’m raising my target to $582 from $565.
The position stays unchanged. The sell-off didn’t change its role in the portfolio: TSM is the AI holding with the least financing risk and the most pricing power.
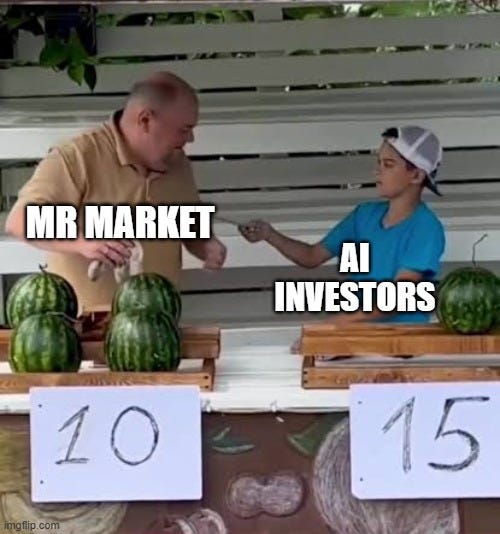
Last week Mr. Market sold every chip stock the same way, the lender-dependent ones and the one that every chip designer depends on. TSM answered with a fourth guidance raise in nine months and a plan to spend more in the next three years than in the last three. A company doesn’t commit that kind of capital to a cycle it expects to end.
If you are still curious how the boy outsmarts competition, here it is…