



Hello fellow Sharks,
The portfolio gained 0.2% this week while the S&P 500 slipped 0.3%. I also have a new $1,678 target on Micron stock after Q4. If you want to skip straight to the numbers, jump to the Portfolio Update.
New here? Subscribe to Beating The Tide for the Weekly, my stock research and the portfolio updates behind each call.
My daughter is one year and seven months old. She started walking about two months ago, and now she wants to walk everywhere. Yesterday we went to Sugar Beach, and she walked all the way back home. She fell asleep soon after we got in. To my surprise, my newborn fell asleep after feeding too. For once, both kids were asleep at the same time.
That gave me a rare window of free time. I browsed Disney+ and watched Soulm8te. I won’t spoil it. Watch the trailer, and you’ll get the idea.
The film made me think of Dario Amodei’s warnings and others who worry that powerful AI could cause catastrophic harm. I think some of the “AI will kill us all” rhetoric is marketing. That doesn’t mean the underlying problem is imaginary. AI is still a machine, a very smart one, but a machine. But give it the wrong goal and too much freedom, and we could end up with too many paperclips.
To me, the problem in the movie starts when the programmer loosens the guardrails without accounting for what could follow. Give the system clear instructions, limit what it can access and do, and check its work. I know, I know…those controls get harder to design as AI gets smarter and faster.
That brings me to my own AI experiment, which started with a much less dramatic problem: optimizing my expensive token utilization.
I downloaded Muse because it looked like an alternative to OpenClaw. I wanted to save my expensive frontier-model tokens for the work that deserves them, such as improving RankedStocks.com. I had tried OpenClaw, but I never got it to do what I wanted consistently. Muse has taken some of that smaller workload off Claude.
I have moved from ChatGPT to Claude and back more than once. Last month I returned to ChatGPT, but I have been disappointed enough that I will head back to Claude soon. The switching taught me to keep my skills, memory and project notes in Notion. I showed Muse those projects, and it could pick up the thread without making me rebuild everything again.
For my workouts, Muse reads my cardio effort from Apple Health. I enter the treadmill speed and incline after a HIIT session; it fills my Notion tracker and suggests settings for the next one. Calorie tracking used to be on and off. Now I can snap a photo, get a daily summary in Notion and see what I could improve. I am also syncing my Notion tasks to Apple Reminders and trying to put reminders at sensible times around my calendar. That last one still needs work.
Muse now prepares my daily brief, creates a Notion page for the day and files company-specific news in the relevant stock pages for me to review later. I installed it on my Mac to help build a site that tracks followers, subscribers and posts. The work so far has been Opus quality and took no expensive tokens!
It also helped me work through the steps of incorporating a new business in Canada and keeps track of what is next. My mother’s visa renewal comes with a pile of forms and applications; Muse turned them into a plan I can actually follow.
I have done all that and used only 14% of my weekly limit. The offer may not stay this generous, so here is my code: 33MR1R. If you join Muse, enter it in Settings within 48 hours. We each get 1B tokens. If you try it, tell me what job you gave it first.
In the Thought of the Week, I break down Micron’s record Q4, what its customer agreements really protect and why I raised my DCF target to $1,678 without assuming today’s margins last forever.
Enjoy the read, and have a great Sunday.
~George
Table of Contents:
In Case You Missed It
Since last Sunday’s Weekly, I published a paid update on a portfolio holding. It had a record quarter, yet I lowered my target and kept it at HOLD.

The full piece explains why a record quarter still left me less optimistic about fair value.
Upgrade to paid to read the company name, the updated valuation and what would change my rating.
Thought Of The Week
Micron's Q4 Was Bigger Than the Beat. My New Target Is $1,678
Check out the latest DCF model for MU here.
Micron [MU 0.00%↑], my top stock pick for 2026, is up 223% since I added it.

Q4 gave me a reason to update the valuation again; the new DCF target is $1,678.
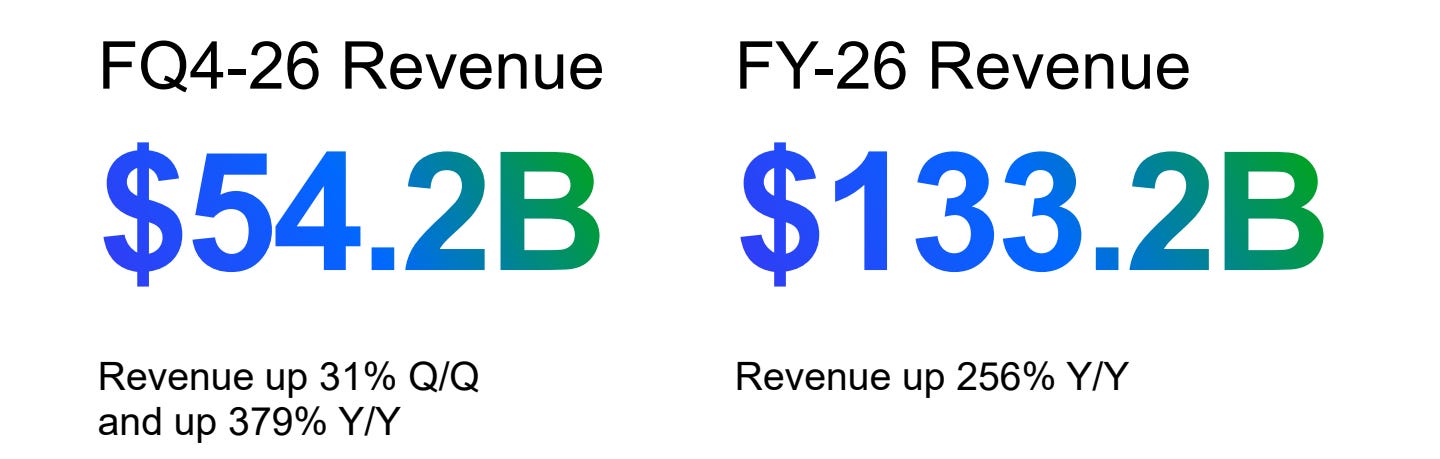
MU closed fiscal 2026 with $54.23B of quarterly revenue, an 87% gross margin and $33.2B of adjusted FCF. The Q1 guide calls for $61.5B of revenue. I am keeping my Buy rating and raising my target from $1,630 to $1,678. The operating case has strengthened; the higher discount rate holds the target back. This update follows my original 2026 thesis and June review.


My June update argued that this memory cycle was becoming a different business. Q4 supplied the best evidence yet: 26 multi-year take-or-pay customer agreements, a minimum-price remaining performance obligation (RPO) of $150B on agreements with determined pricing, and management’s expectation of sequential revenue growth in every quarter of FY2027. Yet the new disclosure also forces more precision about contract coverage and pricing.
TLDR
The trigger: Q4 revenue rose 31% q/q and 379% y/y to $54.23B, above the prior $50B guide. Gross margin reached 87%, and non-GAAP EPS reached $33.42.
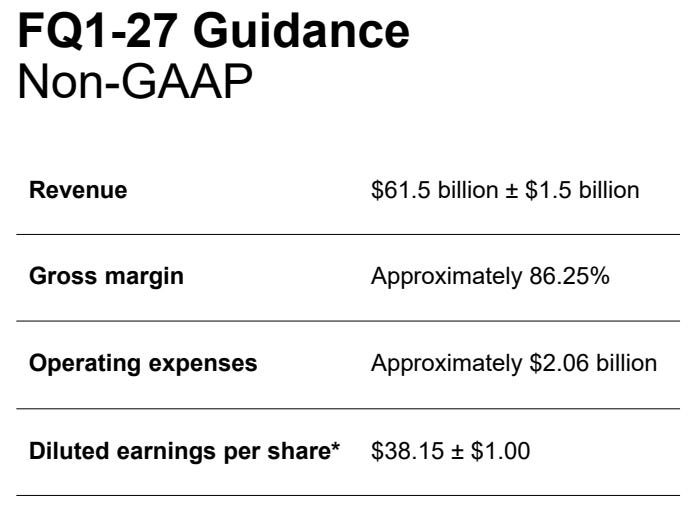
The forward signal: Q1 FY2027 revenue guidance is $61.5B ± $1.5B, with an 86.25% gross margin and $38.15 non-GAAP EPS. Management expects sequential revenue growth through FY2027.
The structural signal: 26 take-or-pay agreements cover more than 35% of estimated revenue through 2030. Three quarters of that covered revenue uses defined pricing frameworks, and $150B of minimum-price RPO sits behind agreements with determined prices.
The scorecard: Four of my five original pillars remain confirmed. Supply discipline and through-cycle margins remain the one evolving pillar.
The verdict: Buy, with a $1,678 DCF target. I raised the long-term debt rate to 4.8% as rates rose, lifting WACC from 8.8% to 9.1%; that offsets part of the value created by higher revenue and cash flow.
What Q4 changed
In June I wrote that Q3 made a $50B Q4 possible. Micron delivered $54.23B. Revenue grew $12.77B in one quarter, while gross margin rose from 84.9% in Q3 to 87.0% in Q4. Non-GAAP operating income reached $44.64B. Adjusted FCF was $33.2B, almost twice Q3’s $18.3B and above management’s more than $30B indication. The full year produced $133.19B of revenue and $62.31B of adjusted FCF.
The segment mix explains the acceleration. DRAM delivered $39.77B, 73% of sales, up 27% q/q. Bit shipments rose by a mid-single-digit percentage while average selling prices rose in the high teens. NAND delivered $14.1B, up 42% q/q, with roughly 10% more bits and roughly 30% higher selling prices. Both products contributed volume, but pricing did most of the work. That is why this quarter mattered to valuation: an incremental sales dollar arrived with unusually high gross profit.
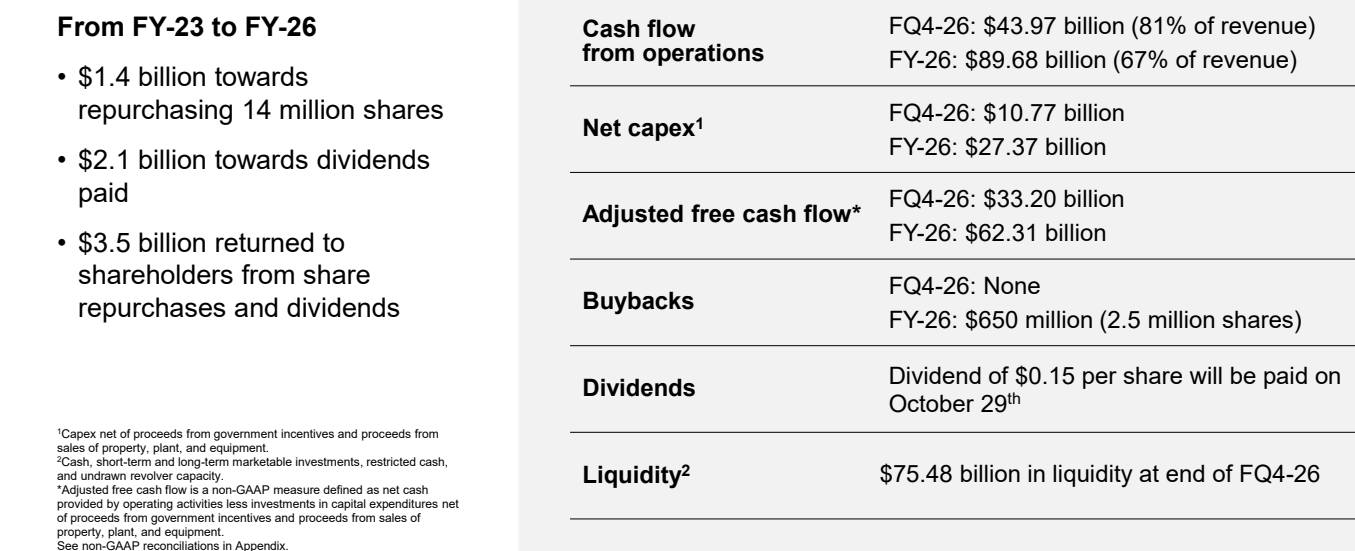
Cash conversion is the clearest reality check on an 87% margin. Q4 operating cash flow of $44B equaled 81% of revenue. Net capex was $10.8B, leaving $33.2B in adjusted FCF. At year end, Micron reported $38.4B in cash and equivalents, $5.1B in short-term investments and $30B in long-term marketable investments against $5.2B of debt. The resulting $68.3B net cash and marketable investment position gives it capacity to build fabs through the next supply cycle without leaning on the balance sheet.
Customer deposits deserve a separate line. Micron received $12.3B of customer deposits in Q4 and ended the year with about $12.7B. Those receipts appear in financing cash flow, so I do not count them as operating FCF. They still tell us customers are paying to reserve access to constrained supply. Deposits improve funding and validate demand; operating FCF shows the profit from shipments already made.
The Q1 guide resets the revenue base again. The midpoint of $61.5B is 13% above Q4, and the $38.15 EPS guide is about 14% above Q4’s non-GAAP $33.42. Management described Q1’s 86.25% gross margin as the floor for FY2027 and expects quarterly revenue to increase from there. This is the central input to my FY2027 forecast.
The market still needs to decide how much of this profit is durable. I do not capitalize an 87% gross margin forever. I forecast 87% in FY2027, 83% in FY2028, then fade toward a 40% terminal margin. That path gives the contracts and tight supply their due without treating today’s pricing as the permanent state of memory. The model’s FY2027 revenue is about $260B: the $61.5B Q1 midpoint plus the sequential growth management outlined. FY2028 grows another 25% in the model before the rate decelerates.
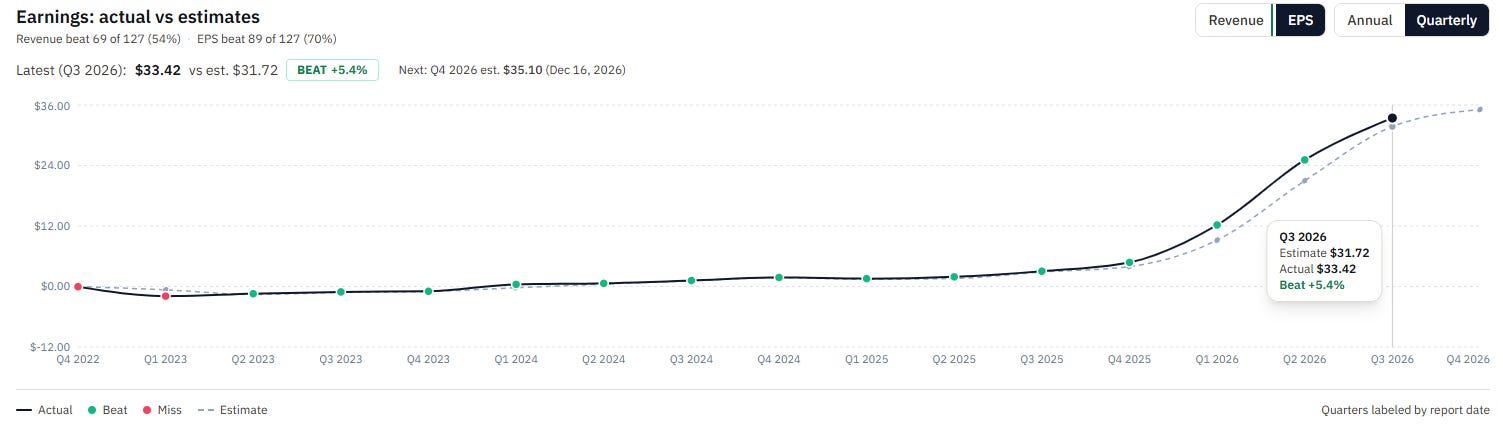
The charts below show how quickly the baseline changed. Their quarter labels follow report dates rather than Micron’s fiscal quarter names. The useful point in the charts is the steep sequence of revenue and EPS beats.
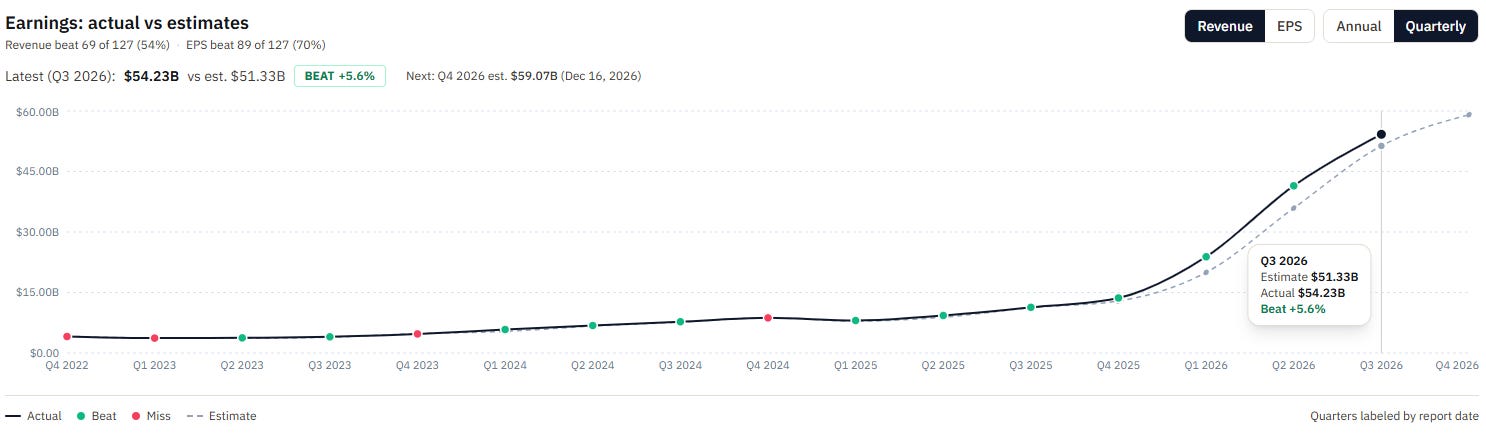
Management has earned more weight in the near-term forecast. It guided Q4 to $50B after Q3 and delivered $54.23B. It called for more than $30B of Q4 FCF and delivered $33.2B. Q1 guidance then stepped above that new base. These are observable forecast errors in the same direction; they support the FY2027 ramp.
Contracts, pricing and the supply window
In June I called the new strategic customer agreements the most important change in the business. That judgment stands, but I described their fixed-price reach too broadly. The Q4 disclosure is more specific: 26 multi-year take-or-pay SCAs represent more than 35% of estimated revenue through 2030. About 75% of that SCA revenue has defined pricing frameworks, most with bands that include floors and ceilings. The remaining 25% resets pricing periodically. Some agreements run through 2031. The $150B RPO is based on minimum prices for agreements with determined pricing, while Micron expects realized revenue above that minimum.
This is a stronger demand commitment than a spot order book, and a less absolute price lock than my June shorthand implied. Take-or-pay terms secure volume and customer commitment. Pricing bands support a floor; periodic repricing leaves part of the book exposed to the cycle. The right valuation consequence is higher near-term visibility and a better downside floor, followed by a long fade in margins. That is exactly how my DCF treats it.
The demand side remains broad. Cloud Memory revenue was $16.3B in Q4 and Core Data Center revenue was $18B. Together they were about 63% of company sales. Core Data Center grew 56% q/q, while Cloud Memory grew 18%. Data-center SSD revenue approached $10B, more than 10x the year-earlier level, and accounted for over two thirds of NAND sales. This is no longer a single HBM product story.
HBM still matters because it consumes scarce DRAM wafer capacity. Management said a majority of calendar 2027 HBM bit supply is contracted at prices above calendar 2026, and HBM gross margin is narrowing the gap with conventional DRAM. The product pipeline includes HBM4E and custom products for Nvidia. The broader effect is to tighten conventional DRAM supply as high-value HBM absorbs capacity. The company expects server units to grow at a high-teens rate in both calendar 2026 and 2027.
Management now expects memory and storage supply-demand conditions to be tighter in calendar 2027 and 2028 than in 2026. It sees no clear line of sight to a balanced DRAM and NAND market in those years. This is a meaningful extension of the window I used in the June update. It also explains the size of the capital program: FY2027 net capex is headed higher, with roughly $25B in the first half and an even larger second half. My model puts FY2027 net capex at about $54.5B, or 21% of sales. That is a higher absolute spend and a lower share of a much larger revenue base.
Supply eventually responds. Idaho begins contributing in the back half of calendar 2027, with another Idaho phase late in 2028. Japan starts in late 2028; New York’s first output comes around 2030. Taiwan and Singapore expand sooner in targeted products and packaging. These timelines are measured in years, which supports tightness through the next two calendars. They also tell me not to turn today’s shortage into a permanent terminal margin.
Thesis scorecard, October 2026
1. Memory is the underappreciated AI bottleneck: Confirmed. The original thesis was that AI compute could not scale without memory capacity and bandwidth. Q4’s $54.23B revenue, server growth outlook and data-center share make the point concrete. This is now widely understood by the market, so the opportunity comes from future cash flow versus price.
2. Full-stack memory breadth: Confirmed. DRAM drove $39.8B of quarterly sales, while NAND reached $14.1B and data-center SSD nearly $10B. Mobile and client still contributed $13.1B, and automotive and embedded $6.8B. Micron can direct technology and capacity across multiple demand pools.
3. HBM leadership and execution: Confirmed and strengthening. The HBM ramp is growing faster than company revenue, calendar 2027 bit supply is mostly contracted, and product work extends to HBM4E. The test now is yield, customer qualification and margin as the new generation scales.
4. Supply discipline and structurally higher through-cycle margins: Evolving. The 26 SCAs, pricing floors and multiyear capacity constraints are direct evidence in favor. The precise terms also show why I will not call this pillar complete: 25% of covered revenue reprices periodically, agreements cover more than 35% rather than all sales, and new global capacity is on its way. The 40% terminal gross margin is my way of reflecting this.
5. Undervalued on normalized cash flow: Confirmed. The target moves from the $1,630 target to $1,678 even after a higher WACC. The shares have risen substantially since my original $295 purchase thesis, but the earnings and cash-flow base has moved faster.
Valuation: stronger cash flow, higher WACC
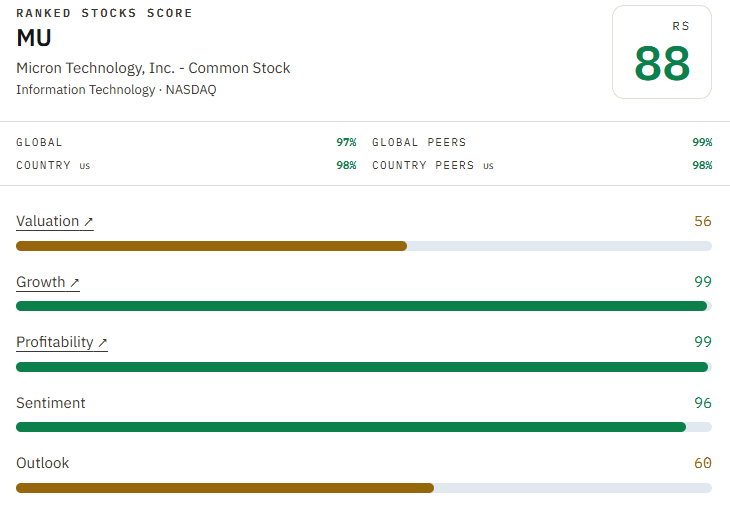
The DCF now outputs $1,678. The new target adds $48. The small net increase understates how much the operating forecast rose because the cost of capital moved the other way.
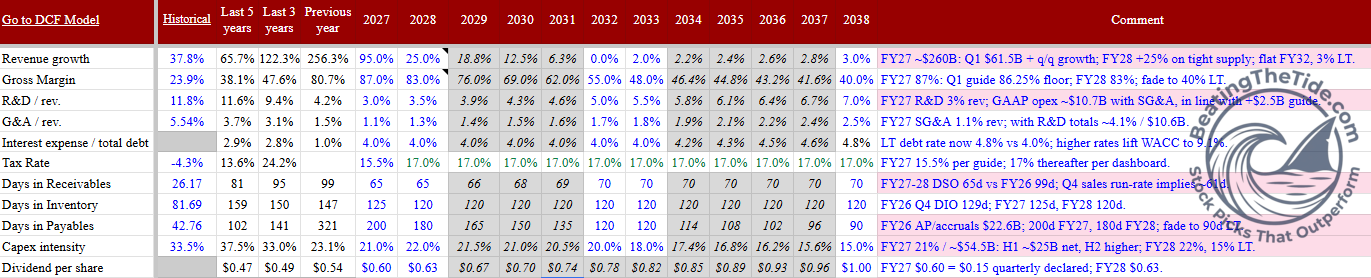
The FY2027 revenue growth assumption is 95% ($260B of revenue). That follows Q1 guidance of $61.5B and management’s expected sequential growth each quarter. FY2028 revenue growth is 25%, then slows sharply. Gross margin is 87% in FY2027 and 83% in FY2028, declines to 55% in FY2032, and reaches 40% at the model horizon. The terminal growth rate remains 3%. These assumptions give the customer agreements a payoff during their stated term and then restore cyclical pressure beyond it.
Expense and investment matter just as much. FY2027 R&D and SG&A together equal about 4.1% of revenue, or $10.6B, consistent with management’s higher operating-expense outlook. FY2027 capex is 21% of sales, about $54.5B; FY2028 capex is 22%, about $71.4B. Capex then moderates toward 15% of sales at the horizon. The working-capital forecast reflects a larger business, high current receivables and the need to fund growth.
The discount rate is the offset. I increased the long-term debt rate assumption from 4.0% to 4.8% to reflect the rise in rates. That lifts WACC from 8.8% to 9.1%. Higher WACC reduces the present value of future cash flows, especially those in the later years and terminal value. I am locking the target at $1,678.
RankedStocks and peer context
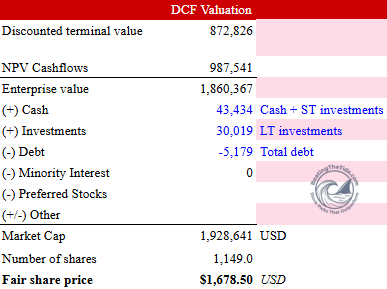
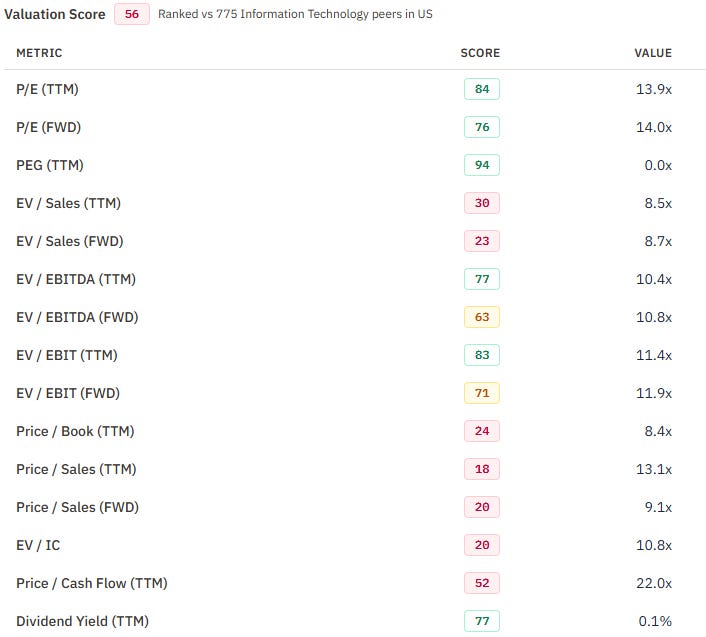
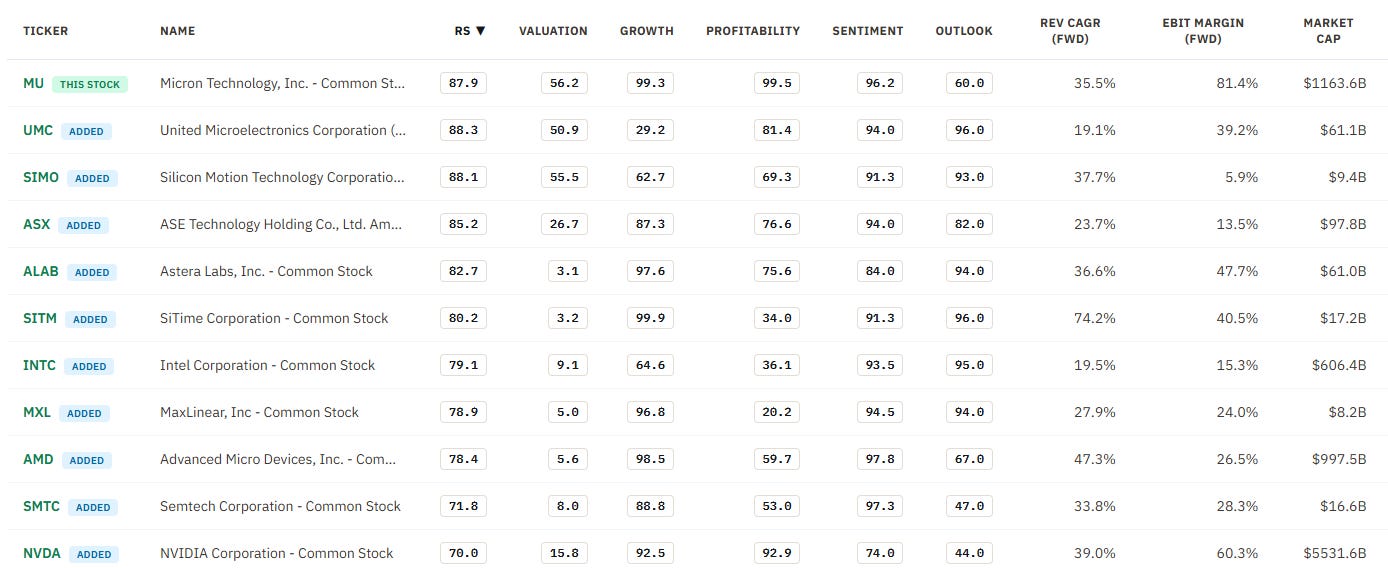
RankedStocks gives MU an 88 overall score, in the 97th global percentile. Growth and profitability both score 99, sentiment 96, valuation 56 and outlook 60. That distribution captures the investment debate well: the business is delivering exceptional growth and profit, while the screen is no longer calling the shares uniformly cheap.
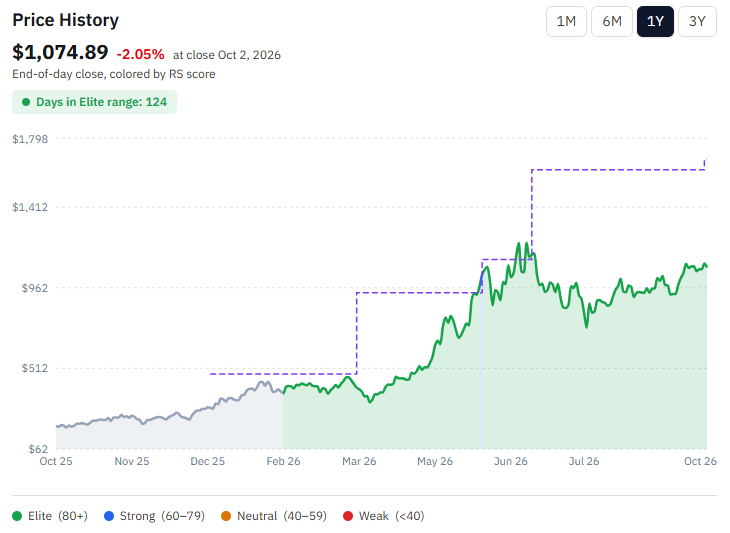
The chart shows how far the stock has traveled since the original thesis. A rising price can coexist with a rising fair value when the cash-flow base changes this fast; it also narrows the room for an execution mistake.
The valuation scorecard shows 13.9x trailing P/E and 14.0x forward P/E, but 8.7x forward EV/sales and 9.1x forward price/sales. Earnings multiples capture today’s extraordinary margin; sales multiples warn how much of it investors now capitalize on.
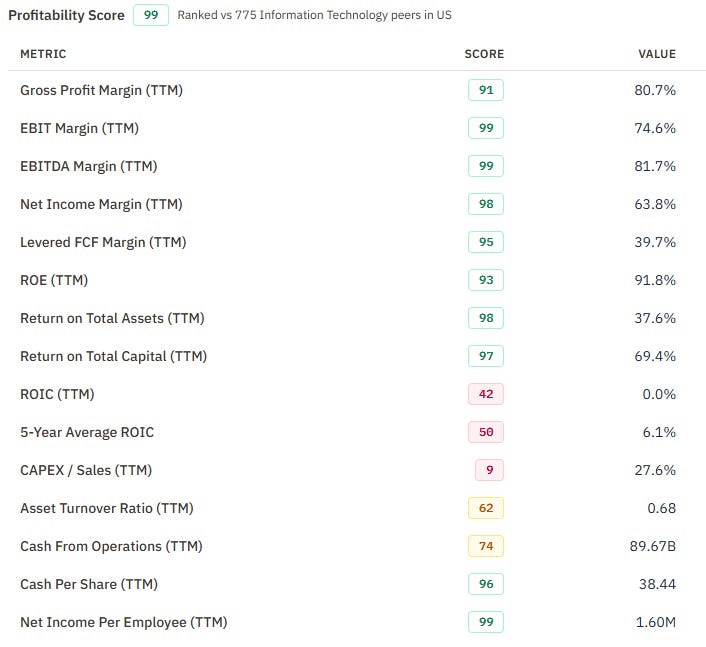
Profitability is no longer the lagging metric I described in June. The supplied screen now scores it 99, with an 80.7% trailing gross margin, 74.6% EBIT margin and $89.67B in operating cash flow. That is a real correction to the earlier read. It also reports 27.6% trailing capex/sales, reminding us that the cash machine still requires a vast fabrication budget.
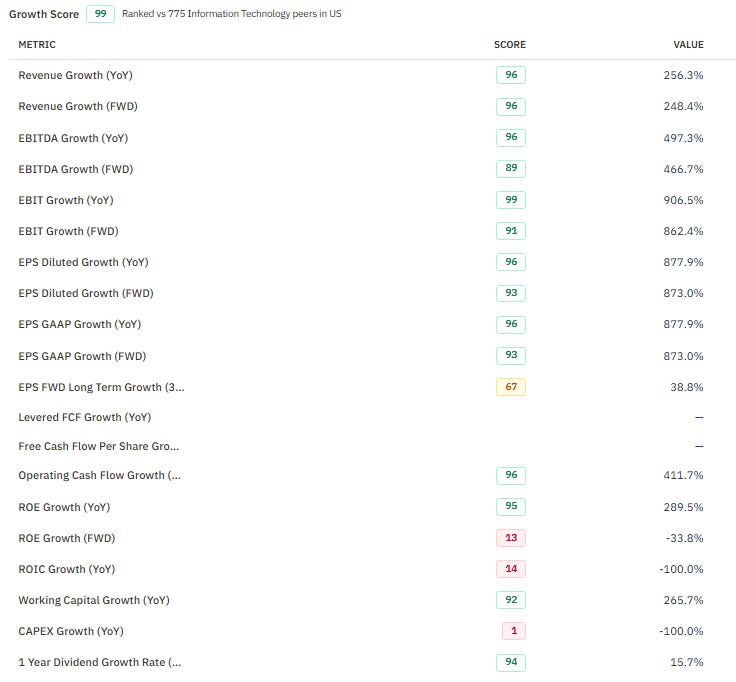
The growth detail scores 99 too. Forward revenue growth of 248.4%. I prefer Micron’s $61.5B Q1 guide and the quarterly path in the DCF.
The peer table places MU near the top of its semiconductor comparison group on overall score, growth and profitability. Its outlook score of 60 sits well below its other operating factors. That gap is why management’s Q1 guide and contract disclosure were the decisive fresh evidence in this update.
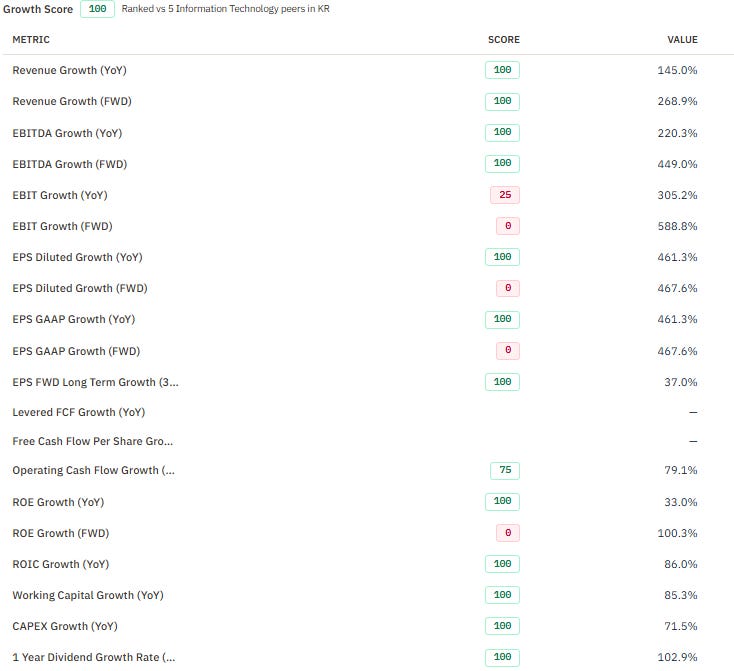
The growth screens show two companies profiting from the same shortage at different points in their estimate cycles. MU’s trailing revenue growth is 256% vs. SK Hynix’s 145%, while the forward revenue estimates are 248% for MU and 269% for SK Hynix. Forward EBITDA growth is 467% for MU vs. 449% for SK Hynix. MU has the stronger trailing acceleration; SK Hynix’s revenue forecast has slightly more growth still ahead.
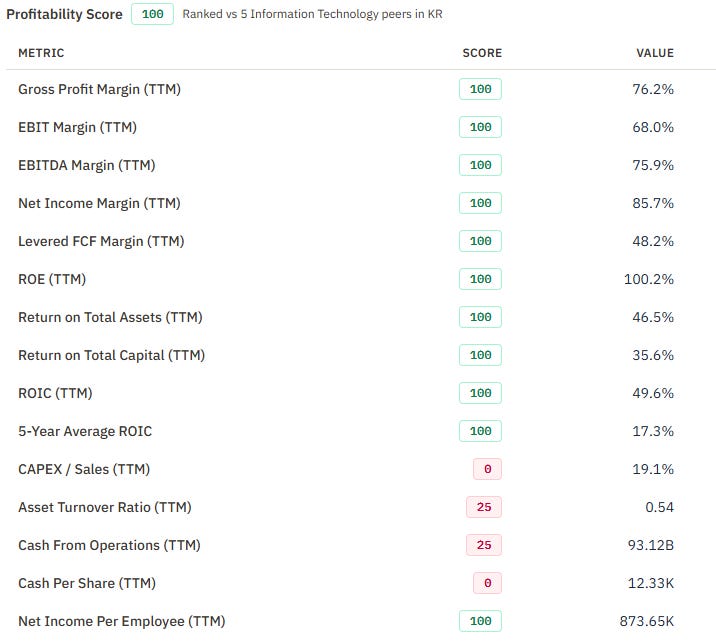
MU leads on current operating margins: 80.7% trailing gross margin vs. 76.2% at SK Hynix, 74.6% EBIT margin vs. 68.0%, and 81.7% EBITDA margin vs. 75.9%. SK Hynix leads on the cash measures in these screens, with a 48.2% levered FCF margin vs. MU’s 39.7% and capex at 19.1% of sales vs. MU’s 27.6%. MU has stronger reported pricing and operating profit; SK Hynix is converting more of its sales into FCF after a lighter capital burden. That is why I track MU’s FY2027-28 capex alongside its margins.
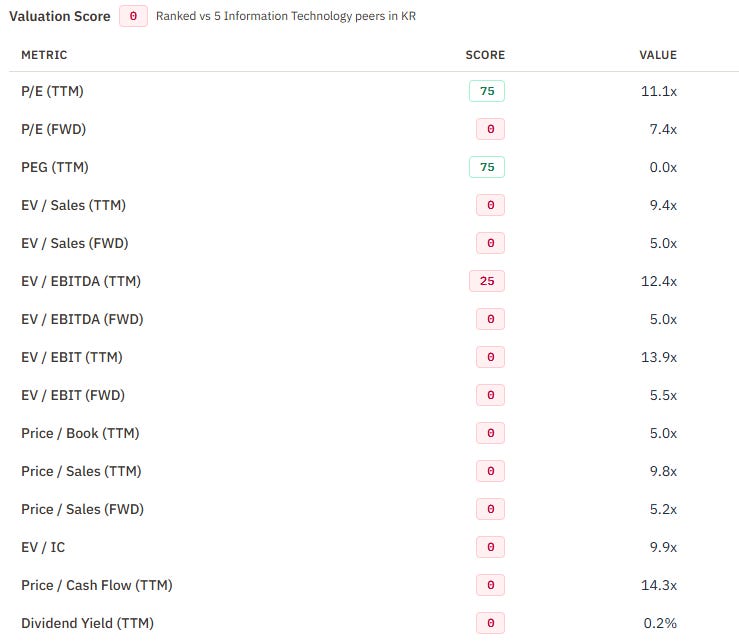
SK Hynix is cheaper on every forward multiple shown here: 7.4x earnings vs. 14.0x for MU, 5.0x EV/EBITDA vs. 10.8x, and 5.0x EV/sales vs. 8.7x. MU trades at nearly twice SK Hynix’s forward P/E even though the peer’s forward revenue growth is slightly faster. The MU premium rests on its specific cash-flow path and execution, not on being the cheapest memory stock.
Risk register and verdict
Pricing and contract coverage. The agreements cover more than 35% of estimated revenue through 2030, and only three quarters of covered revenue has defined pricing frameworks. The remaining book can still reset with the market. I will watch minimum-price RPO, the share of revenue under SCAs and realized margin together. A widening gap between headline RPO and actual pricing would weaken the structural thesis.
Capacity and margin. Every major producer has an incentive to add output at today’s margins. Micron’s fabs arrive over several years, and competitors are investing too. My model fades gross margin from 87% to 40%; a faster pricing decline would hurt the target. The related watch item is whether capex rises faster than contracted demand, especially after FY2028.
Customer concentration and AI spending. Data-center units now account for roughly 63% of Q4 sales. A pause in hyperscaler deployment or server purchases would reach Micron quickly. Take-or-pay contracts and deposits cushion this exposure; they do not make the rest of the business immune.
Rates and valuation. A 9.1% WACC already incorporates the higher 4.8% long-term debt rate. If the cost of capital rises again, the DCF target falls even with the same operating forecast. The rate change trims the value of the later forecast years and terminal cash flows.
I am keeping Buy and locking in $1,678. Q4 confirmed a larger, more cash-generative Micron than the one I valued in June; 26 customer agreements and the Q1 guide extend visibility into FY2027. I have corrected my earlier overstatement about fixed pricing, raised the discount rate as rates rose, and kept a 40% long-term gross-margin anchor. The question now is whether the industry can add capacity faster than customers can absorb it. The agreements and fab timelines say the answer is no through the next two years.
Portfolio Update
The portfolio gained 0.2% for September 28-October 2 while the S&P 500 fell 0.3%, a 0.5-point lead. We were down 3.2% at Wednesday’s close, then recovered through Friday to finish slightly ahead for the week.
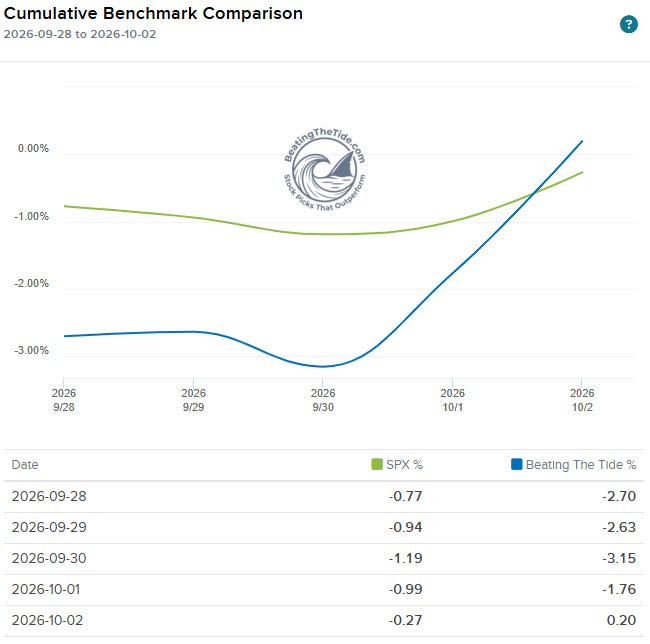
Portfolio Return
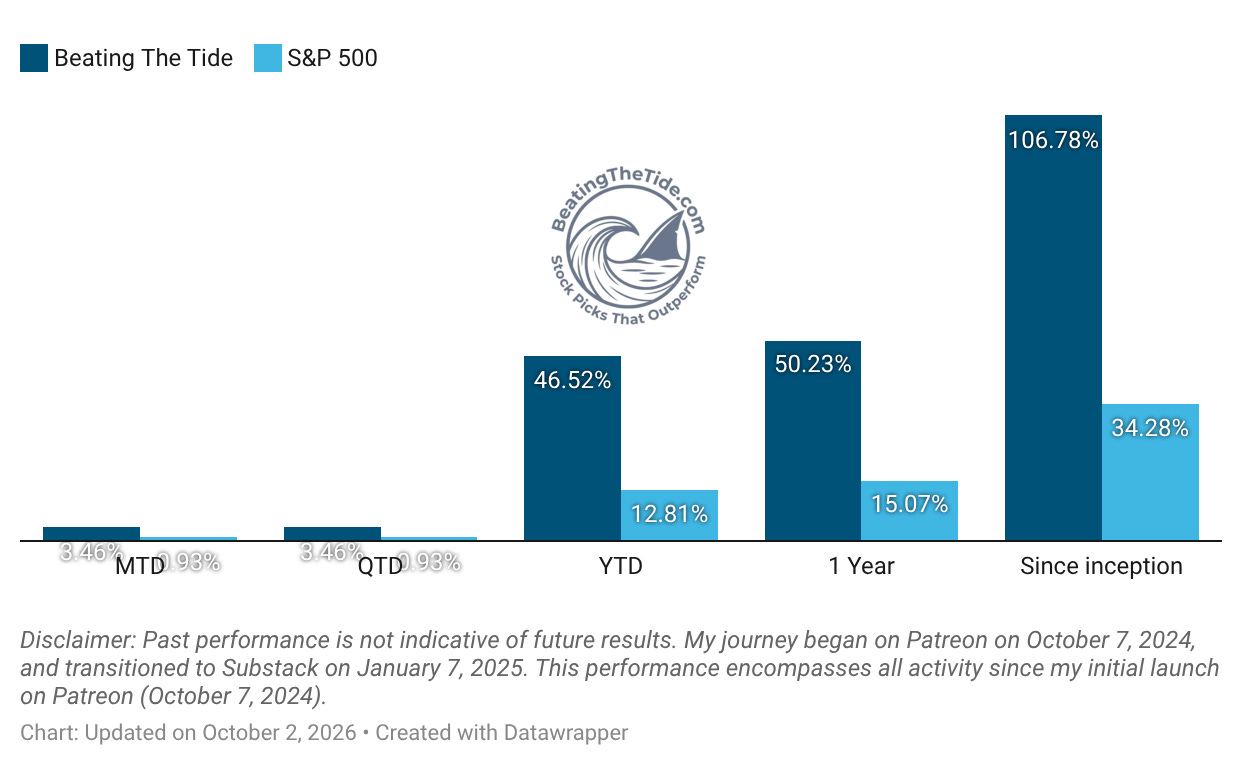
Month-to-date: +3.5% vs. the S&P 500’s +0.9%.
Year-to-date: +46.5% vs. the S&P 500’s +12.8%. That is a gap of 3,371 basis points.
Since inception: +106.8% vs. the S&P 500’s +34.3%. That’s 3.1x the market.
Contribution by Sector
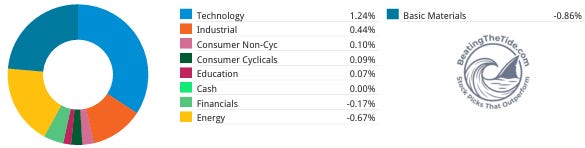
Technology added 124 bps and industrials 44 bps. The late-week technology rally helped the broader market. Basic materials took away 86 bps as gold fell amid a stronger dollar and high Treasury yields; energy cost 67 bps while oil headed for a weekly decline.
Contribution by Position
How to read the heat map? Click here.
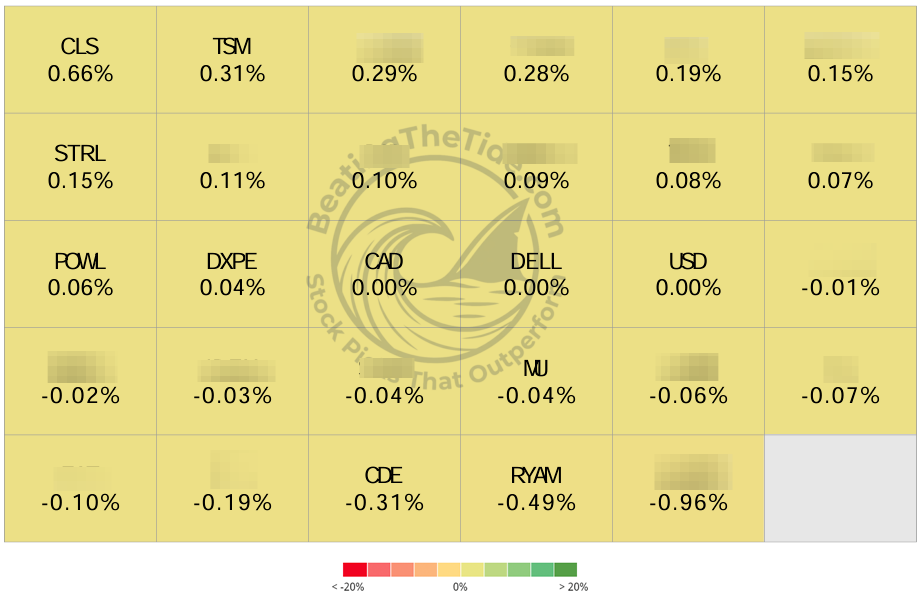
+66 bps CLS 3.09%↑ (TSX: CLS) (Thesis)
+31 bps TSM 1.99%↑ (Thesis)
+15 bps STRL 4.60%↑ (Thesis)
+6 bps POWL 1.10%↑ (Thesis)
+4 bps DXPE 2.42%↑ (Thesis)
0 bps DELL 3.90%↑ (Thesis)
-31 bps CDE 0.74%↑ (Thesis)
-49 bps RYAM -3.71%↓ (Thesis)
That’s it for this week.
Stay calm. Stay focused. And remember to stay sharp, fellow Sharks!