


Hello fellow Sharks,
We started the week lagging the market but by Friday the S&P 500 closed flat while the portfolio advanced +2.0%. If you want to skip straight to the numbers, jump to the Portfolio Update.
Last week, I published an update for paid subscribers on a position that is +72% in the five months since I added it to the portfolio.

I bought it in March while missiles were flying over the region, and the pushback in my inbox was immediate: who buys into an active war? The company answered with records on every line of the income statement, the first dividend in its history, and a target I raised by 13%, so there is still 34% upside left.
I flew back to Toronto on Thursday night and arrived Friday morning. Right before I hopped on the plane, I got an alert that RankedStocks.com was down: traffic had surged beyond my expectations, and there was a hardware error. The team proactively put a note on the site so visitors knew they were working on it.
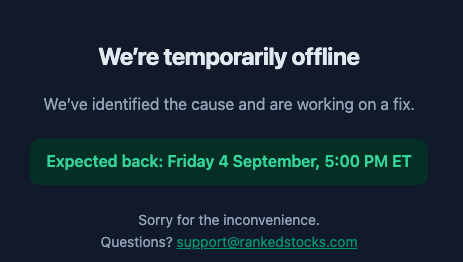
However, the fix was more involved than expected, and it took them until Saturday to bring the site back up. It is working now; sorry for the inconvenience.
Last week, two companies reported.

As per the thought of the week, I go over DELL’s Q2 results: a second straight record quarter, $60.9B of AI orders in a single quarter, a $95B backlog, and a $25B raise to the full-year guide. The stock is up 325% since I added it in February, the best performer in the portfolio YTD, and the price now sits as far from my bear case as from my target. So I am moving DELL from BUY to HOLD and adding it to my trim list.
If you own it, read this one (and the two questions I ask before selling a winner) before you decide anything; if you are thinking of buying it at $524, read it twice.

Finally, you might have noticed a new section called Chilean Stocks. That is where I will post my trade ideas in the Chilean market. To be clear, this is NOT the international diversification I have been talking about for the BTT portfolio; it is a free extra covering my occasional trades in Chile. The section will be in English and Spanish.
You have been added to it automatically, so those emails will land in your inbox as they come out. If you are curious, stay on and tell me what you think. If Chile is not your thing, muting it takes three clicks (Substack’s guide is here):
go to substack.com/settings,
click Beating The Tide under Subscriptions, and
switch off the toggle next to Chilean Stocks .
Enjoy the read, and have a great Sunday.
~George
Table of Contents:
Thought Of The Week
DELL Q2 2027 Update: +325% Since February, And I Am Moving From BUY To HOLD
As you know by now, last week was a hectic, non-investment-related week. I barely had enough time to do anything besides the task at hand. However, I got a message from one of you that DELL was down, so I quickly checked the press release and didn’t see why Mr. Market reacted that way.
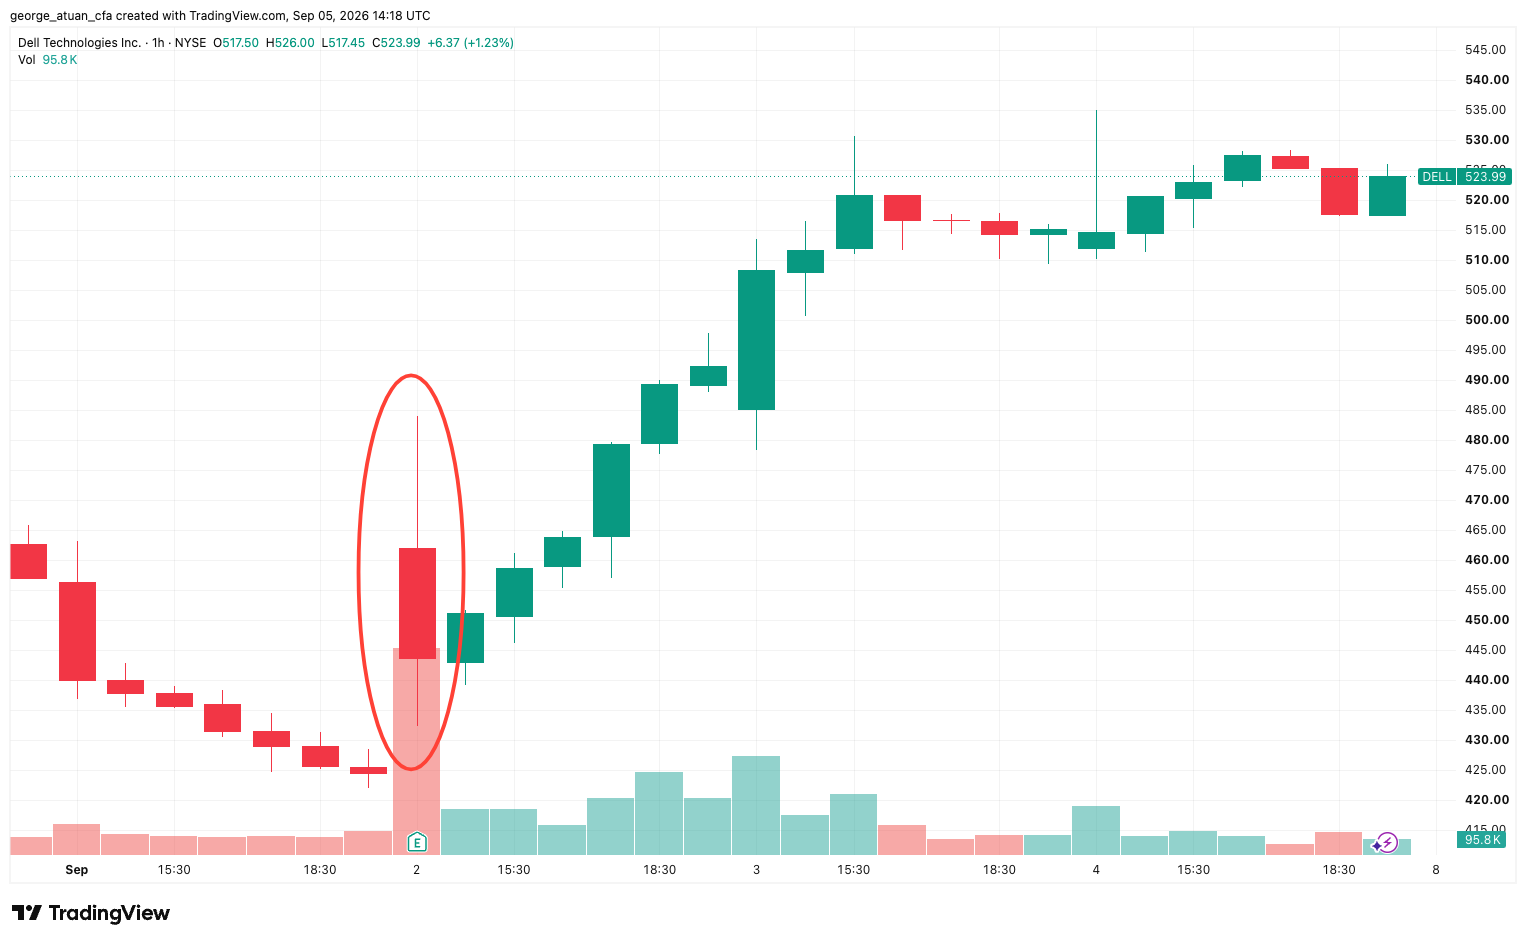
Later the stock recovered and went on to a new high. Today it is sitting at an all-time high of $524. Here I go over the results, the refreshed valuation and why it goes to my trim list.
Table of Contents
The quarter: records everywhere, and a margin I do not trust yet
Valuation: from $639 to $601, and the bear from $325 to $450
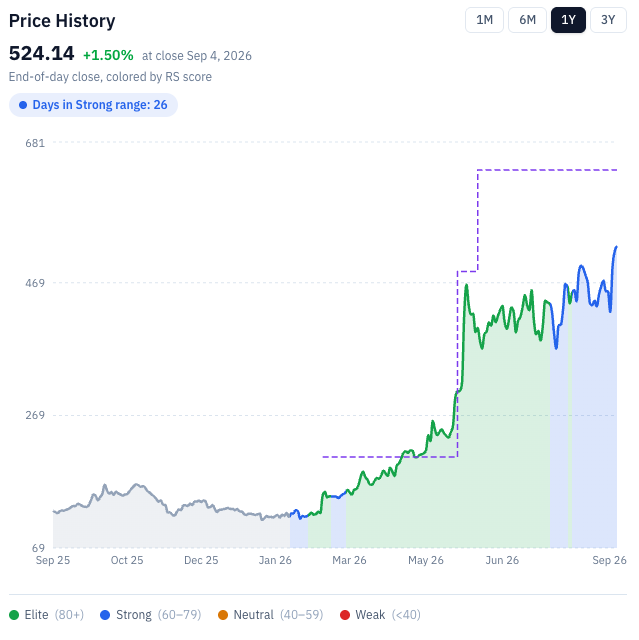
Since adding Dell Technologies [DELL 0.00%↑] to the portfolio in February, it is up +325%, the best performer in the portfolio.

I bought at $123 the week before the Q4 print, watched Q1 push it past $420, and this week watched Q2 push it to $524. In my June update I asked whether the second double was still in front of us.

Three months later the answer is that most of it arrived, and the question has changed: is there enough left to keep paying for it?
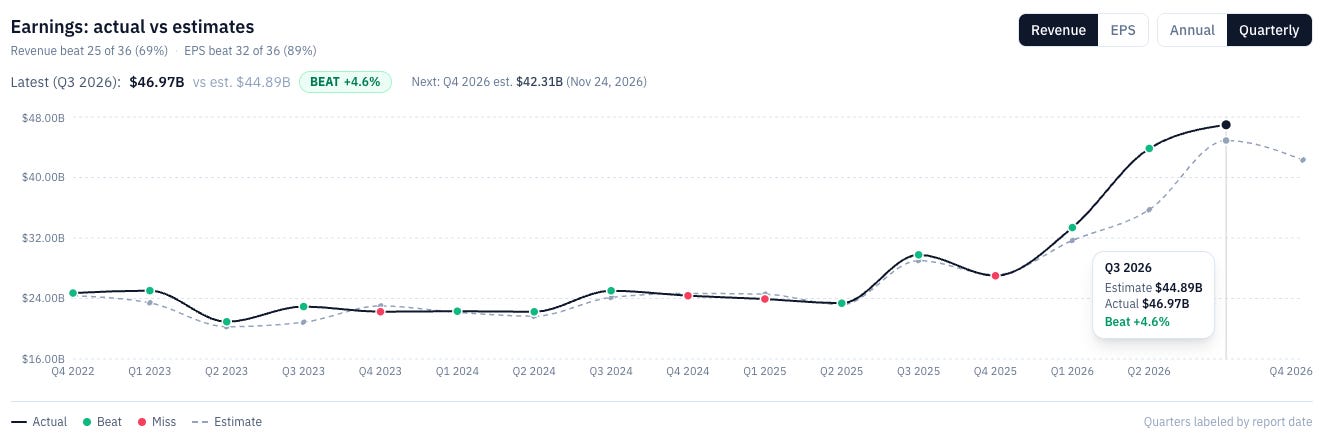
Last week DELL reported a quarter that beat its own raised bar for the second time in a row. Revenue grew 58% y/y and beat consensus by $2.1B…third revenue beat in a row.
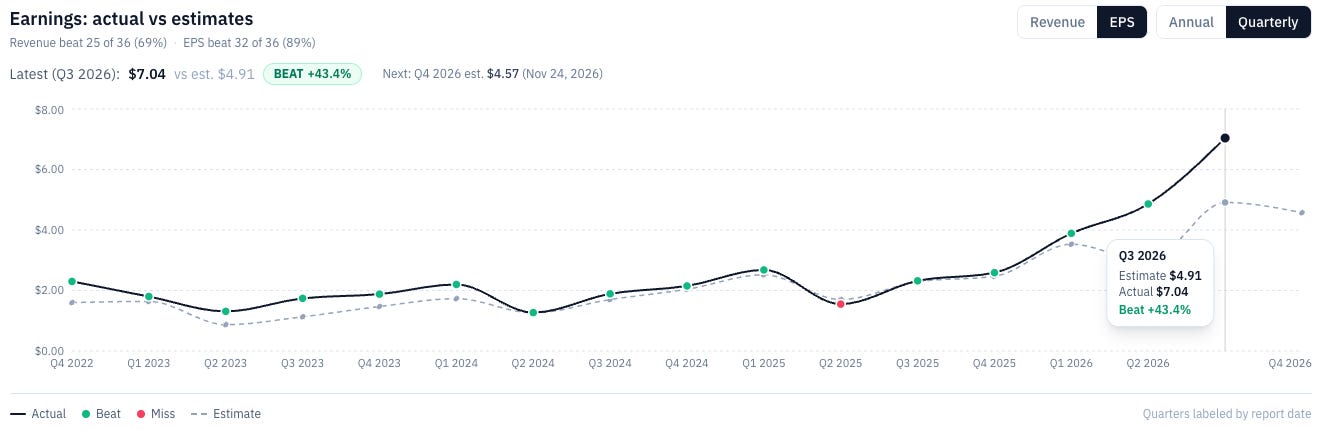
GAAP EPS grew 273% and non-GAAP EPS beat by 43%...sixth EPS beat in a row.
AI orders were $60.9B in one quarter, the backlog almost doubled to $95B, and management raised the full-year revenue guide by $25B to $192B.
I first laid out the DELL thesis in my deep dive in February.

The thesis was built on five pillars: an operator edge, an AI demand wave, an attach-later margin story, a cash machine, and a shareholder flywheel. I updated it on May 24 after the Q4 record and again in June after Q1, when I raised the target to $639 and the bear to $325. This time four of the five pillars come out stronger, one comes out weaker, and the rating comes out lower. The last part is the one worth your time.
TLDR
• Q2 earnings were records on revenue, EPS and capital returned, and management raised the year by 15% to $192B, with AI-server revenue now guided to triple.
• Scorecard: of my five original pillars, three are confirmed and two are evolving. The cash machine drops a grade for the first time.
• The number that changed my mind is cash: operating cash flow fell 13% y/y in a quarter where net income grew 255%, and reported FCF was an eighth of adjusted FCF, with the gap filled by DELL financing its own customers.
• Valuation: the base case moves from $639 to $601 and the bear from $325 to $450. At $524 the upside and the downside are the same size.
• I am moving DELL from BUY to HOLD, and it joins my trim list.
How DELL ranks
DELL scores 75 on RankedStocks.com, a Strong rating rather than the Elite it carried through the spring, and the card tells the HOLD story in one picture: Growth, Profitability and Sentiment high, Valuation and Outlook low.
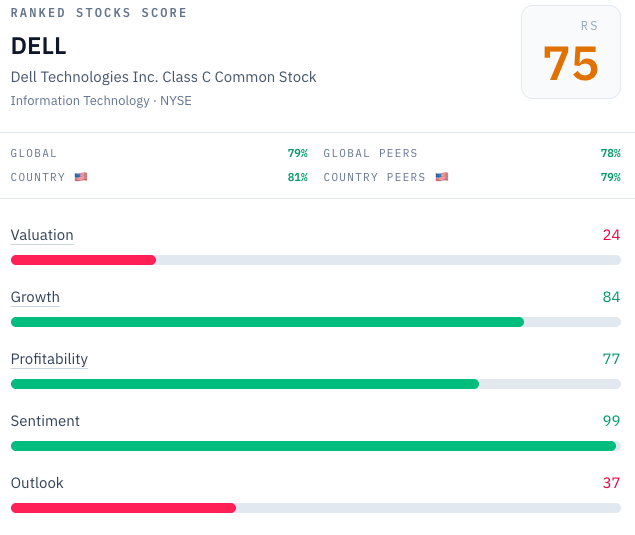
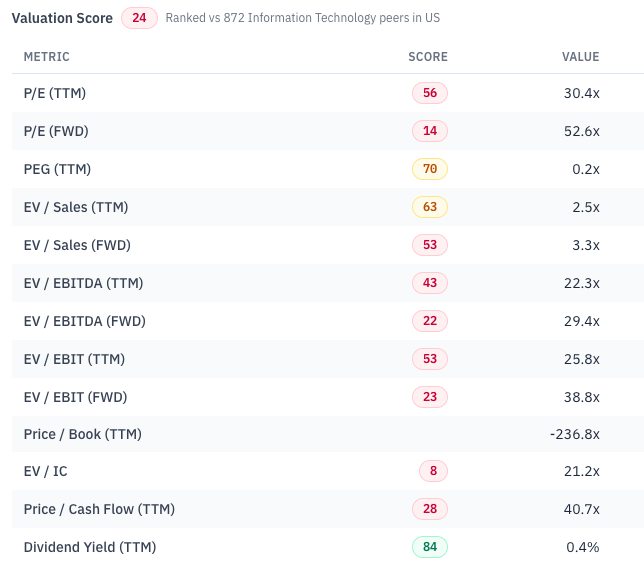
Valuation 24. Every trailing multiple sits in the middle of the pack and every forward one sits near the bottom, which is what a stock looks like after it triples in eight months and Mr. Market has already paid for the guidance raise. Only the dividend yield and the PEG score well, and PEG only because the trailing growth denominator is 200%.
Growth 84. Every forward growth metric scores around 40, because consensus already models the deceleration I describe below.
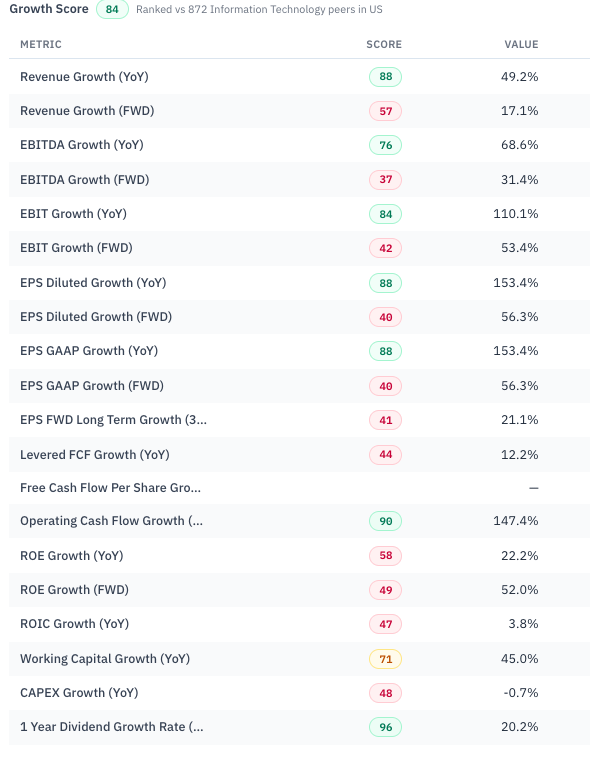
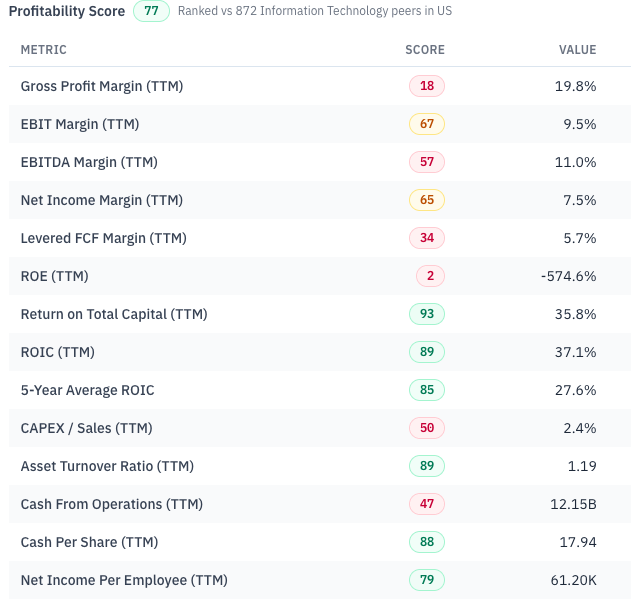
Profitability 77. The return metrics do the work, because the negative working capital machine keeps invested capital tiny. The margin metrics score poorly, and that is the business: an assembler’s gross margin, however well run.
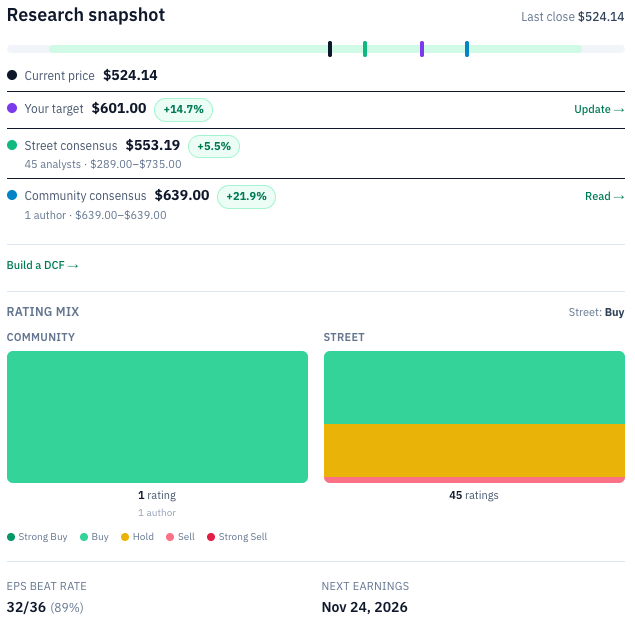
Sentiment 99 and Outlook 37. Sentiment measures what the price has done. Outlook measures what the Street expects it to do next, and the Street’s average target sits 9% below the current price.
You can run this on any ticker yourself, for free, at RankedStocks.com.
Thesis scorecard after Q2 2027
Three pillars confirmed, two evolving, and the one that dropped a grade is the cash machine.
Pillar #1. The operator edge: Confirmed.
Original thesis: DELL has no product moat, but in commodity-like hardware the best operator wins, on a direct model, supply-chain discipline, and a negative-working-capital machine that drives +20% ROIC.
Evolution: Graded stronger in May after DELL repriced its server book inside a quarter when memory costs spiked, and again in June when opex hit a 20-year low.
What happened since last update: Non-GAAP opex fell to 8.5% of revenue and the full-year guide of 8% is the lowest in the company’s 42-year history. Management gained more than ten points of traditional server share in two quarters. DELL was first to ship rack systems on the Nvidia [NVDA 0.00%↑] Vera Rubin platform, and some engagements now require upwards of 50 unique designs per customer.
Assessment: The edge is real and it widened. It also has a ceiling: a 42-year low on opex is a base that only rises from here, and the CFO now attributes over 400 basis points of Q2’s ISG margin to scale, which is a gift that stops giving when growth slows.
Pillar #2. The AI demand wave: Confirmed and strengthening.
Original thesis: Enterprise and cloud infrastructure spend is shifting to AI clusters, and DELL sits where those orders land.
Evolution: An $18.4B backlog at the deep dive, $43B in May, $51.3B in June.
What happened since last update: $60.9B of AI orders in one quarter, more than the $51.3B backlog DELL started it with. The backlog exited at $95B, trailing twelve-month orders are $131.7B, and the five-quarter pipeline still grew sequentially and remains multiples of the backlog. The customer count passed 6,500, with 3,300 added in the last three quarters after it took eight quarters to reach the first 3,200.
Assessment: Demand is not the question and has not been since May. The question is how much of a $95B backlog is demand and how much is customers ordering further ahead because supply is scarce, which management confirmed they are doing.
Pillar #3. AI today, attach later: Evolving.
Original thesis: Win the AI-server footprint first, then attach higher-margin storage, networking and services as the estate matures.
Evolution: Evolving in May and June, because AI-server margins stayed mid-single-digit while storage started to show the attach.
What happened since last update: Storage grew 26%, its fastest growth in years, with Dell-IP demand above market for the sixth straight quarter and PowerStore up double digits for the ninth. Management named Dell-IP storage the biggest margin lever after scale. Traditional servers grew 122% on the 14G refresh and on CPU racks for agentic workloads, with 1.2M installed assets still 14G or older and the 18G shipping in October, replacing 12-14 legacy servers per new box.
Assessment: The attach is showing up in storage and in CPU servers, and enterprise customers buy more of both. AI-server margins themselves are still mid-single-digit, so the pillar stays Evolving. It is now the pillar that matters most for the valuation, because the bull case needs ISG to hold a 14% margin while the AI mix keeps rising, and the only way that happens is if this pillar converts.
Pillar #4. The cash machine: Evolving.
Original thesis: Negative working capital and deferred revenue keep invested capital low, so returns on capital stay high and fund the payouts.
Evolution: Confirmed in May and June, when the cash cycle held deeply negative through the AI ramp.
What happened since last update: Operating cash flow was $2.2B, down 13% y/y, in a quarter where net income grew 255% to $4.1B. Reported FCF was $986M, down 47%. Adjusted FCF was $8.1B, and the $7.2B difference is almost entirely the growth in financing receivables, which DELL adds back on the argument that lending to a customer is a choice rather than a cost.
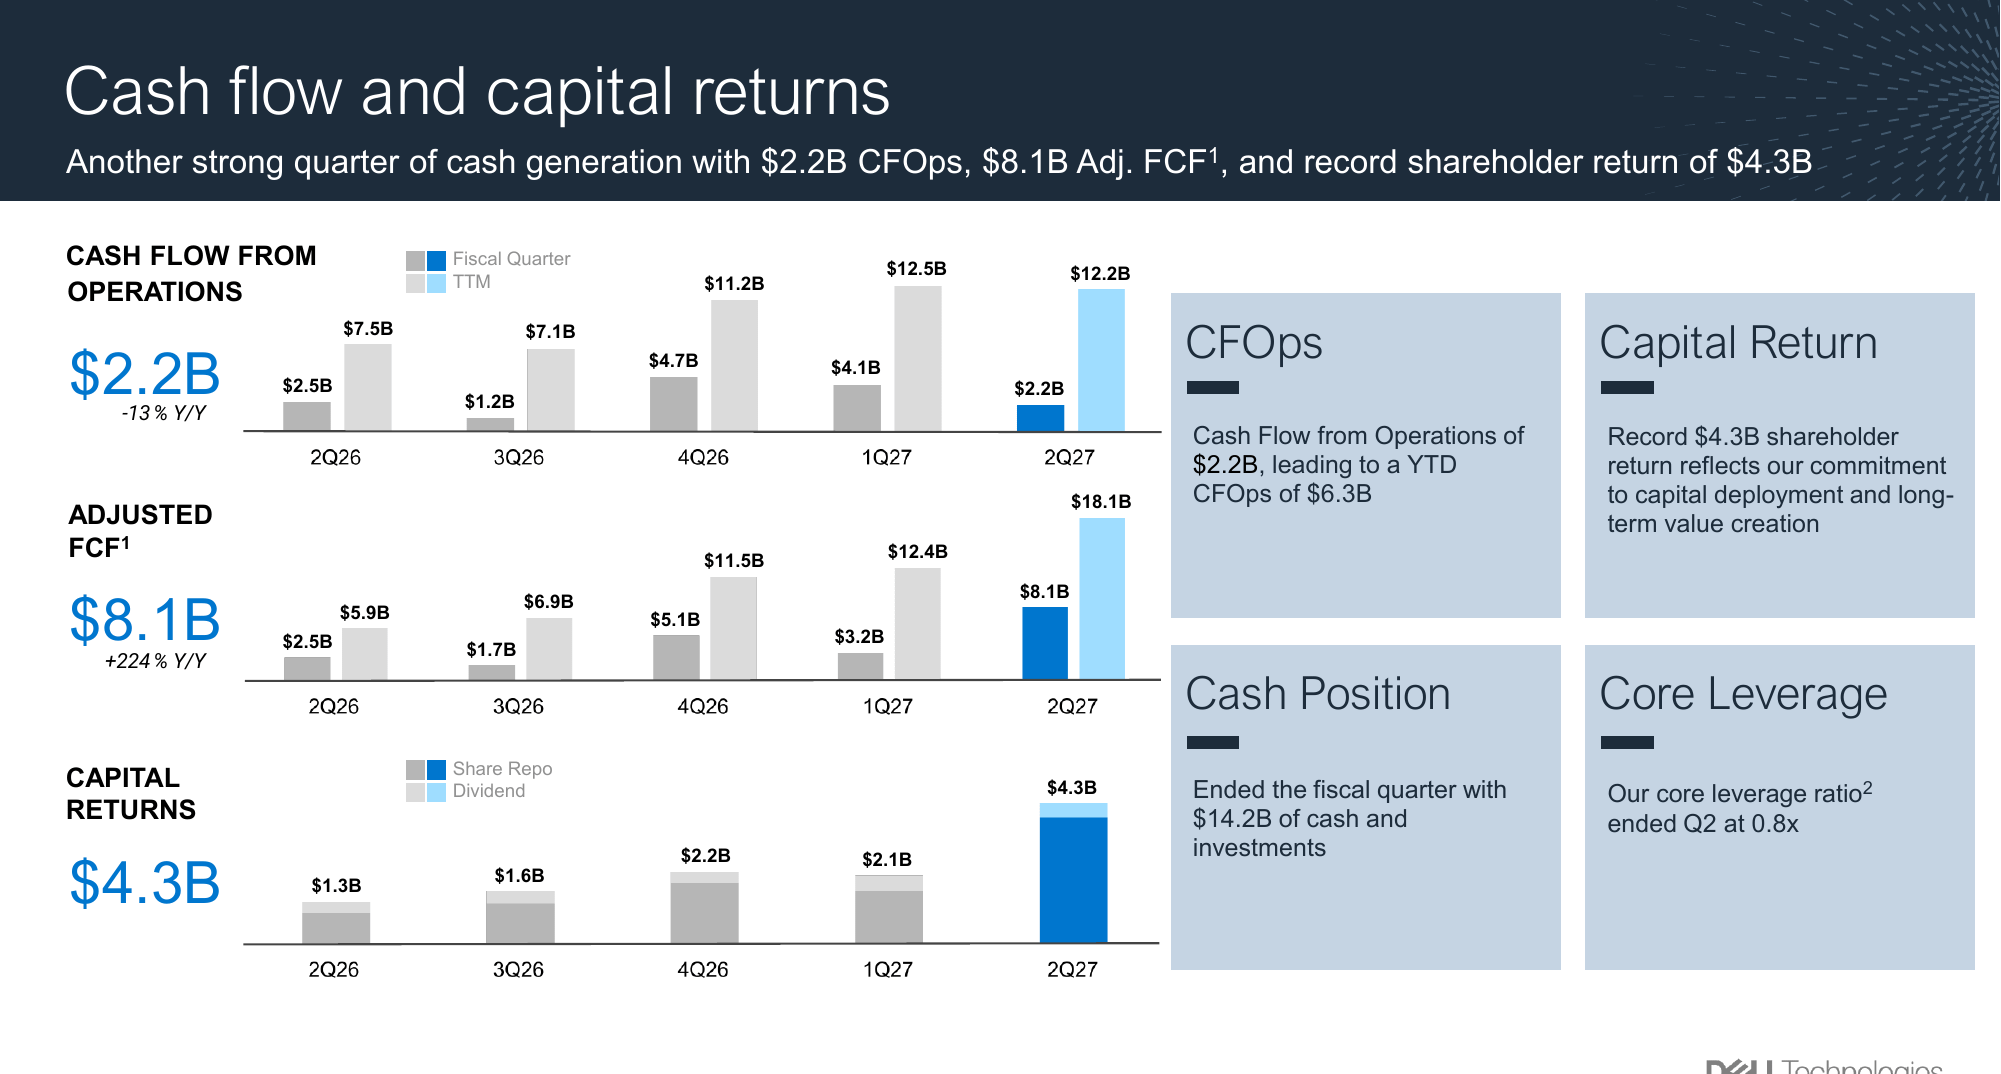
DFS originations were $7.5B, up 213%, financing receivables reached $20.4B, and inventory doubled since January to $21.3B.
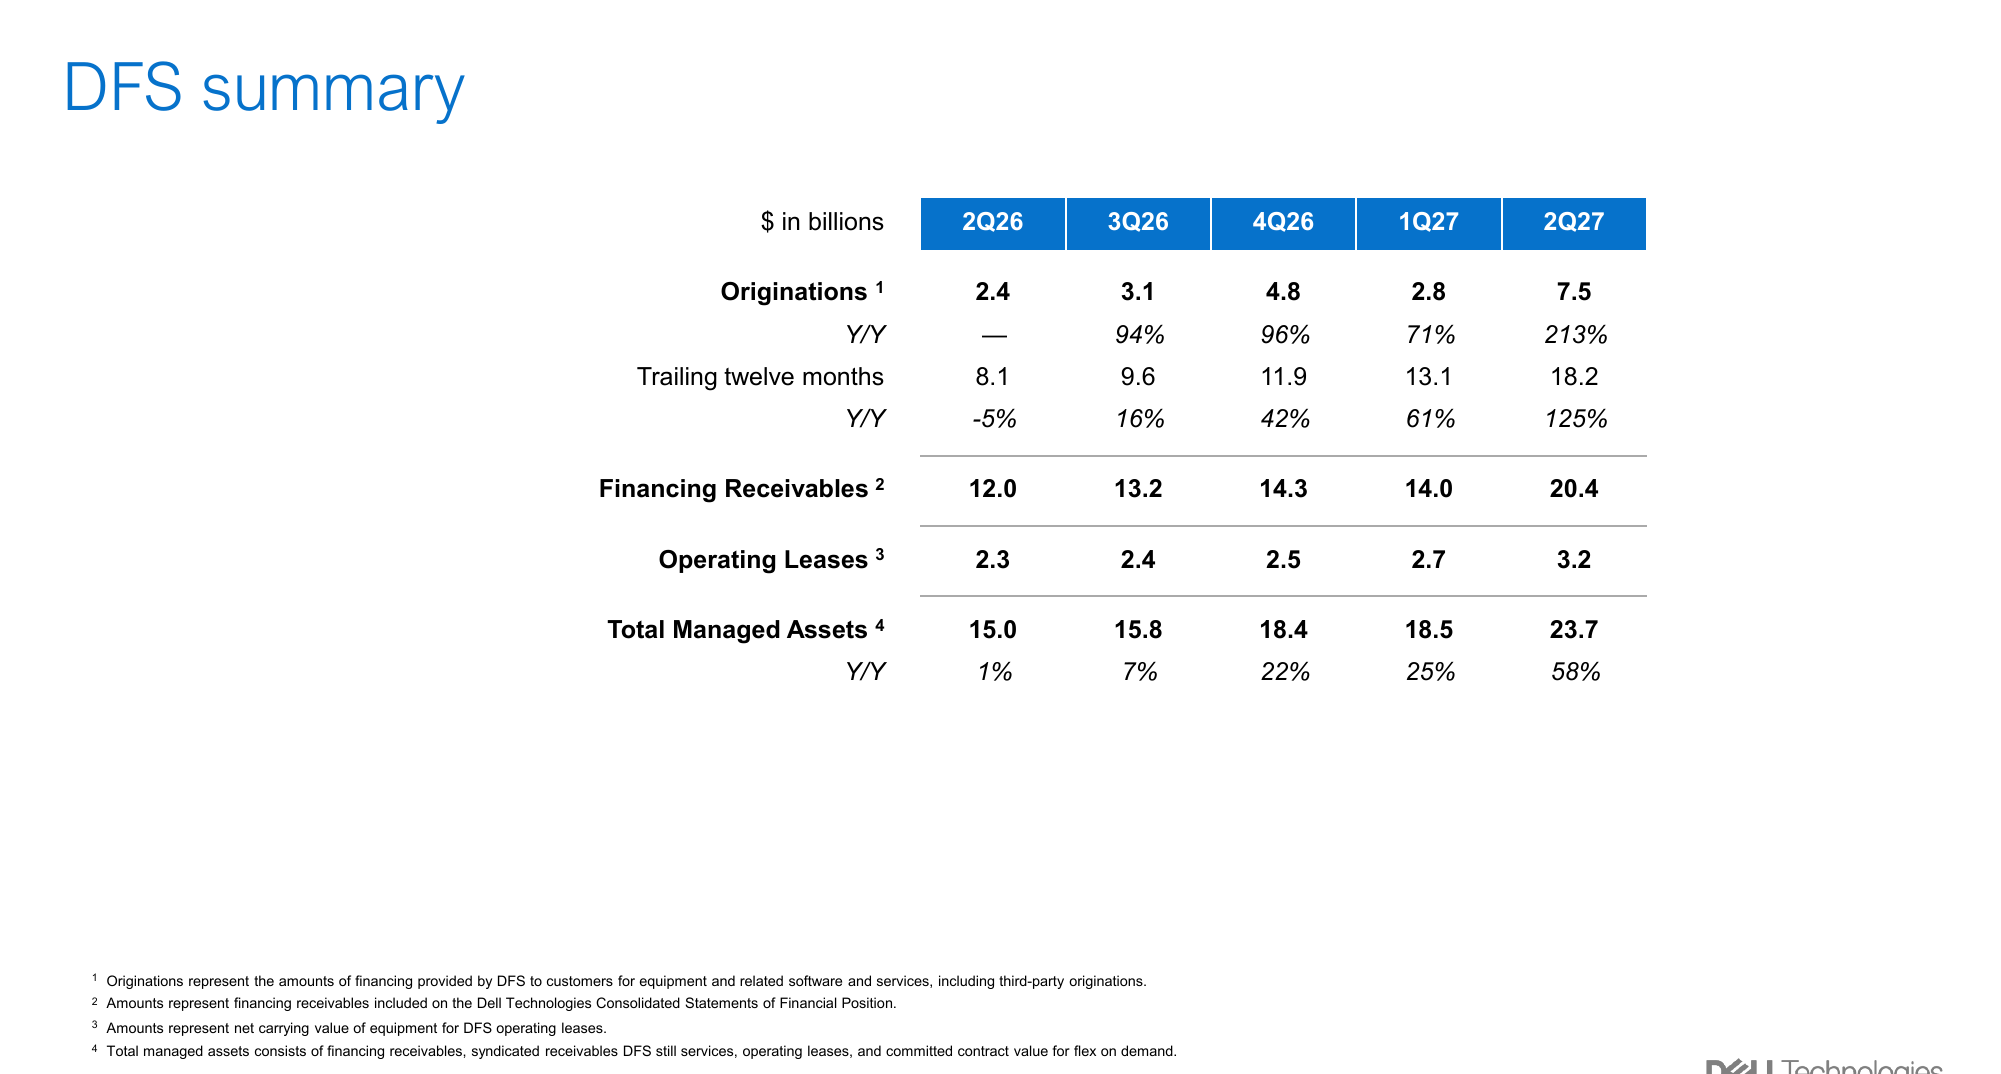
Assessment: I am downgrading this pillar from Confirmed to Evolving, and it is the grade that drives the rating. The balance sheet is fine: $14.2B of cash, core leverage of 0.8x, and positive rating actions from the agencies during the quarter. But the machine ran in reverse this quarter. A negative-working-capital model is supposed to fund growth for free, and in Q2 growth cost $6.7B of financing receivables plus a $6.2B inventory build, funded by $3.4B of net new debt. Management calls DFS selective and short-term. I believe them and I still count the receivables as capital at risk.
Pillar #5. The shareholder flywheel: Confirmed.
Original thesis: DELL returns +80% of adjusted FCF through buybacks and dividends, the share count shrinks, and per-share value compounds without hypergrowth.
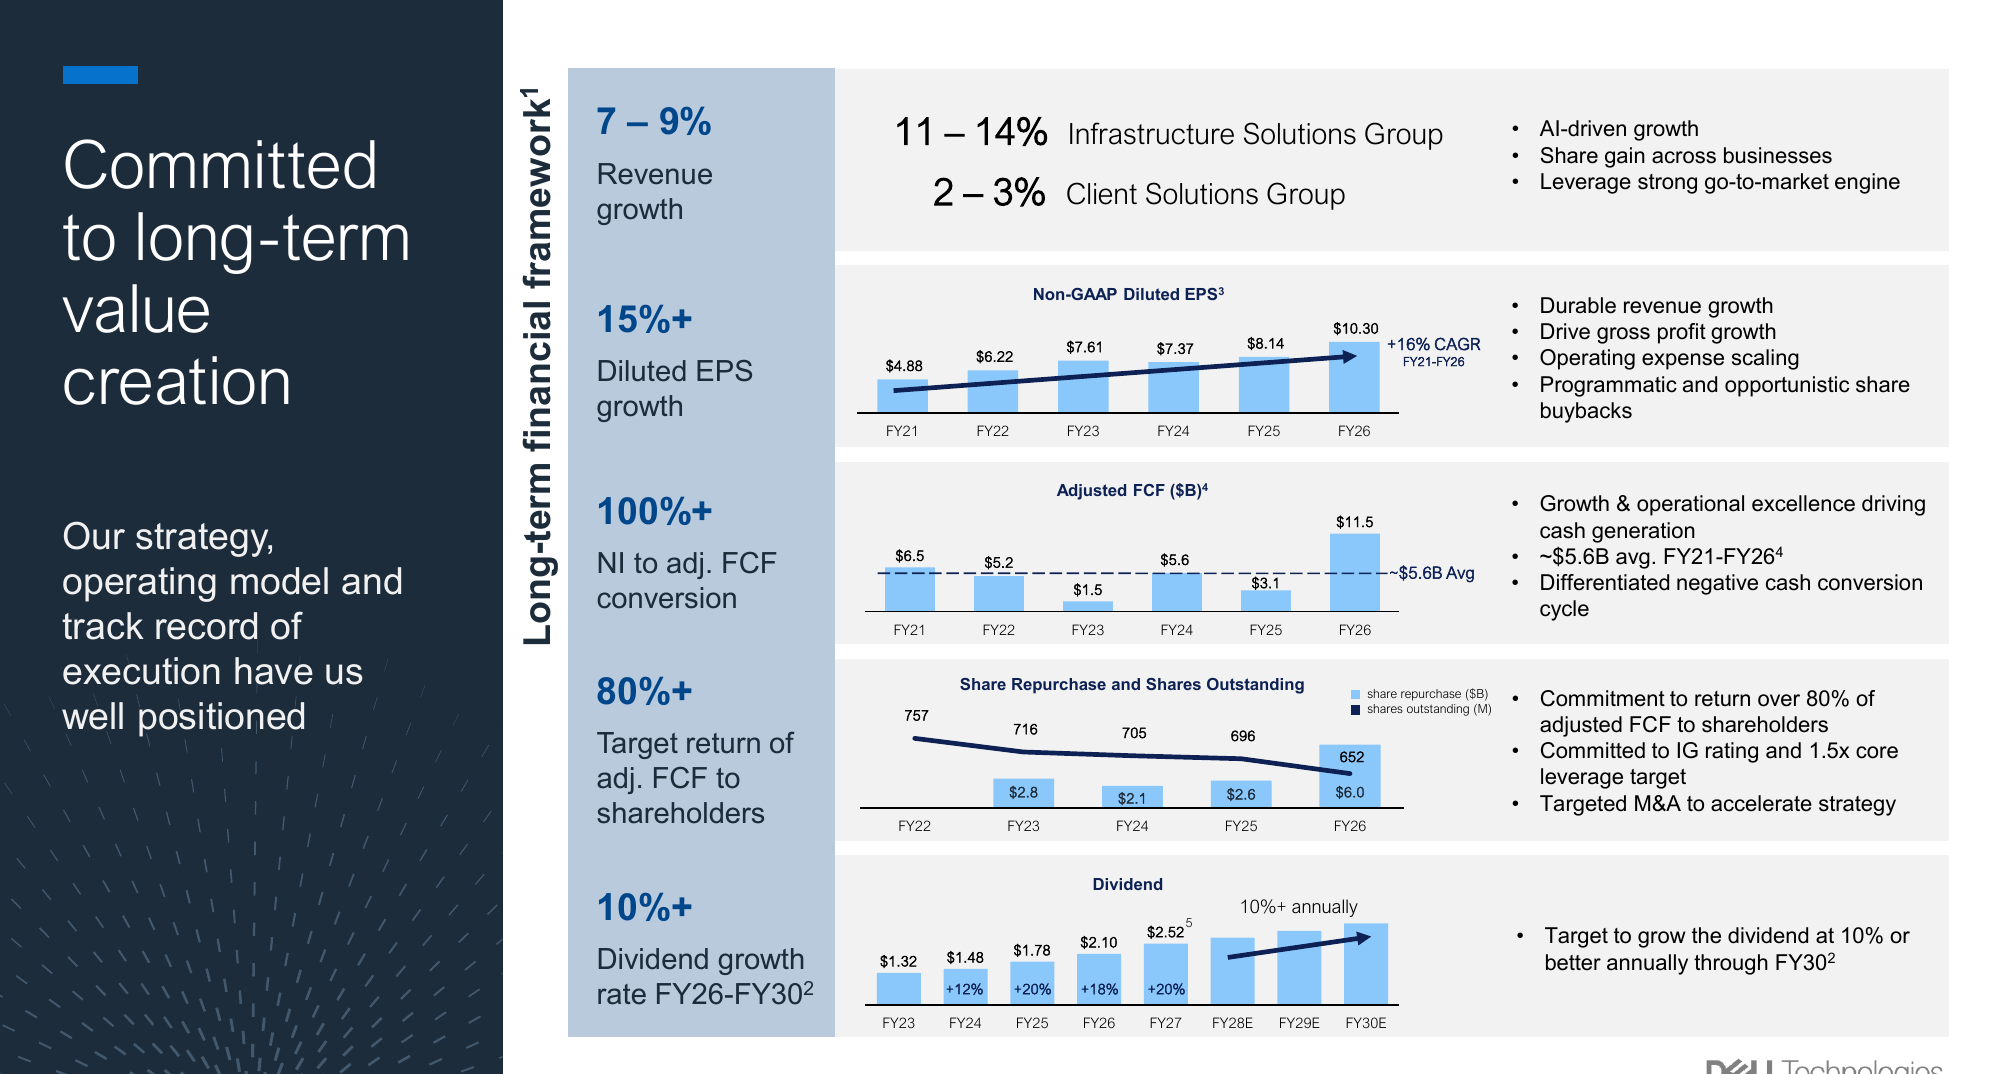
Evolution: Confirmed at every update; the dividend rose 20% in February and the buyback authorization grew $10B.
What happened since last update: A record $4.3B returned in the quarter, 9.5M shares repurchased at an average of $401, and $6.3B returned in the first half. The diluted share count is 652M, down 5% y/y, and guided to 651M for Q3.
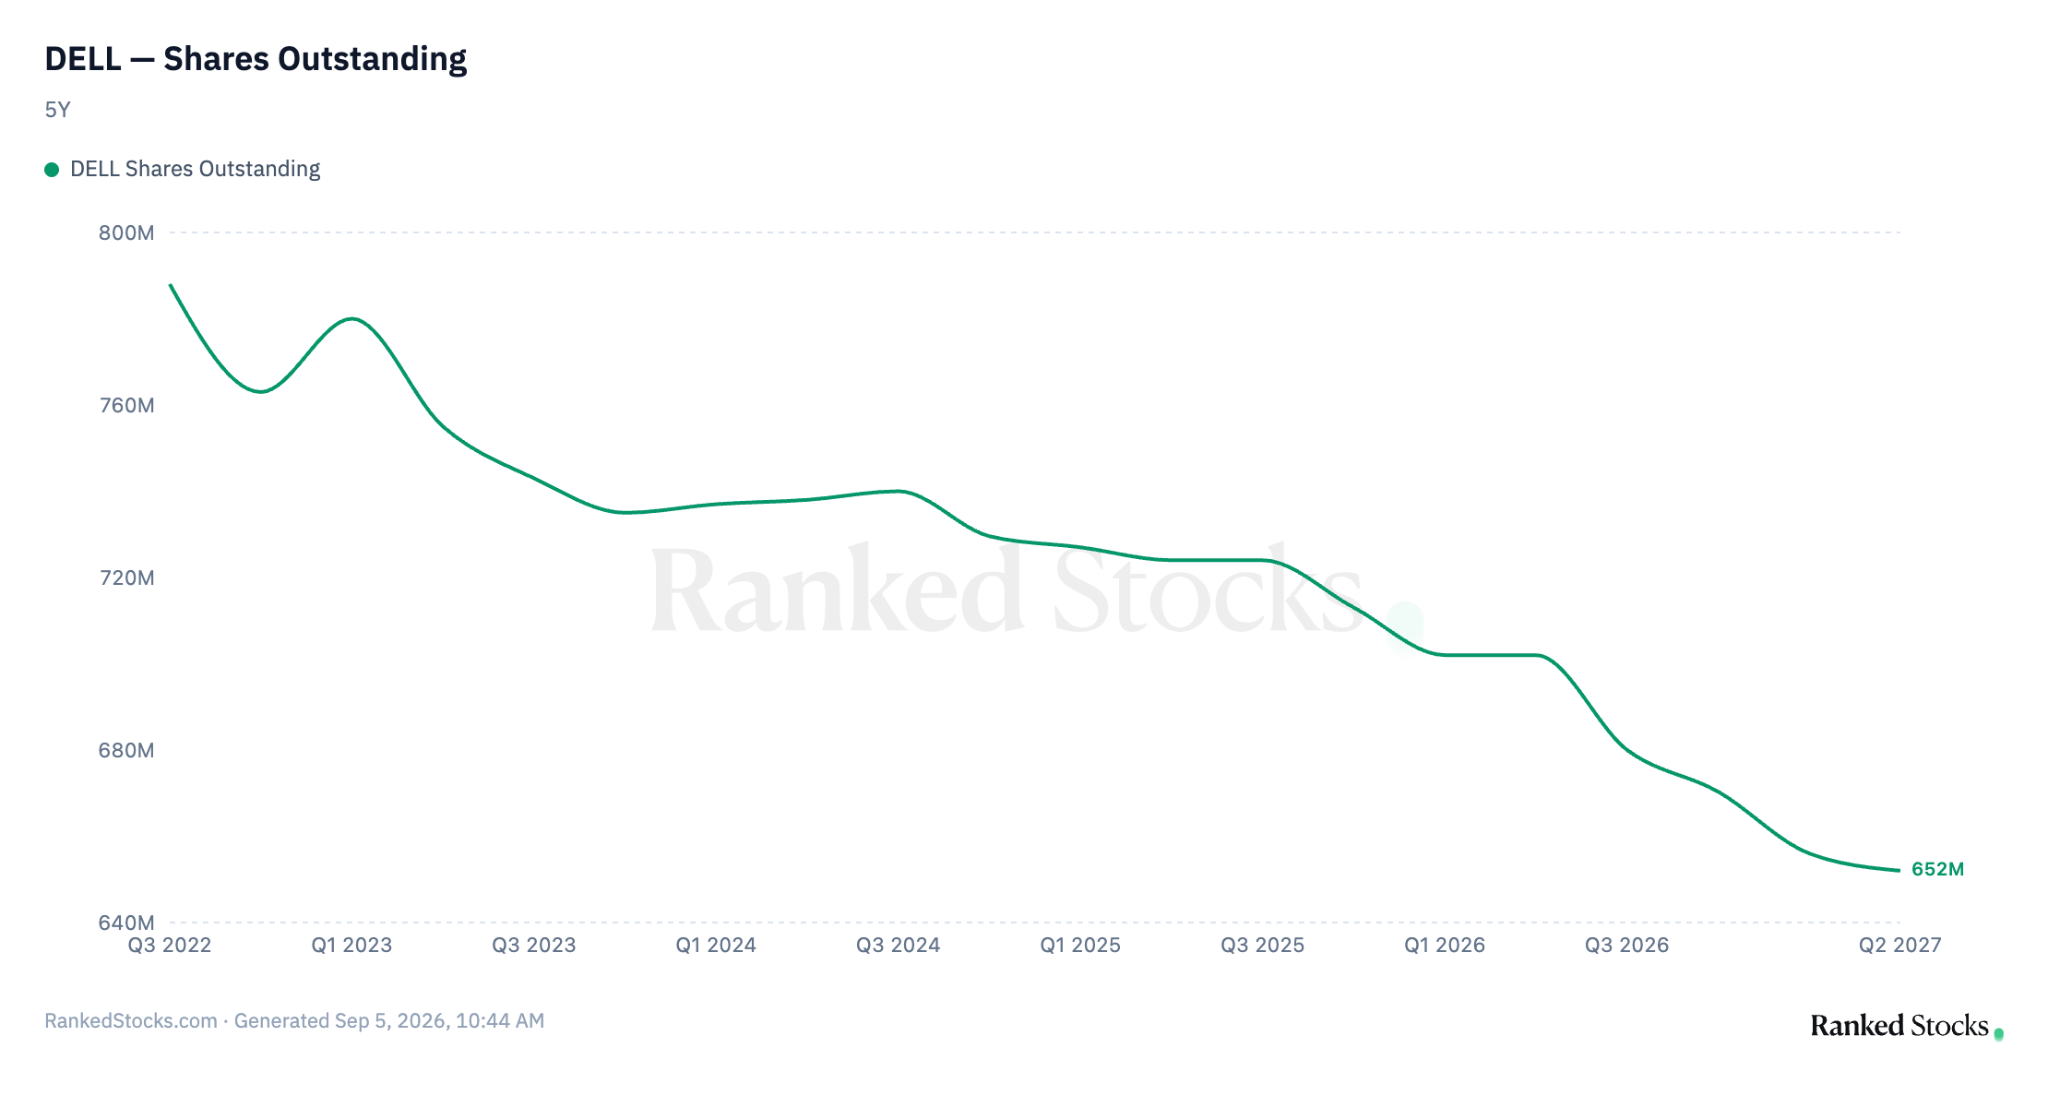
Assessment: The flywheel keeps turning, and this is where the asymmetry shows. In February the setup was $123 against a $206 model. In June it was $421 against $639 and a $325 bear, a risk and reward of 1 to 2.3. Today it is $524 against $601 and a $450 bear, so 1 to 1.
The quarter: records everywhere, and a margin I do not trust yet
Revenue grew 58% y/y and beat consensus by 5%. GAAP EPS grew 273% and non-GAAP EPS beat by 43%. Revenue, EPS, ISG, AI servers, traditional servers and commercial PCs all set records.
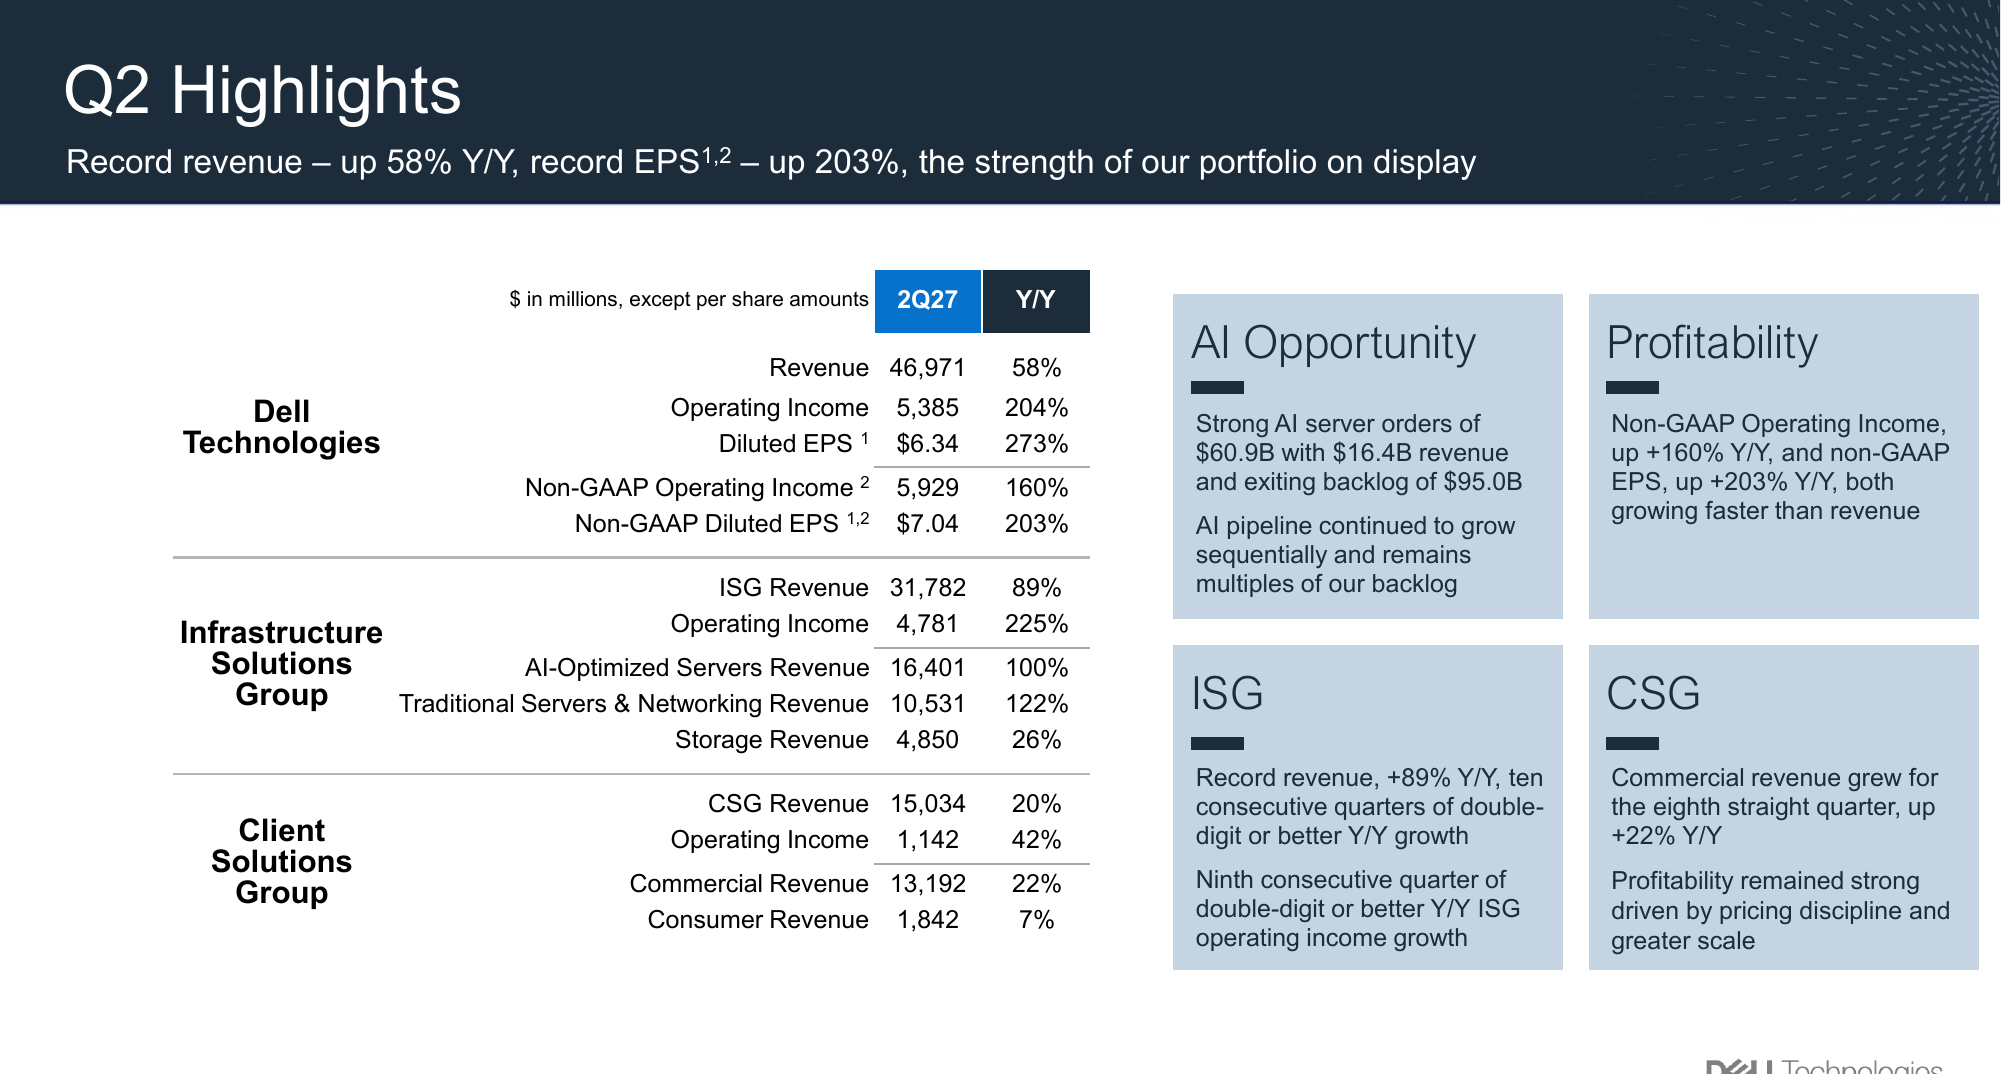
ISG did the work again, and this time the margin did too. ISG revenue grew 89% and operating income grew 225%, so the segment margin went from 8.8% a year ago and 10.5% in Q1 to 15.0%. AI-server revenue was almost flat sequentially, so the extra $1.7B of ISG profit came from the other two lines and from price. Storage carried the mix and scale carried the rest.
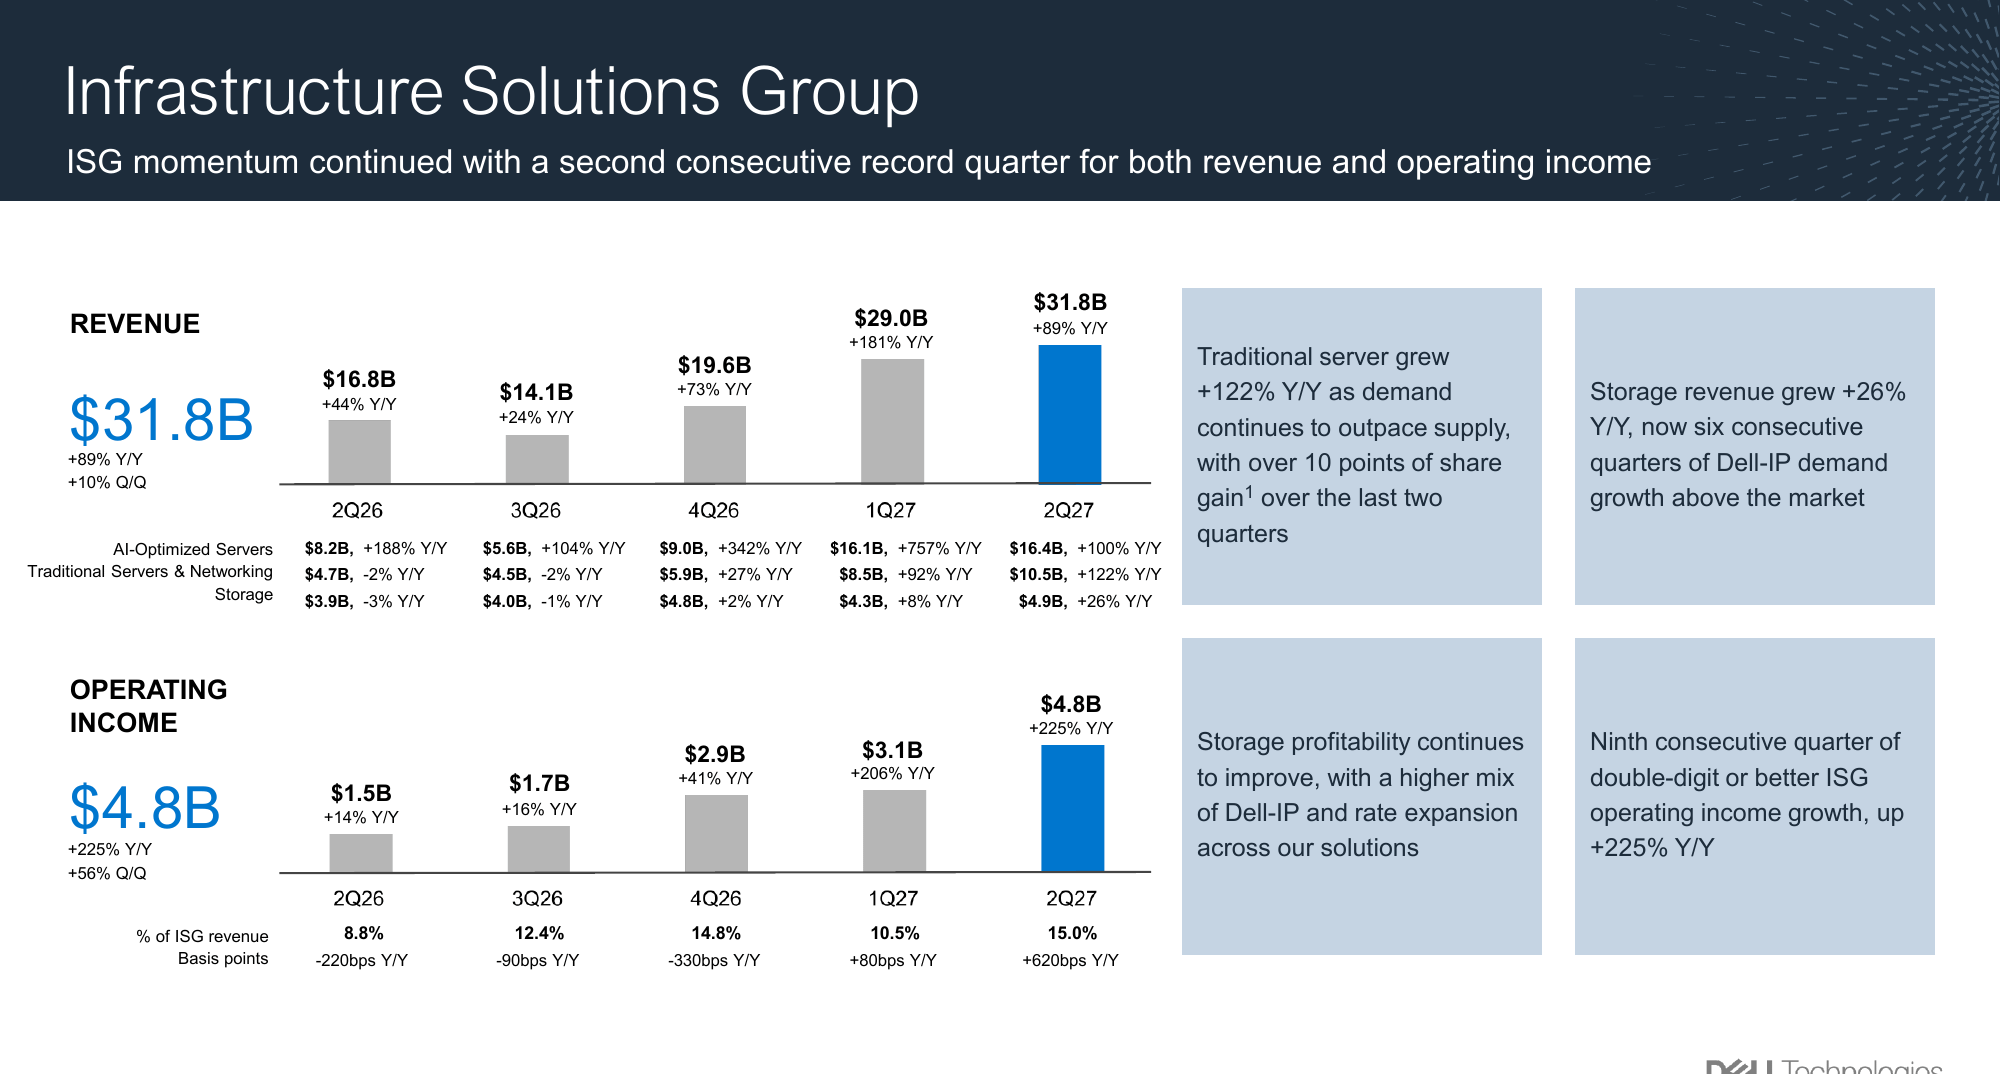
The CFO told you not to extrapolate it. His words on the call were that a number of factors came together and went the company’s way, and that not every benefit will continue at this level. The guide backs him up: Q3 ISG margin is guided up just over a point y/y, which is 13.5% against the 15.0% just printed, and CSG margin is guided down from 7.6% to 6%. Part of the Q2 margin is price discipline in a market where demand exceeds supply, and that condition has an expiry date.
AI orders were the headline; AI revenue was the quiet number. Orders of $60.9B against revenue of $16.4B means DELL booked 3.7 quarters of AI revenue in one quarter. Management is explicit that the constraint is supply: DRAM first, then NAND, then spotty CPU and disk shortages, and on down to substrates and optics. The Q3 AI guide of $19B says the constraint is loosening slowly.
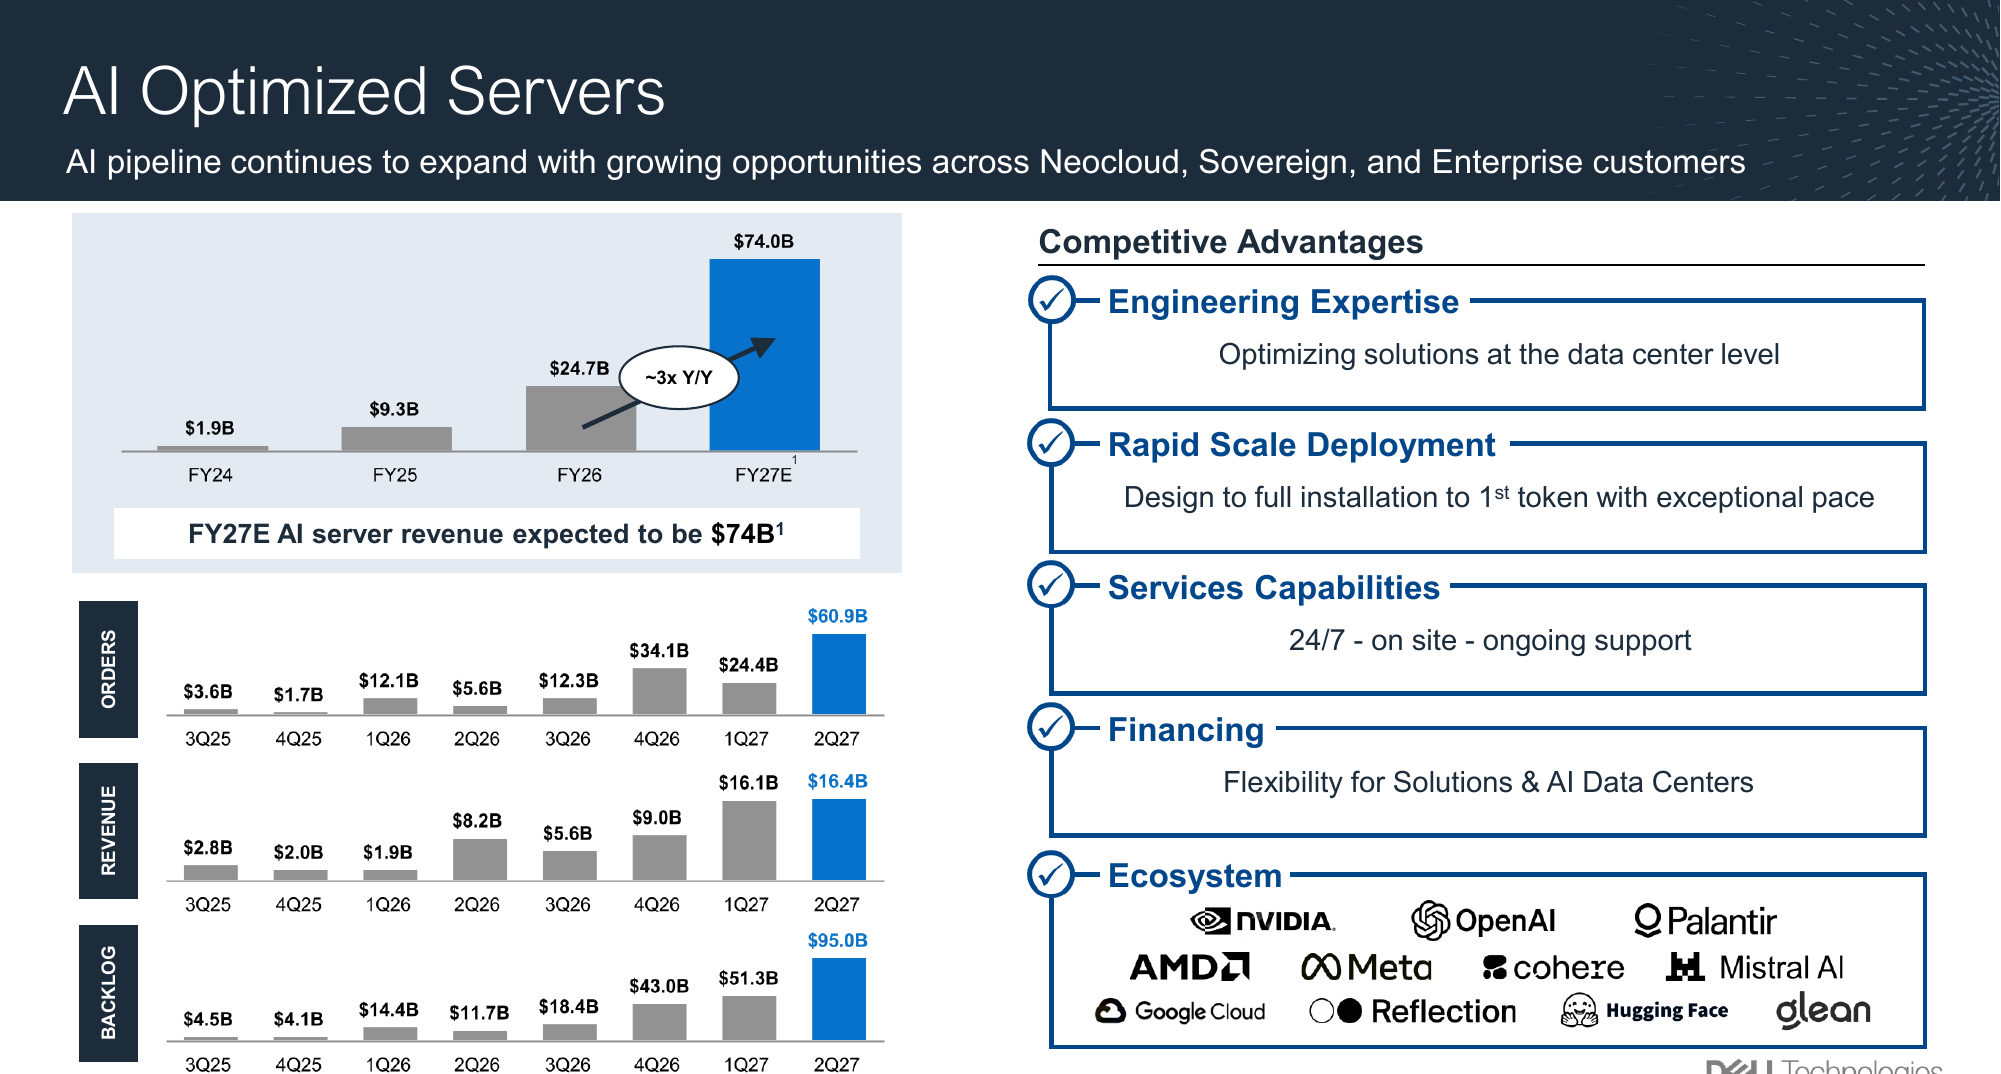
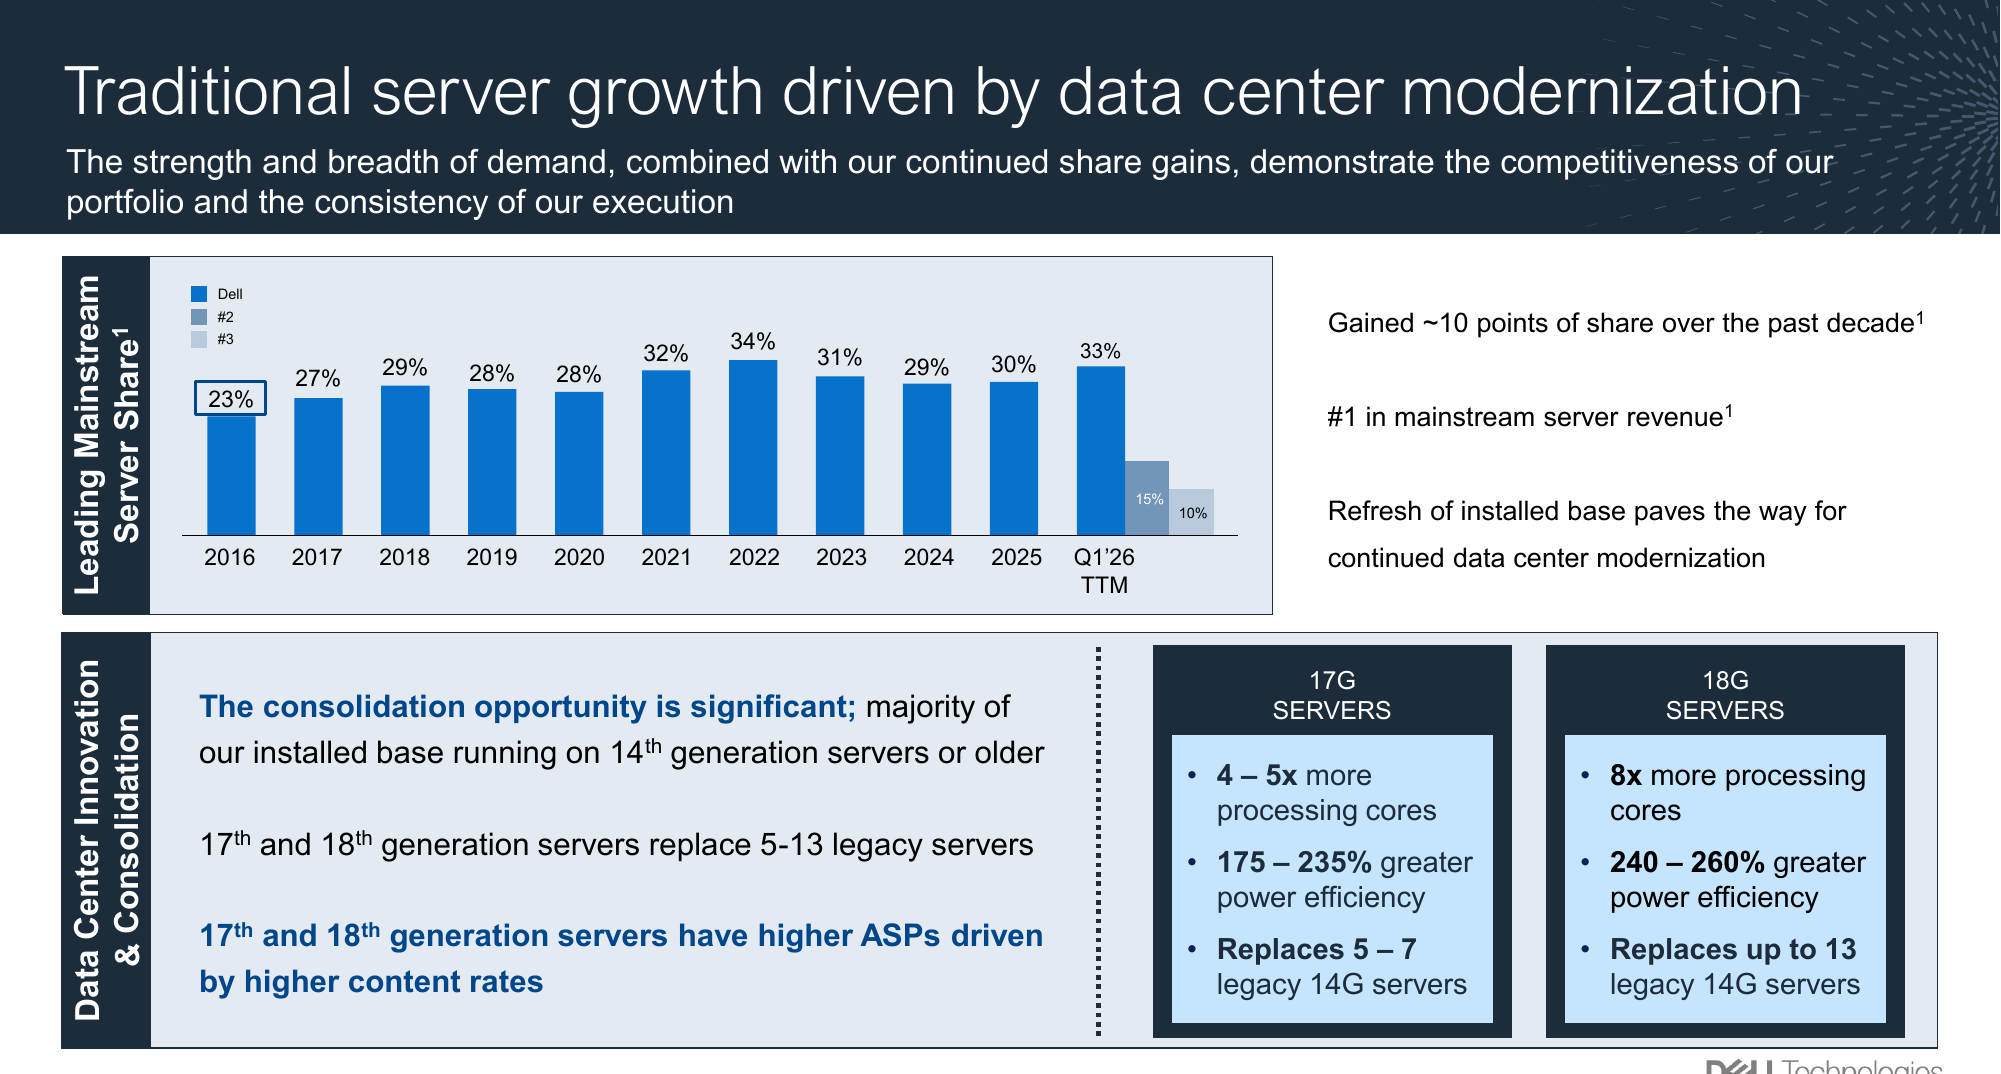
Traditional servers grew faster than AI servers, and part of that is inflation. The 122% growth is real demand from the 14G refresh, from agentic workloads that need CPUs, and from security requirements such as post-quantum cryptography forcing old hardware out. It is also higher prices: a 17G server carries more cores, more DRAM and more storage than the box it replaces, and each of those costs more than it did two quarters ago. Management does not split units from price, so neither can I. I model traditional servers at +10% next year for that reason.
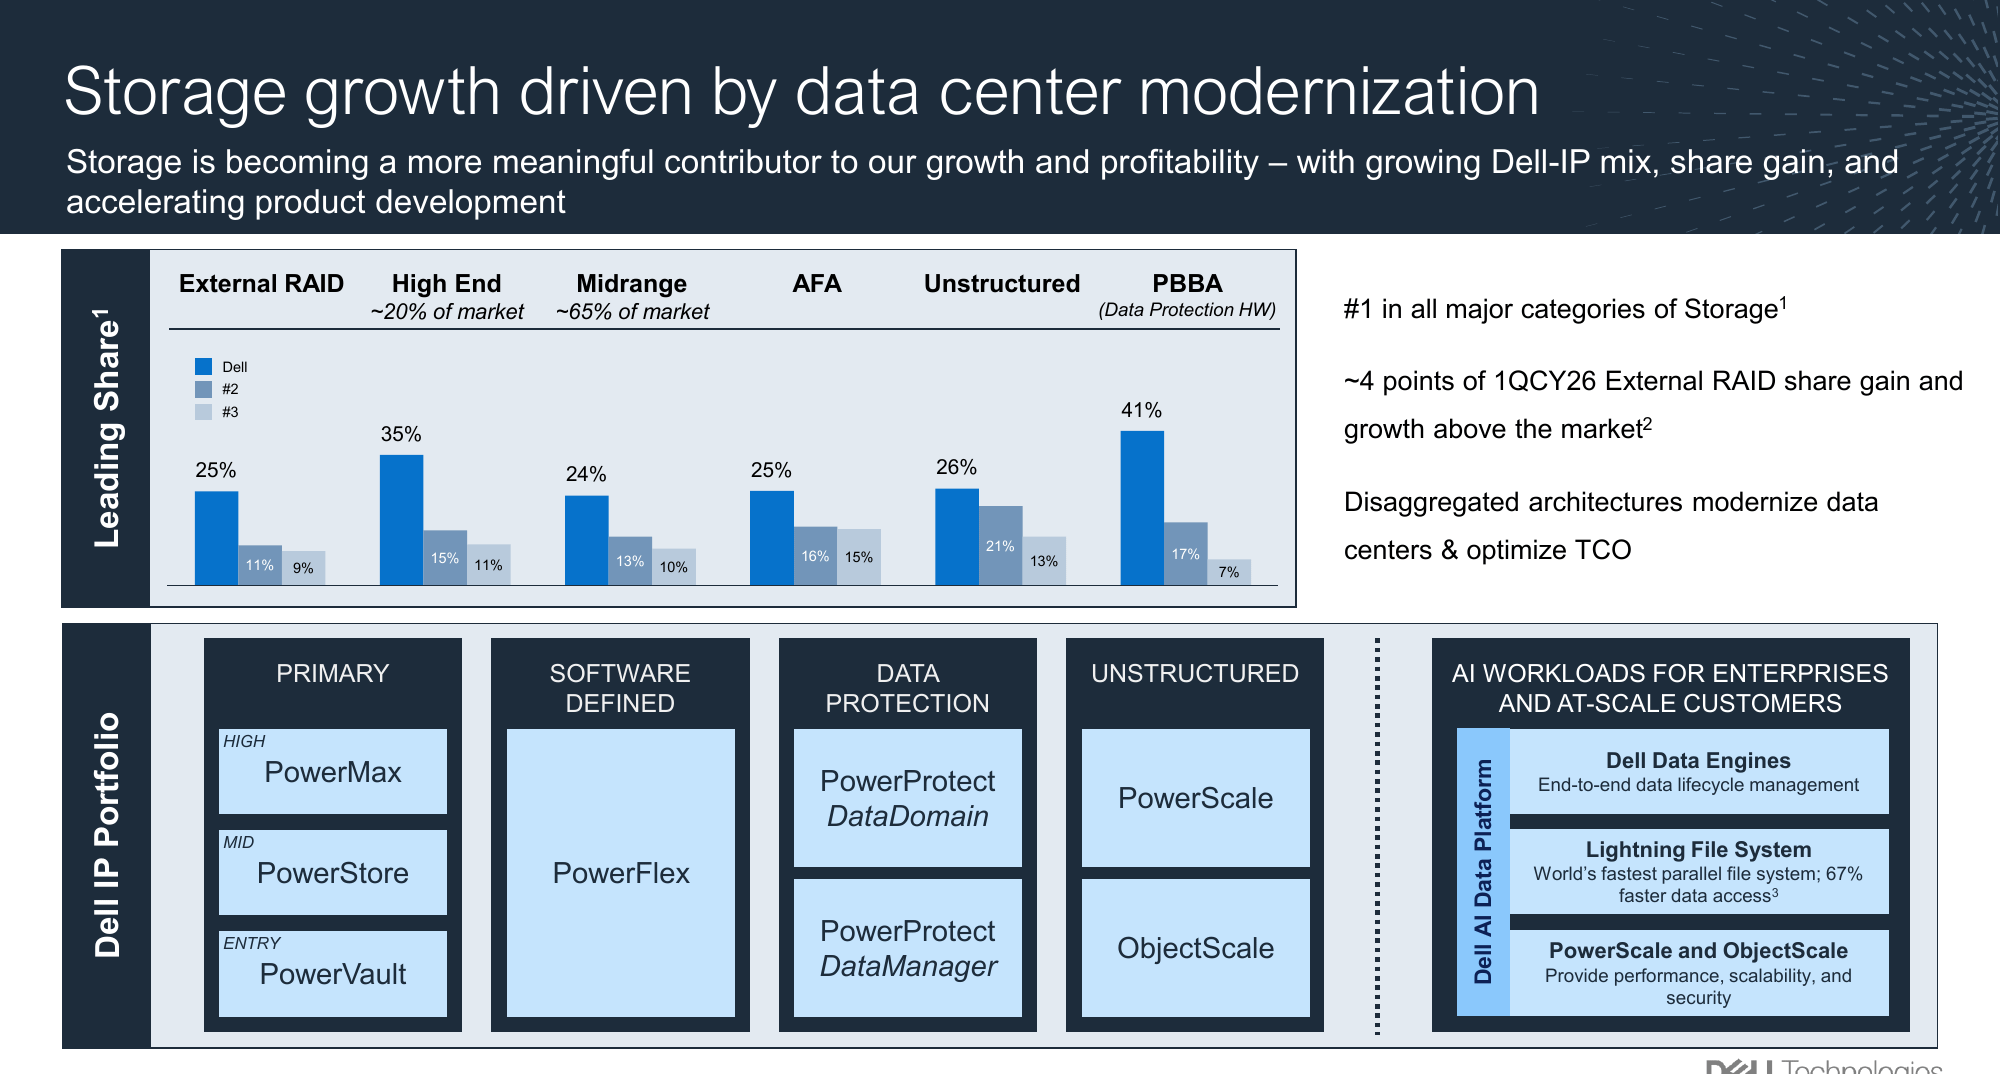
Storage is the pillar-three proof. Revenue grew 26% to a Q2 record and management expects more than $2.5B of incremental storage revenue this year, most of it Dell-IP at a higher margin than the partner products it replaces. Agents create logs, traces and files that have to be retained, and inference needs KV cache. This is the line that turns an AI-server sale into an AI-infrastructure relationship.
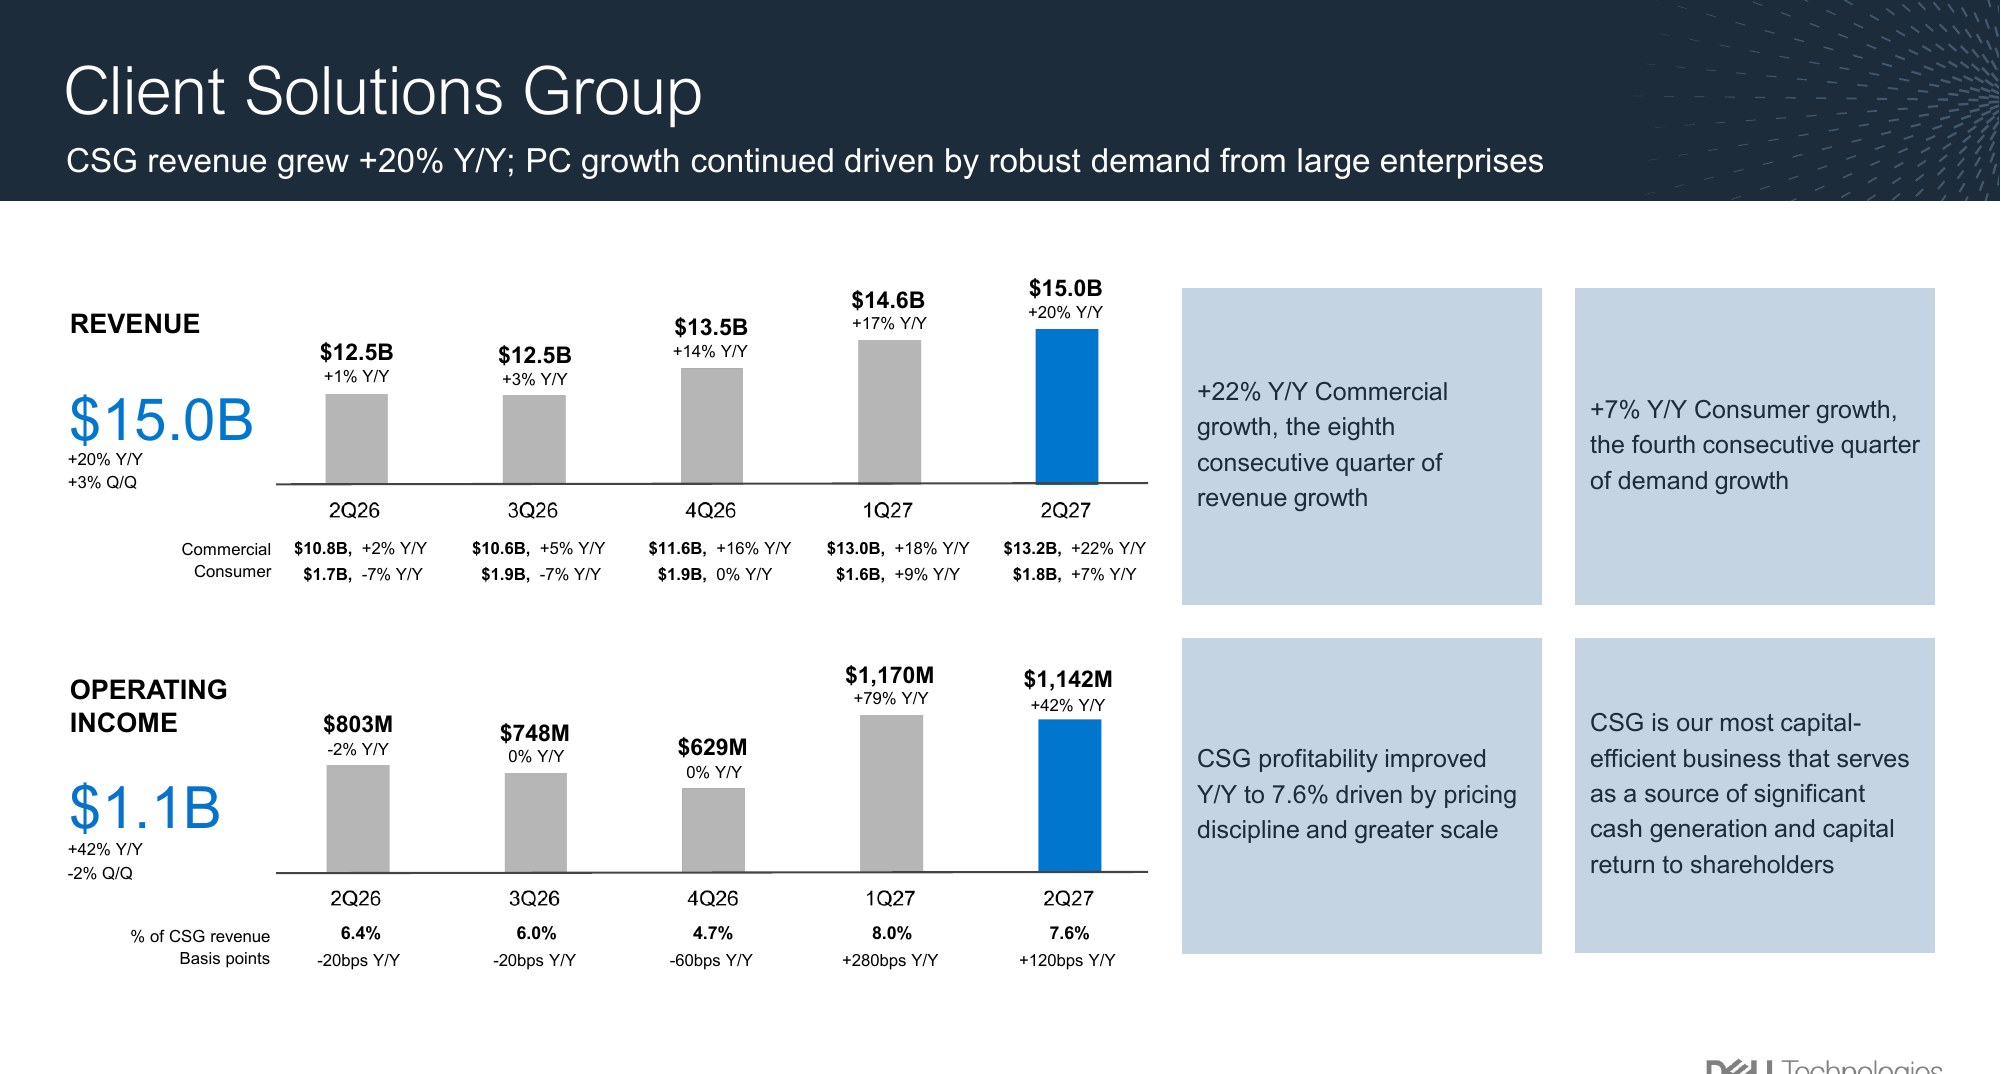
PCs grew 20% and are about to slow. Commercial grew 22%, its eighth straight quarter of growth, and CSG margin was 7.6%. Management said cost-sensitive customers are stretching their upgrade cycles, that units are likely down in the second half, and that it shifted memory allocation from PCs to infrastructure earlier this year because that is where the margin is. CSG is guided to grow 15% in Q3 at a 6% margin.
Guidance: then vs. now
Three months after raising the year by $27B, management raised it by another $25B. The full-year number has moved from $140B in February to $192B in September.
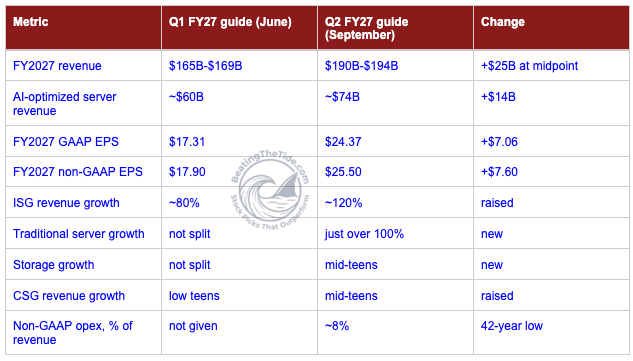
On credibility: three prints in a row of guide, beat by a wide margin, raise. The February guide was $52B too low for the year. Consensus went into Q2 expecting $18.92 of FY2027 EPS and came out with a guide of $25.50.
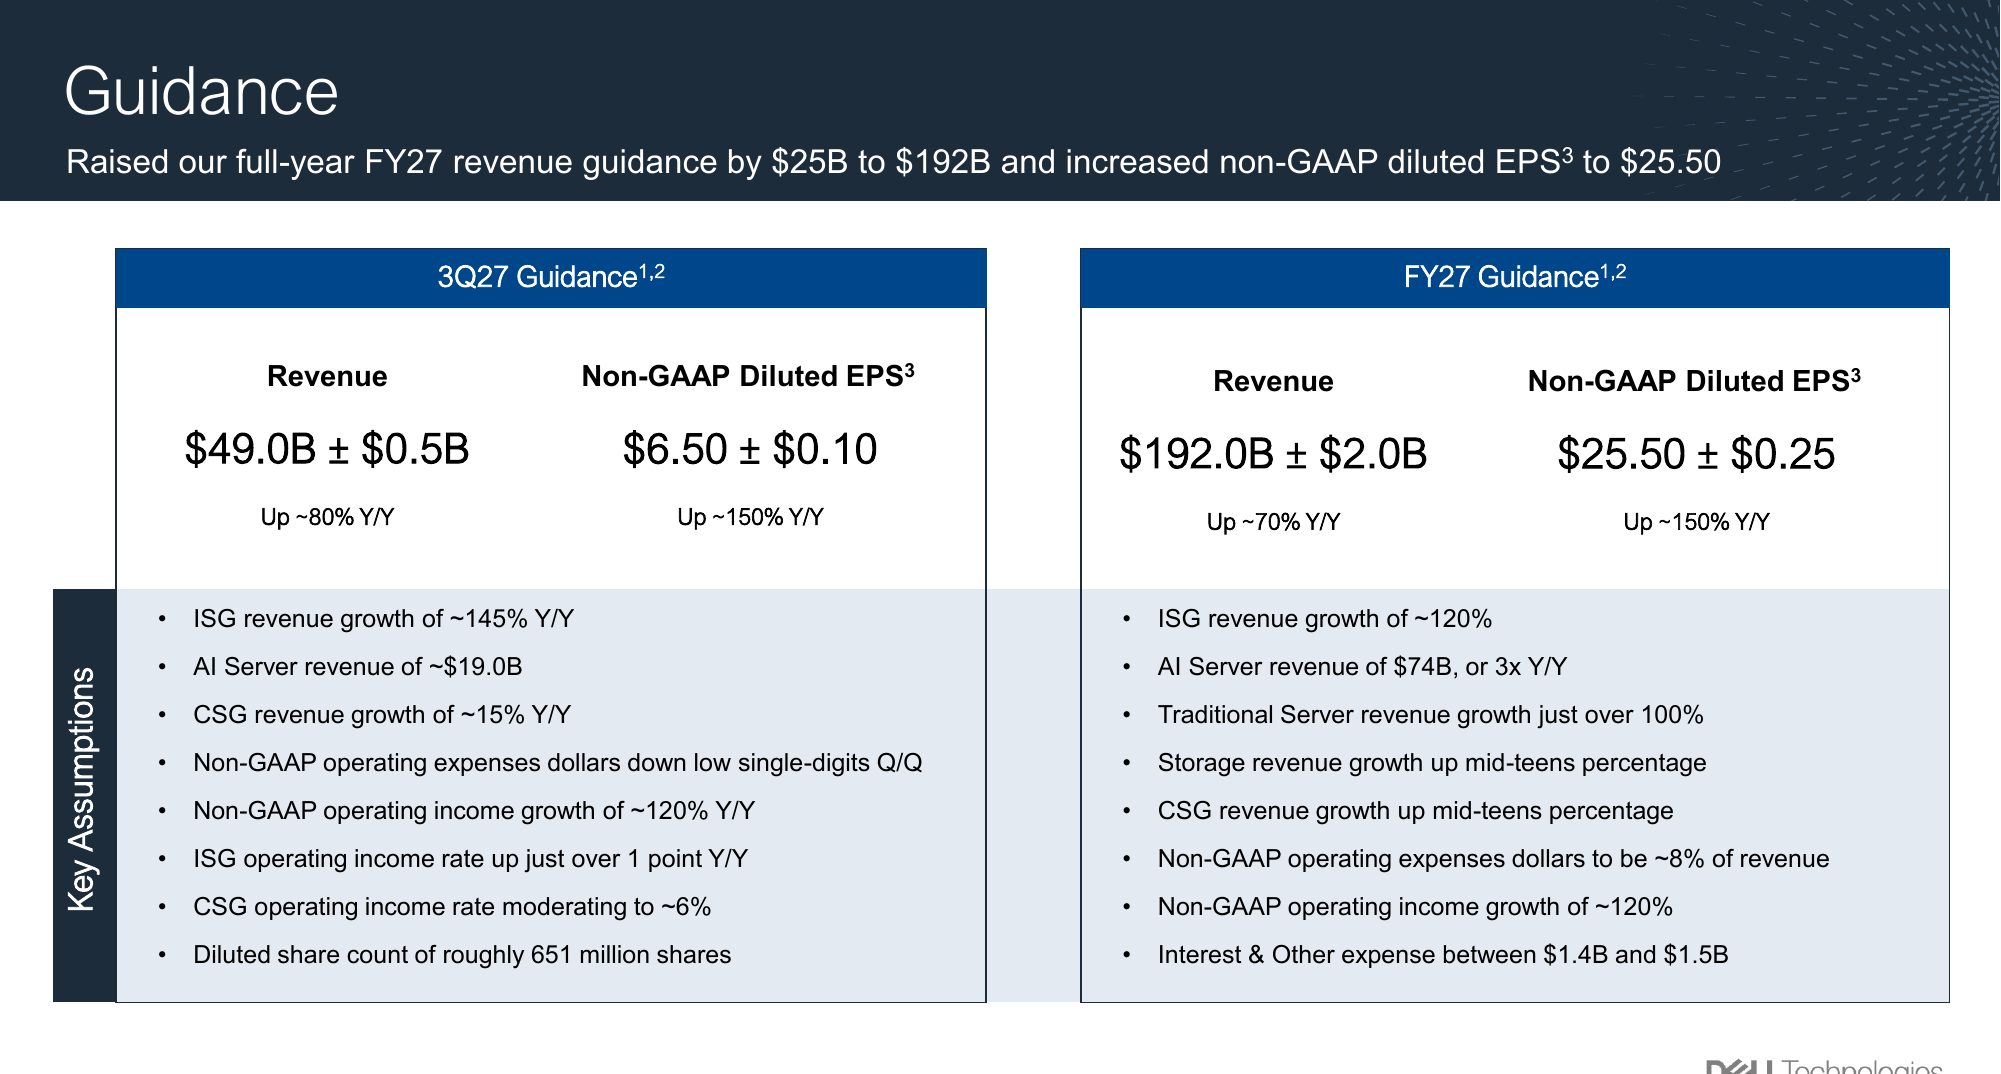
Management has earned the right to be believed on the year. The problem for the stock is the opposite one: the pattern is now so well established that Mr. Market prices the next raise before it happens, which is why the shares went from $425 to $524 in three sessions on a guide that was already supply-constrained.
The bear case I am now weighting
There is no moat, and the AI cycle has not created one. DELL’s edge is scale, brand, distribution, deployment and a supply chain nobody can copy quickly. None of those protect price. Servers and PCs use the same components from the same suppliers and are assembled by the same ODMs, so competition lands on price and service. In AI servers the value accrues to the chip designer and increasingly to the memory makers (that is one reason that MU 0.00%↑ is my top pick for 2026)…

… while the tier-one hyperscalers buy directly from the ODMs and skip the OEM entirely. DELL wins with neoclouds, sovereigns and enterprises because they need the engineering and the financing, and those are exactly the customers that pay for it least reliably. I wrote in February that the best operator wins in a commodity market. That is still true. It is a claim about returns on capital, and it says nothing about the multiple.
The margin you just saw is closer to a peak than a base. ISG went from 8.8% to 15.0% in four quarters. Over 400 basis points of that is scale, which reverses when growth does. Some of it is pricing power in a supply-constrained market, which reverses when supply catches up, and the first read of 2027 supply guidance has server DRAM bits growing 15-20%, a shortage easing rather than ending (TrendForce). Management’s own long-term framework tops out at 14% for ISG. The bull case needs the top of that range to hold while the AI mix, the lowest-margin line in the segment, keeps growing faster than everything else.
FY2028 is a digestion year until proven otherwise. AI-server revenue triples this year. The Street models FY2028 EPS down 4% and the most careful outside models I have read have FY2028 revenue flat to down. The $95B backlog covers next year’s AI number on paper. When supply loosens, the double ordering shows up as cancellations and slipped deliveries, and DELL has already lived that cycle once, in PCs in 2022.
The cash is arriving later than the earnings. Net income grew 255% and operating cash flow fell 13%. Over the last four quarters DELL generated $12.2B of operating cash flow and reported $18.1B of adjusted FCF, and the difference is receivables DELL owns and leases DELL carries. Adjusted FCF is a legitimate way to look at a captive finance business, and it is also the number that funds capital returns that ran at twice operating cash flow this quarter.
And then there is the PC business. Half of revenue two years ago, a third today, and structurally a low-single-digit grower once the Windows 11 refresh passes. If the AI cycle disappoints, this is the business the multiple falls back on, and it is a 6% margin business that management just told you is losing units.
Put those together and you get a company that is executing better than at any point in its history, in a market that is growing faster than any it has ever served, at a price that assumes both continue. I agree with every part of that sentence. Having said that, I now think the fair price for it is close to the current one.
Valuation: from $639 to $601, and the bear from $325 to $450
You can view the full model here.
My DCF base case moves to $601. At $524 that is +15% of upside. The bear moves to $450, or -14%. Risk and reward is 1 to 1.0.

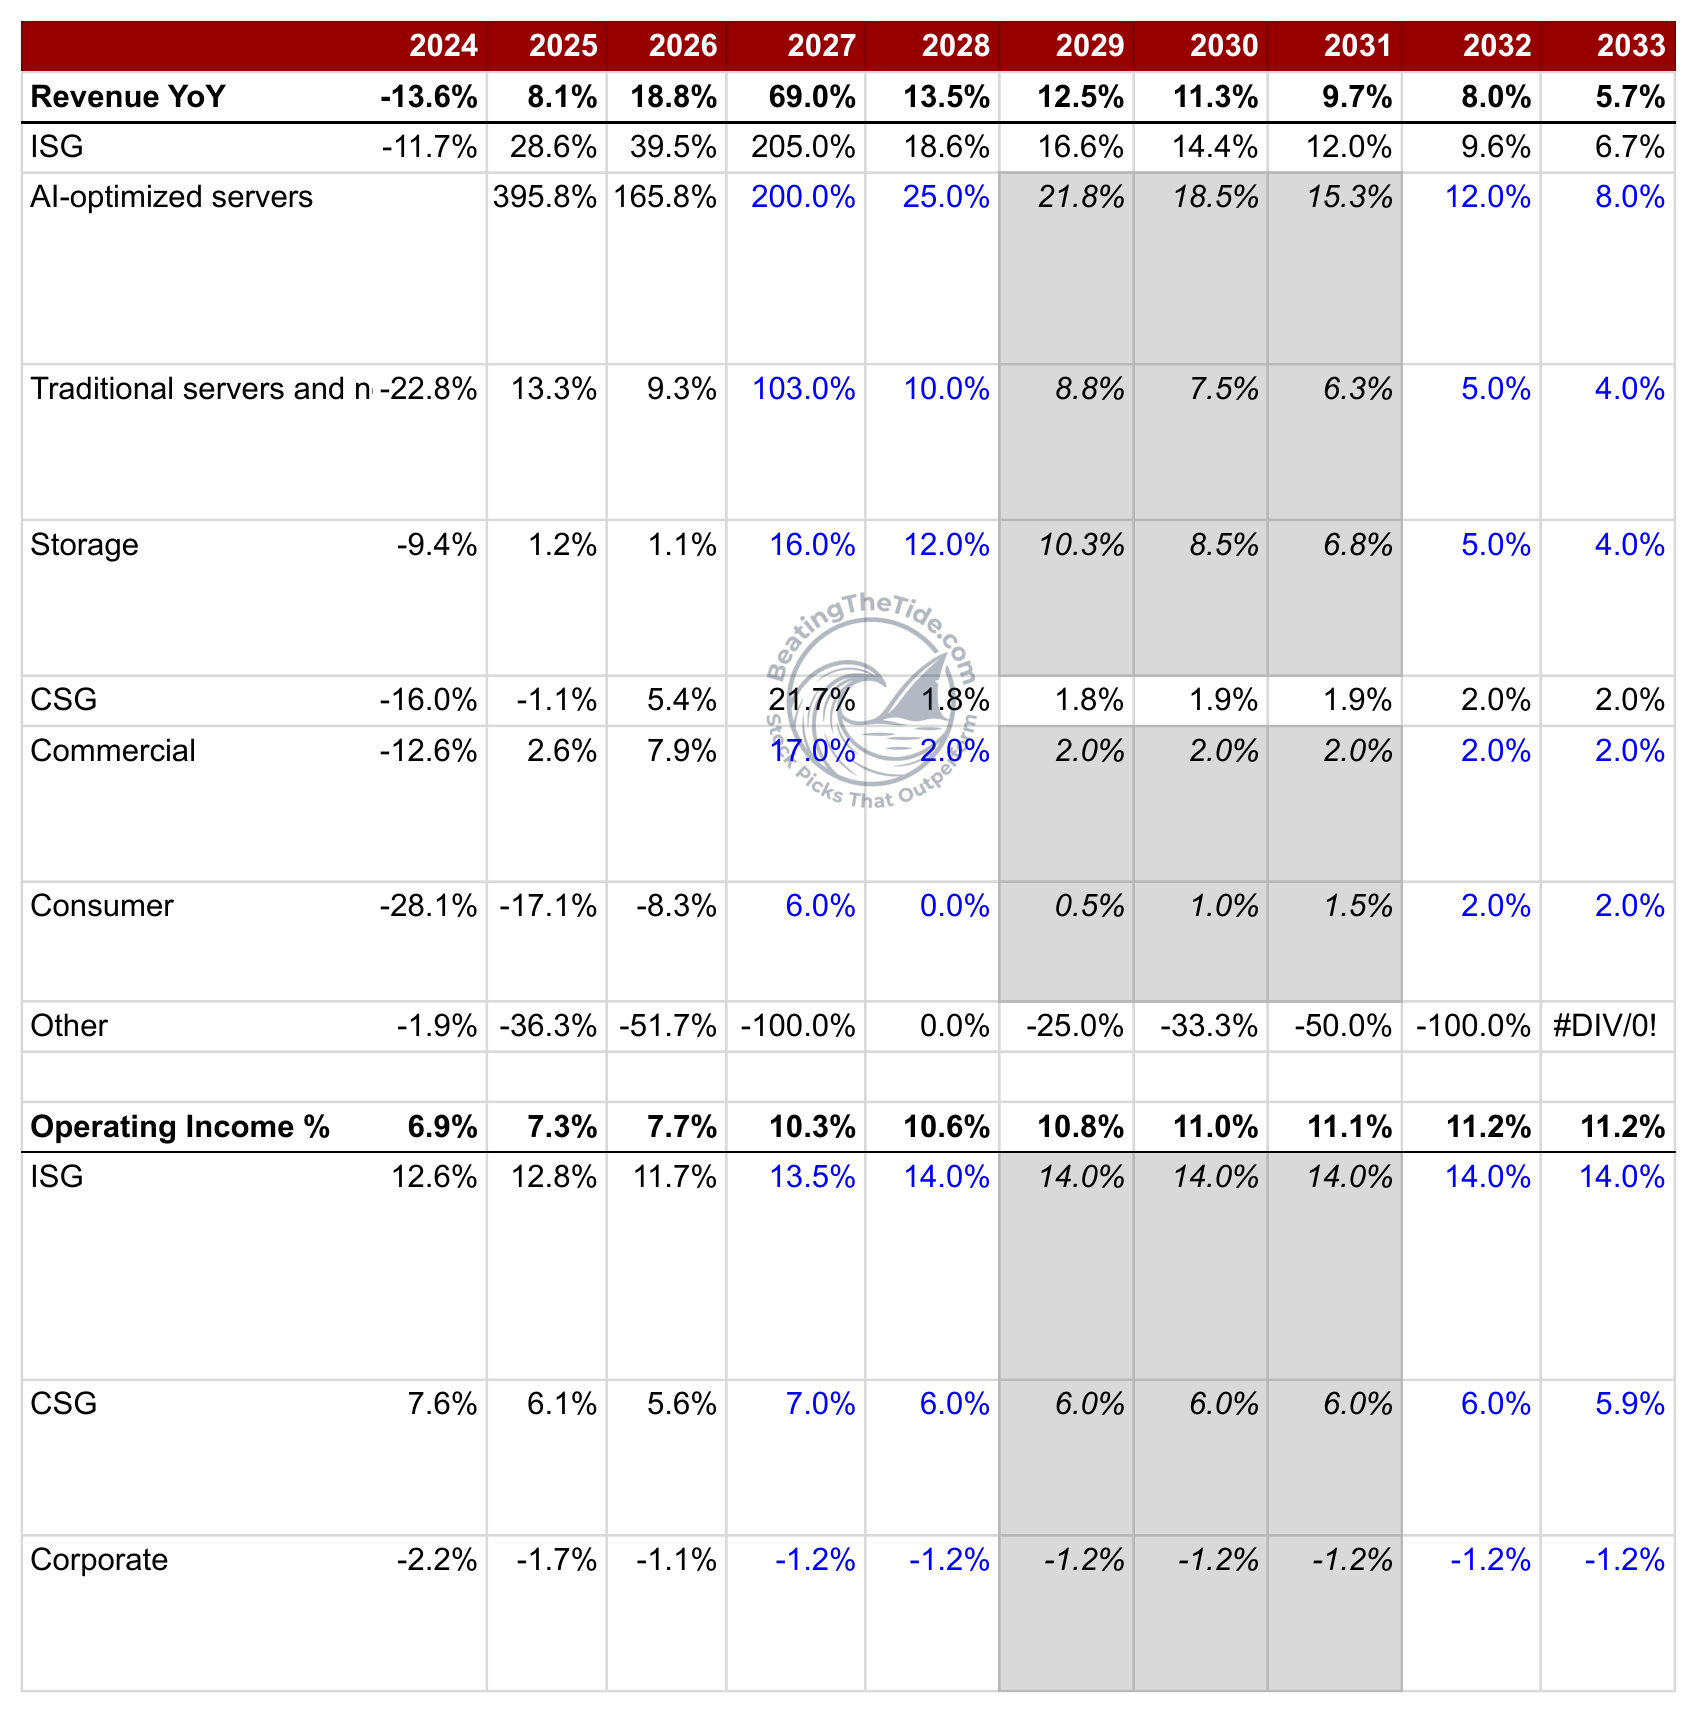
The target fell even though the year went up. FY2027 in the model now sits at the guide: $191.8B of revenue, AI servers at $74B, traditional servers up 103%, storage up 16%, commercial PCs up 17%, and a 10.3% operating margin against the 10.7% the GAAP EPS guide implies. Every one of those inputs went up from June, and on their own they would have pushed the target up.
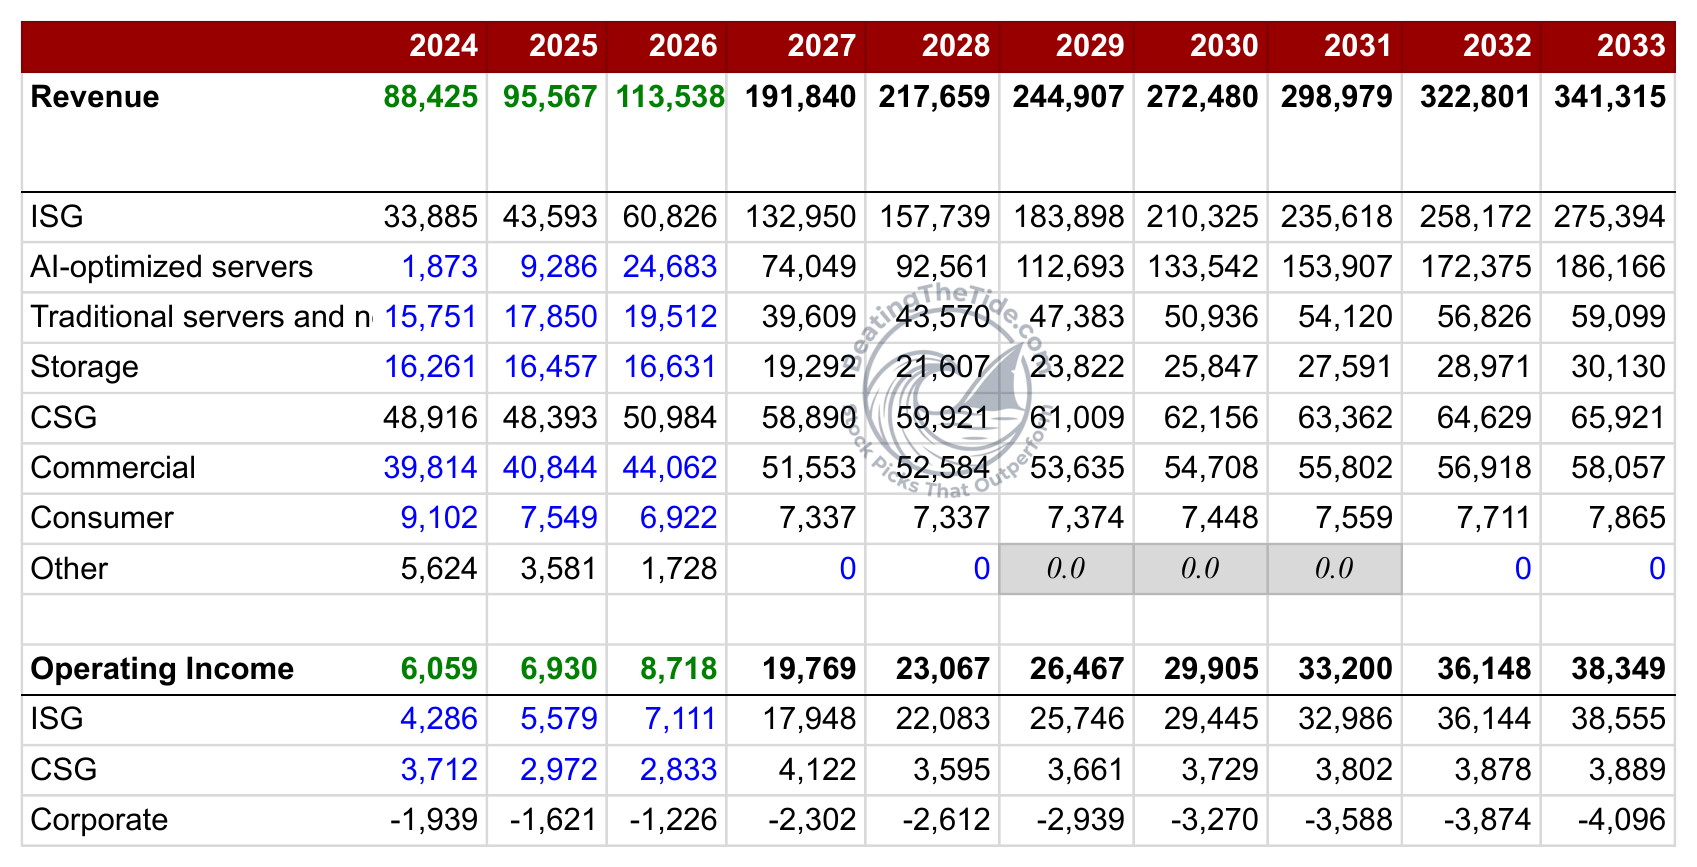
What went down is everything after FY2027. In June the model compounded revenue at 26% a year through FY2029 and reached $384B by FY2031. That was a model built on a demand wave with no digestion in it. The new path grows 13.5% in FY2028, with AI servers at +25% because the backlog already covers it, decelerates to 10% by FY2031 and 8% by FY2032, and fades to 2.5% by FY2038. FY2031 revenue is $299B rather than $384B, a five-year CAGR of 21% against 28% before. I also moved ISG margin up, to 13.5% this year and 14.0% after, the top of management’s framework, because the storage mix and the scale are real, and I hold the AI-server line at mid-single-digit margins inside that. CSG goes to 6%, where the CFO put it. The consolidated margin reaches 11% by FY2031. Less revenue at a higher margin nets out to $38 a share less than in June.
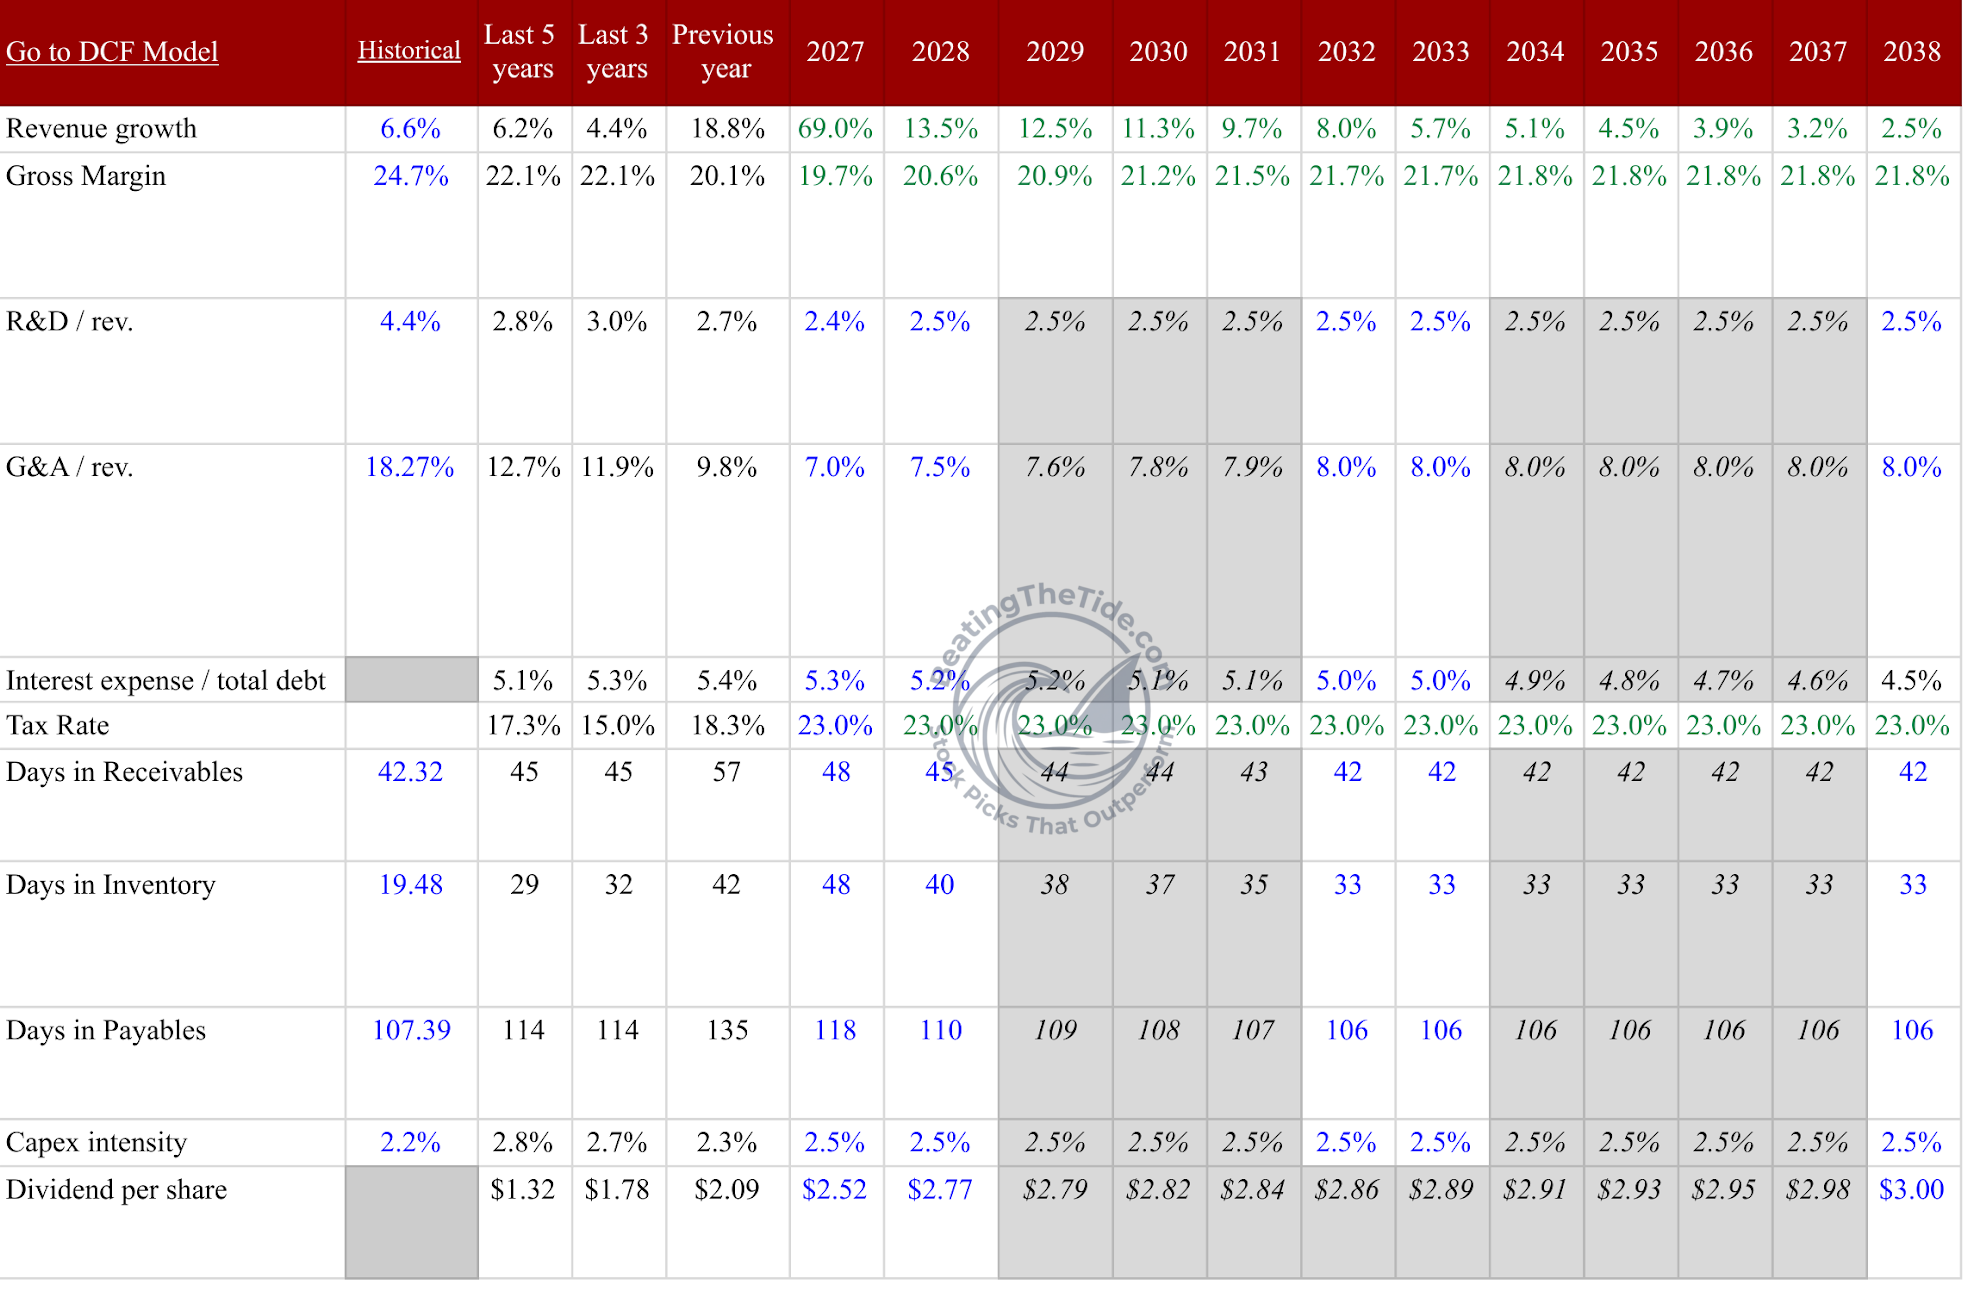
WACC stays at 9% and the tax rate stays at 23%, above the 18% DELL pays, so the target is conservative on the discount rate and the tax line and generous on margin. I think that is the right shape of conservatism for a business at this point in its cycle.
At $524 the market values DELL at 21x this year’s non-GAAP EPS guide and, because the Street has FY2028 EPS falling, 21x next year’s too. Run the model backwards and the current price discounts my cash flows at 8.6% instead of 9%, or, holding the discount rate, it needs FCF to compound at 13% a year for ten years from FY2026’s $8.6B. Both are achievable. Neither leaves a margin of safety, and in February the same exercise gave me a price that implied an AI slowdown that was not happening. That was the mispricing. It has closed.
That is also why the bear moved. My June bear of $325 assumed AI-server margins stuck while a digestion air pocket hit a $51B backlog. The backlog is now $95B, the balance sheet has $14.2B of cash at 0.8x leverage, and the company just earned $7.04 in a quarter. A $450 bear is 18x a FY2028 non-GAAP EPS of $25, which is the Street’s digestion case, and 18x is where the stock traded after hours on the night of the print. It is the realistic bad year rather than the catastrophic one. The shape is a $601 base, a $450 bear and a $524 price, so 1 to 1.0. In June it was 1 to 2.3.
Risk register, updated
Strongest risk first.
First, the cash conversion gap has moved from the footnotes to the top of the list. This is new. In June every risk was about margins or demand. Now the machine that funds the payouts is lending to its own customers at a $30B annual run rate, and capital returns are running at twice operating cash flow. If a large neocloud stumbles, DELL owns the receivable and the inventory behind it. Management says the book is short-term and selective. The number that would end this risk is a quarter where operating cash flow catches back up to net income.
Second, the memory super-cycle, unchanged and now guided into 2027. Server DRAM contract prices rose another 13-18% in Q3 and NAND 10-15%, and 2027 RDIMM bit supply is guided to grow only 15-20% against faster server unit growth (TrendForce).
Third, an AI digestion air pocket, unchanged but closer. After tripling, AI-server revenue has to grow off a $74B base. A pause at the neoclouds or a large sovereign deal slipping makes the backlog convert lumpier even if the long-run demand is intact, and the FY2028 guide in February is where it would show.
Fourth, AI-server margins that never improve, faded. Q2 showed ISG can print 15% with AI at half the segment. The attach in storage is real. This risk has not gone away, but it is smaller than it was, and I moved it down the list for the first time.
And then there is the price. At $524 DELL is no longer the obviously cheap operator it was at $123, or even at $421 in June. From here the stock needs the FY2028 guide, the ISG margin and the cash conversion all to come through.
Performance vs. the field
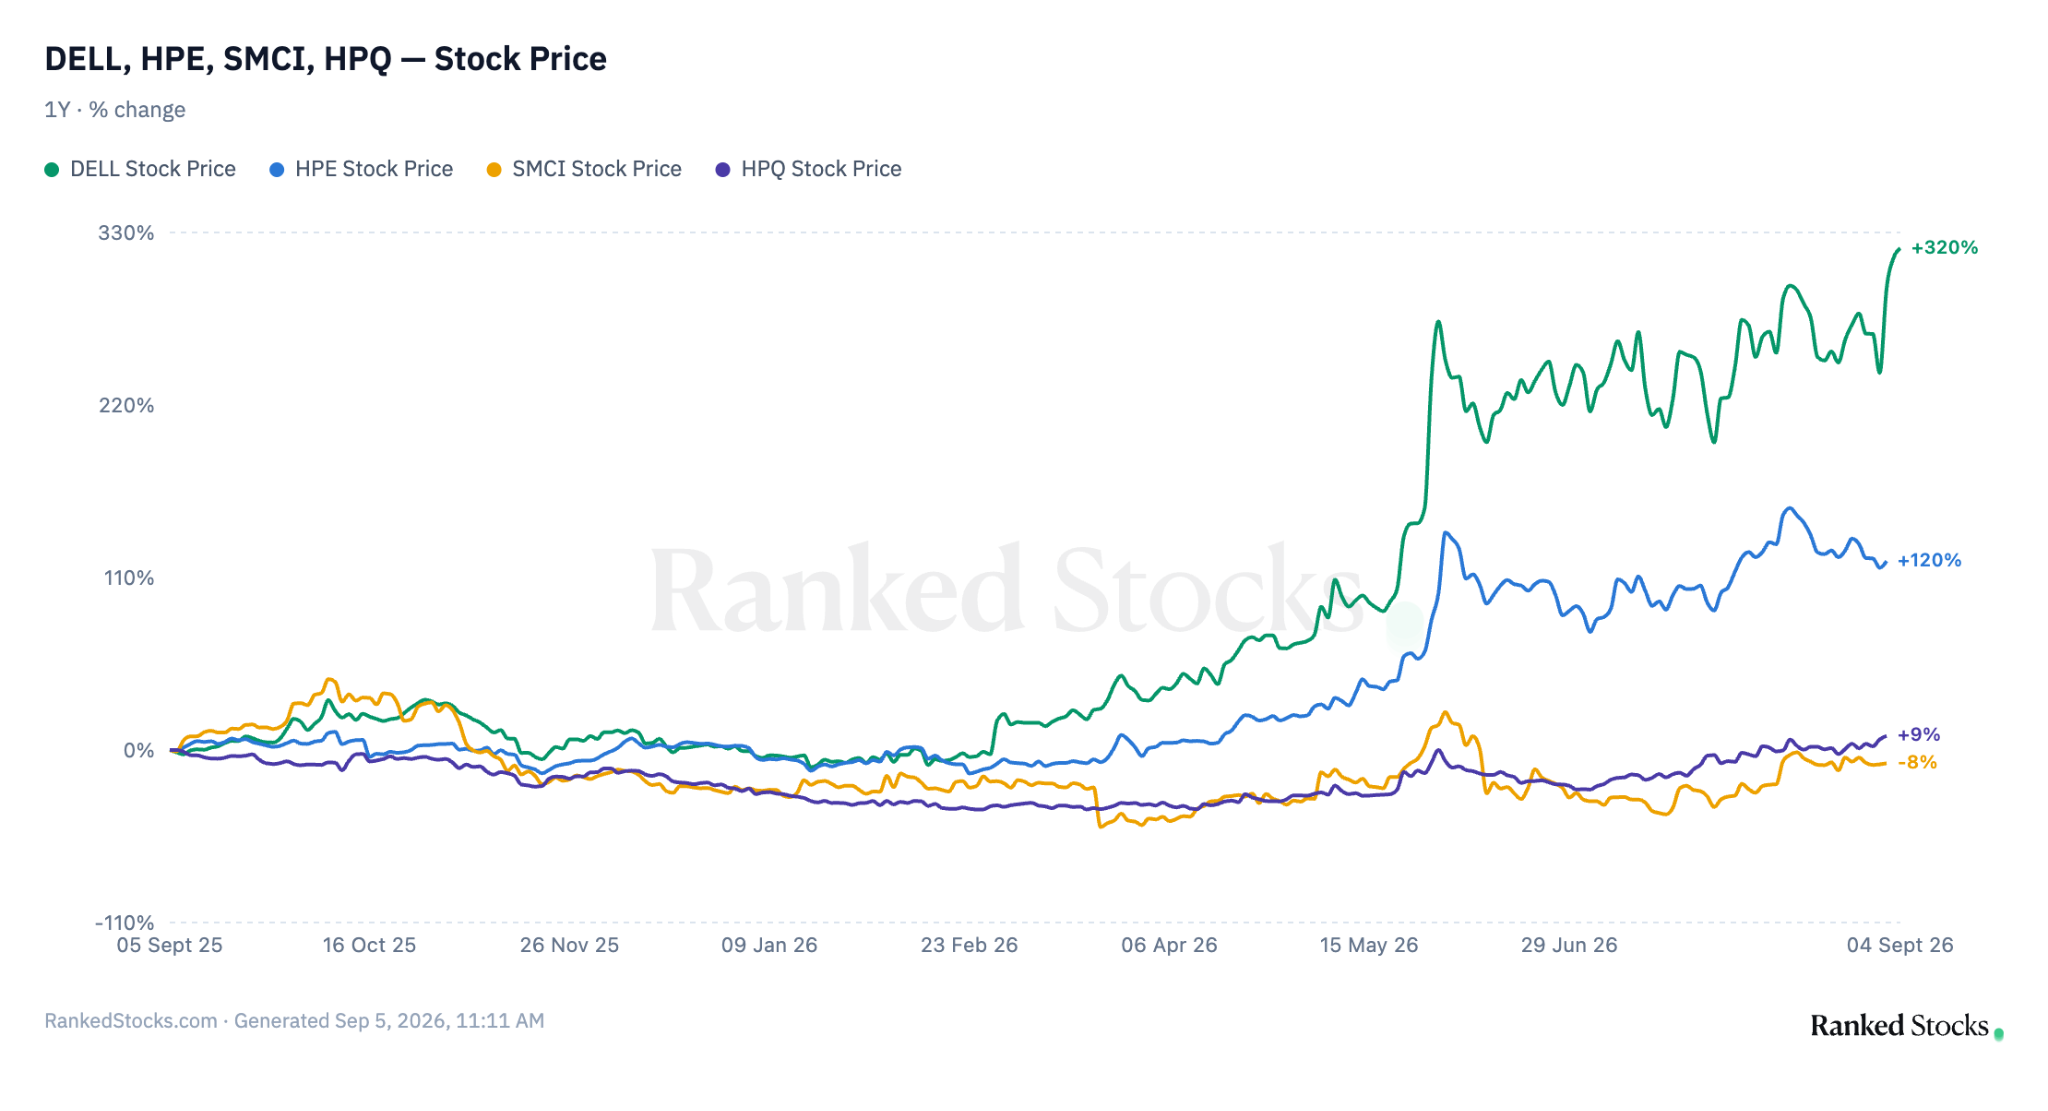
Over the last twelve months DELL has outrun every name it competes with by a wide margin. HPE, the credible number two in AI systems, is the only peer that kept any pace at all, on a networking-led story. HP Inc, the pure PC comparison, went nowhere, and Super Micro is down under a DOJ cloud, with DELL booking in one quarter the AI orders SMCI booked in its entire fiscal year. The relative performance says Mr. Market has fully found the AI-server story and has started paying for the storage and attach leg that was my edge in February. What is left to find is the FY2028 number, and the price already treats it as a coin flip.
Verdict
I am moving DELL from BUY to HOLD, with a $601 target and a $450 bear. The position stays in the portfolio at HOLD and it goes on my trim list: the risk and the reward are now the same size, and the upside that is left no longer defends the weight against a fresh idea.
In February I was paid to believe DELL could grow and earn through the AI build while Mr. Market doubted it. Today I am asked to believe DELL can keep growing and earning after the build, and Mr. Market has stopped doubting.
If you own it, hold it and let the FY2028 guide tell you what to do next.
Portfolio Update
We ended the week +2.1% vs. +0.1% for the S&P 500. Both spent Monday and Tuesday in the red, the portfolio deeper than the index, and the recovery started on Wednesday, the morning after DELL reported.
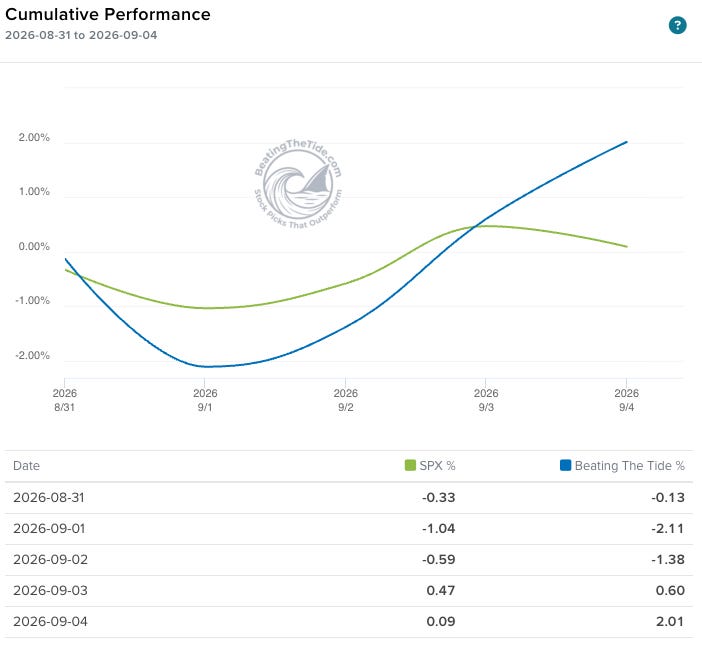
Portfolio Return
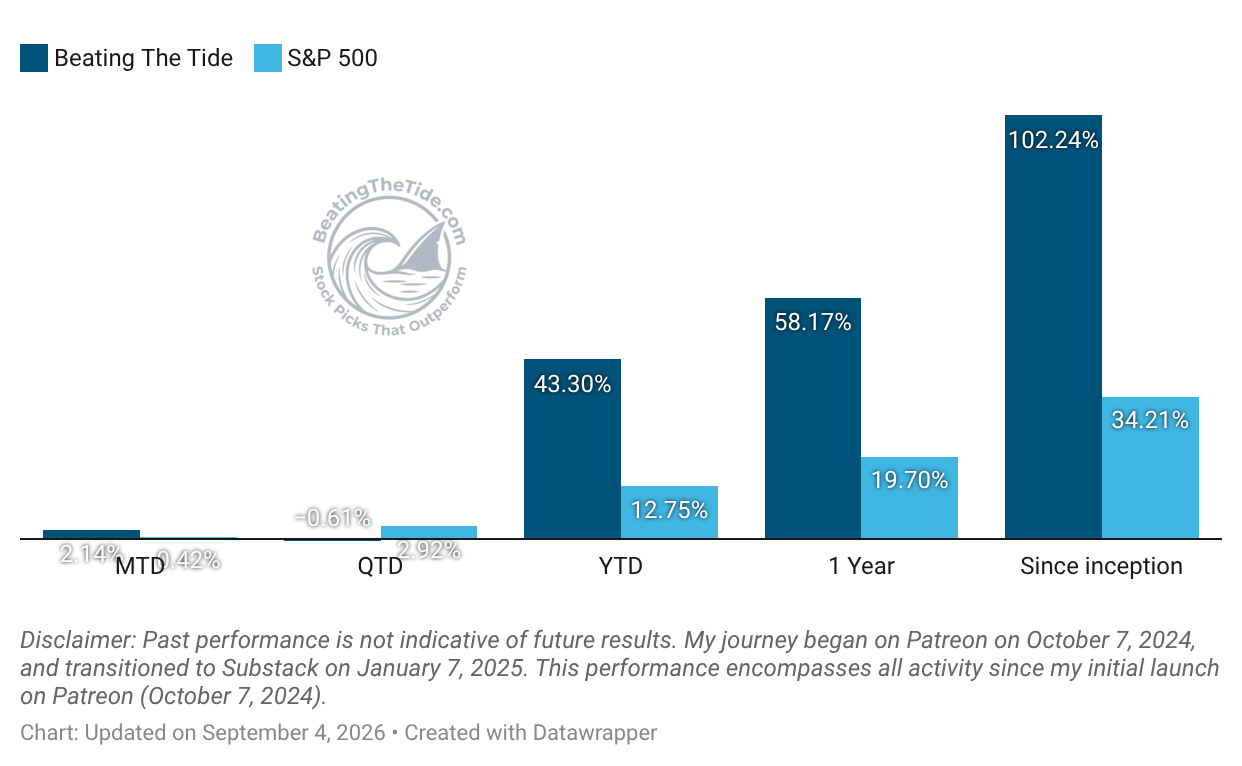
Month-to-date: +2.1% vs. the S&P 500’s +0.4%.
Year-to-date: +43.3% vs. the S&P 500’s +12.8%. That is a gap of 3,055 basis points.
Since inception: +102.2% vs. the S&P 500’s +34.2%. That’s 3.0x the market.
Contribution by Sector

Technology did the heavy lifting this week and Financials chipped in, with Energy a distant third. Consumer Cyclicals and Education were the only sectors in the red, and neither cost more than a handful of basis points.
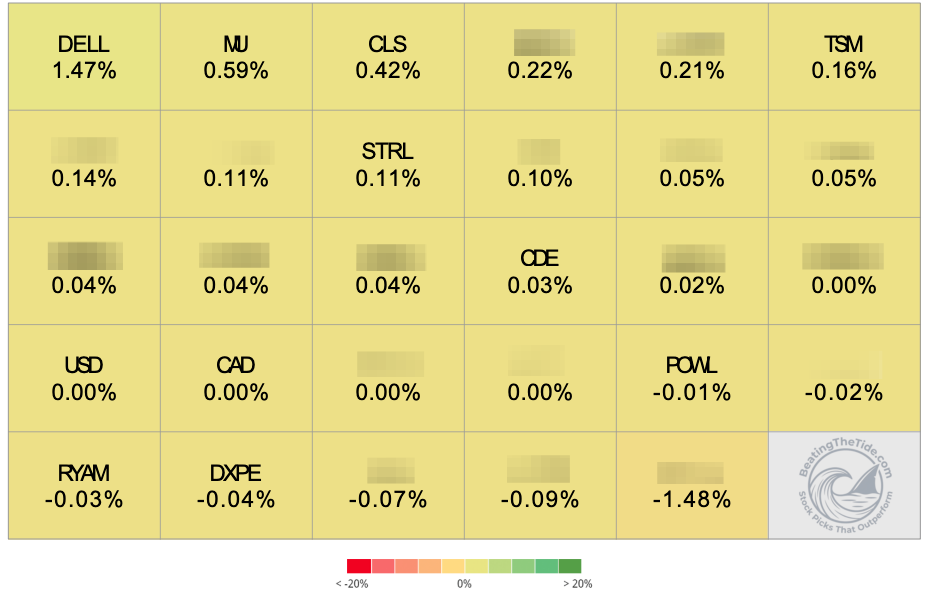
Contribution by Position
How to read the heat map? Click here.
That’s it for this week.
Stay calm. Stay focused. And remember to stay sharp, fellow Sharks!