The Balance Sheet Primer: Your Stock’s Financial X-Ray and Hidden Safety Net
Why the balance sheet, not the income or cash flow statement, reveals the truth about a company’s financial health and its ability to survive the next storm
(Adapted from my LinkedIn newsletter, Monthly Investing Fundamentals)
While each statement adds value and depending on the business model, one may carry more weight than another, in my view, the balance sheet is the only one that gives you the closest picture of a company’s true financial condition. It’s the X-ray beneath the skin.
The balance sheet often gets labelled as “boring” but I see it as a goldmine of insight. In this post, I’m pulling back the curtain on the balance sheet (yes, straight from a chapter of my so-called “boring” investment book) to show why this one financial statement can make or break your confidence in a stock.
I chose to start with the balance sheet and not the income statement nor cash flow statement because I believe it’s the most important of the three. And I’m willing to bet you’ll agree with me once you dive into the details below.
By the end of this, you’ll know how to read a balance sheet in plain English, spot a fortress-like financial position, sniff out red flags of distress, and focus on what matters and those subtle warning signs that whisper “trouble ahead.”
Master these fundamentals, and you’ll be miles ahead of the pack … no MBA required.
Table of Contents:
Why the Balance Sheet Matters (More Than You Think)
Imagine two companies: one sits on a mountain of cash, the other is drowning in debt. One can weather storms, but the other could collapse at the slightest shake.
The balance sheet is where you see that contrast. It’s effectively an X-ray of a company’s financial health at a point in time. It shows what the company owns (assets), what it owes (liabilities), and what’s left for the owners (equity). Ignoring this snapshot is like buying a house without checking the foundation. Dissecting the balance sheet can uncover issues like liquidity strains, reliance on debt financing, or aggressive accounting. In short, the balance sheet tells you whether a company can survive hard times or if it’s one shock away from trouble.
To put it simply, assets = liabilities + equity.
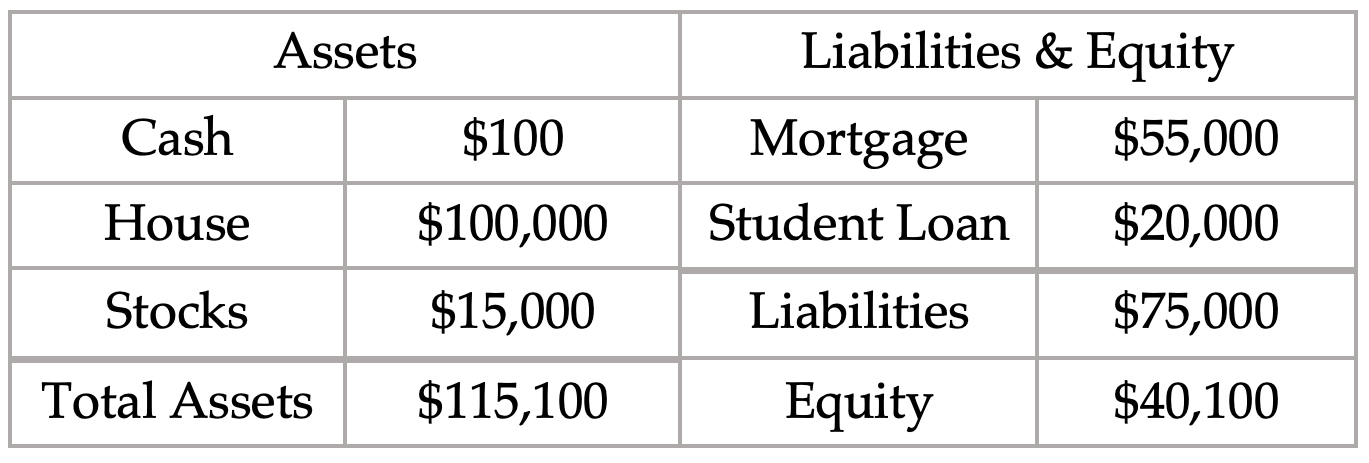
This equation must balance (hence balance sheet). For a quick real-world analogy, picture your finances: Your assets might include cash in the bank, your home, and your investments; your liabilities are things like a mortgage or student loan. The difference is your equity (your net worth). If you own a $100,000 house, $15,000 in stocks and one $100 bill, your assets are worth $115,100. And if you have a $55,000 mortgage and $20,000 in student loans, your liabilities are $75,000. That means your equity, or net worth, is $40,100. Notice how your total assets equal the sum of liabilities plus equity. A company’s balance sheet works the same way just with bigger numbers (and hopefully fewer student loans).
Assets are what the company owns or is owed. These range from current assets like cash, marketable securities, receivables, and inventory, to non-current assets like property/equipment or intangible assets (e.g. patents, goodwill from acquisitions). Current assets are expected to turn into cash within a year, whereas non-current assets stick around longer.
Liabilities are obligations. Debts to lenders, bills to suppliers, taxes due, etc. They’re split into current liabilities (due within a year, like accounts payable or short-term loans) and long-term liabilities (like bonds or leases due in future years).
Equity (shareholders’ equity) is the residual interest, basically the book value of what shareholders “own” once liabilities are paid off. Equity includes common stock, retained earnings, and other comprehensive income. It’s often called net assets (assets minus liabilities).
So why should investors care? Because the balance sheet reveals a company’s liquidity (short-term safety), solvency (long-term survival), and how aggressively it’s financed. A balance sheet loaded with cash and little debt signals strength; one bloated with debt and sketchy assets signals risk.
Breaking Down Key Balance Sheet Items in Plain English
Cash and Short-Term Investments
This is the lifeblood of a company. Cash is money in the bank. Short-term investments are things like treasury bills or money market funds that can be liquidated quickly. Lots of cash and liquid investments mean the company can meet obligations and seize opportunities. Significant cash on hand is a hallmark of a solid financial position as it’s a cushion and war chest all in one.
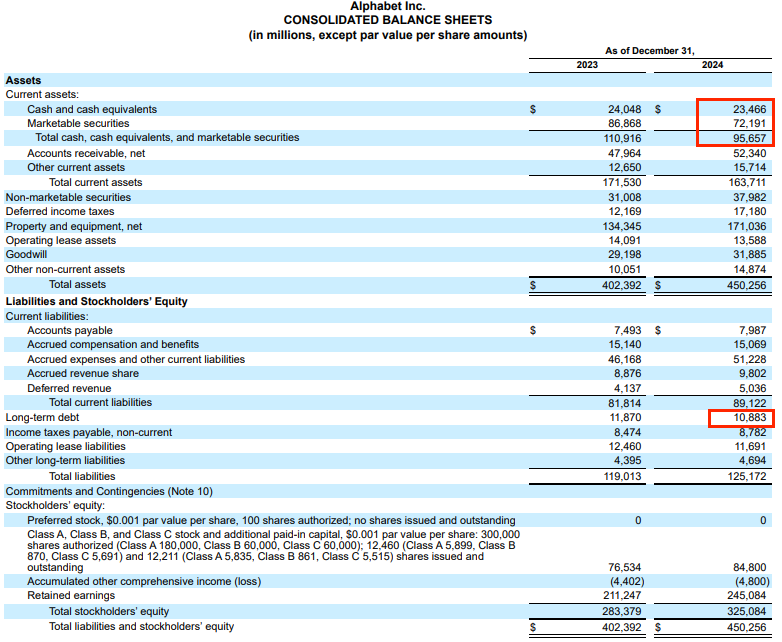
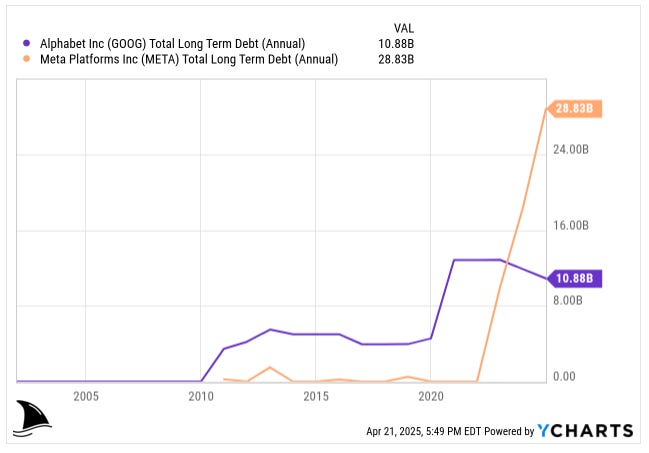
For example, Alphabet (GOOG 0.00%↑) had a whopping $95.7 billion in cash, equivalents, and marketable securities, versus only $10.9 billion in long-term debt.
That net cash position makes Alphabet’s balance sheet a fortress. They could pay off all their debt nearly nine times over. It’s no surprise that such liquidity gives Alphabet incredible flexibility (funding R&D, acquisitions, buybacks, etc., on its own terms).
Pro Tip: Huge cash reserves vastly exceeding debt is a liquidity “cushion” that marks a fortress balance sheet, providing safety and flexibility. Companies with net cash (cash > debt) are financially very resilient.
However, too much cash can raise questions. If a company is hoarding cash far beyond its operating needs, investors should ask, “Why?”. Excess cash is essentially idle capital and management should either reinvest it for growth or return it to shareholders. If they’re piling up cash, perhaps they’re planning a big move (acquisition), or just being ultra-conservative.
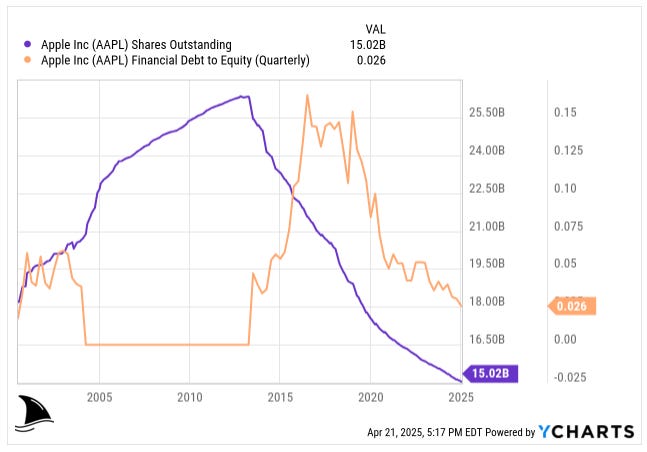
Apple (AAPL 0.00%↑) was famous for stockpiling cash for years; more recently, it decided to return a lot of that excess to shareholders via buybacks.
The key is to figure out how much cash is “excess” (not needed for day-to-day operations).
A rough rule: if a company consistently carries cash far above what its business requires, and management has no clear use for it, that cash should effectively be added to the firm’s value (it’s money in the bank). But you also want to see management put it to good use or distribute it . In short, ample cash = good, but endless cash with no purpose might signal untapped value or lack of strategy.
Working Capital (Current Assets – Current Liabilities)
This is the short-term liquidity gauge. Working capital measures whether a company can cover its near-term bills using its near-term assets. If current assets exceed current liabilities, working capital is positive and is generally a good thing.
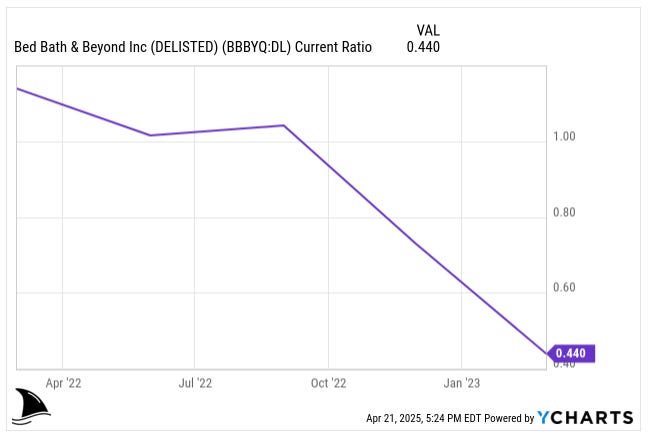
If it’s negative (more short-term debt than cash coming in), that can spell trouble or in rare cases, signal a highly efficient business model (we’ll get to that). One common metric is the current ratio = current assets / current liabilities. A ratio above 1.0 means assets cover liabilities; below 1.0 means a company is essentially running with a short-term deficit (paying today’s bills with tomorrow’s expected money).
For most businesses, a chronically low current ratio is a red flag for potential cash crunches.
Case in point: Bed Bath & Beyond (BBBY 0.00%↑). In early 2022, this retailer still had a current ratio around 1.3, meaning it had $1.30 in current assets for each $1 of current liabilities. But by the end of 2022, that ratio plunged to just 0.73: a clear sign of liquidity strain. With liabilities far outstripping readily available assets, the company was effectively living on borrowed time.
I wrote about the imminent bankruptcy in early 2023 on Seeking Alpha. Sure enough, Bed Bath & Beyond spiralled into crisis and filed for bankruptcy in 2023.
The collapsing current ratio telegraphed the distress well in advance (you could literally see the cash drying up relative to short-term debts).
On the flip side, some stellar businesses operate with negative working capital by design, and it’s a strength.
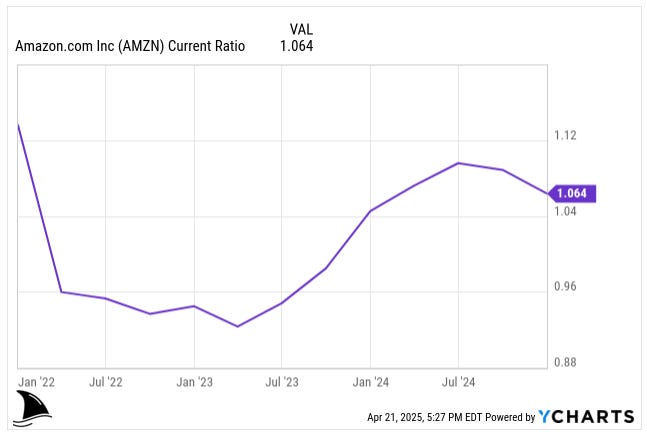
Take Amazon (AMZN 0.00%↑).
It often has a current ratio around 0.9–1.0 , which normally might worry analysts.
But Amazon’s model generates cash so fast that it benefits from negative working capital. How?
Customers pay Amazon upfront (e.g. for Prime subscriptions or online orders), while Amazon pays suppliers later. That creates a large deferred revenue (a liability) and accounts payable float.
In other words, Amazon is using other people’s money to finance its operations, a “good” kind of negative working capital. Amazon’s deferred revenue from Prime means it collects a year’s cash for services it provides later, effectively giving it free capital to reinvest immediately. The result: a cash machine with a constant influx of customer funds.
So, context is key. A low current ratio for a slow-paying manufacturing firm is bad news, but for a fast-turn, cash-rich model like Amazon, it can be normal. The nuance is understanding why a company’s working capital is structured that way.
Pro Tip: Generally, though, persistent liquidity shortfalls are a glaring red flag. You don’t want a company that can’t pay its bills without refinancing or issuing stock.
Debt and Leverage
The liability side deserves serious attention. Debt isn’t inherently evil as I tried to explain to my uncle. It can juice returns in good times, but too much debt can sink a company. Solvency is the ability to meet long-term obligations, and it hinges largely on debt levels relative to equity and cash flow.
A quick gauge is the debt-to-equity ratio (D/E), which compares what the company owes vs. what shareholders have put in (or retained). Another is debt-to-assets, the proportion of assets financed by debt. High leverage (lots of debt relative to equity) means the firm is playing with fire: if earnings falter, creditors still expect interest and principal payments, which can force distress or dilution.
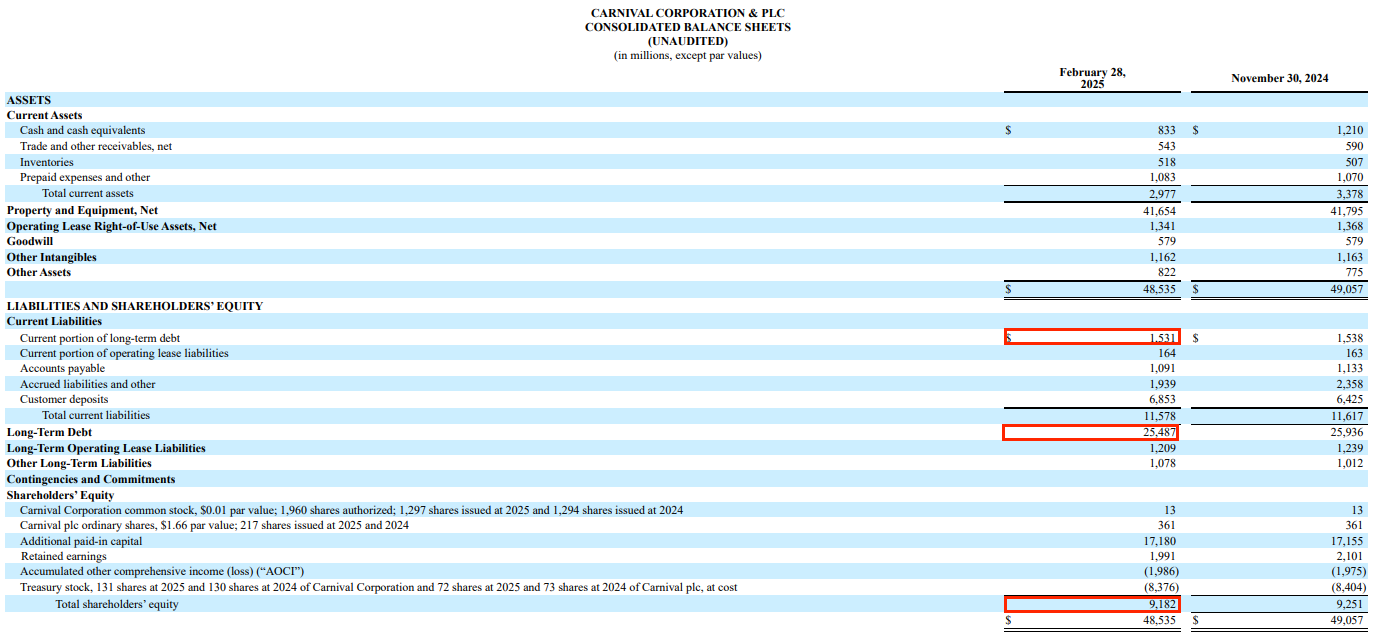
A stark example: Carnival Corporation (CCL 0.00%↑), the cruise line giant, leveraged up to survive the pandemic. As of February 2025, it carried about $27 billion in debt against only $9 billion in equity… a debt-to-equity ratio near 300%.
That’s extremely high. Carnival fails basic balance sheet health checks, with more debt than some airlines and a debt load over 3 times shareholder equity. The result? Hefty interest costs that eat into profits, and a vulnerable position if another shock hits travel.
Carnival’s balance sheet is the opposite of a fortress, it’s more of a leaky boat that needs calm waters to stay afloat. Such a leveraged balance sheet means elevated risk: there’s less margin for error, and equity holders sit behind a mountain of creditors.
By contrast, low debt or debt-free companies offer a measure of safety. Many great businesses have zero net debt (cash exceeds debt). For example, Alphabet and Meta (META 0.00%↑) for a long time had essentially no net debt.
A conservative balance sheet with modest leverage means the company can endure earnings hiccups without facing solvency crises. Philip Fisher warned about companies with weak finances, preferring those with “conservative financing” (low debt) so that excessive debt never turns into an investor’s nightmare.
It’s sage advice: if two companies are identical in prospects, but one is 10x more leveraged, the safer bet is the one with less debt.
You avoid the scenario where a bad quarter triggers covenant breaches or dilutive stock issuances to raise cash. In practical terms, check the trend: is the company’s debt load growing faster than its earnings or assets? Rapid debt build-up is often a red flag (unless there’s a clear value-accretive reason, like a one-time strategic acquisition).
Also, look at interest coverage (EBIT or EBITDA divided by interest expense). If it’s falling, that means debt is becoming burdensome. As a rule of thumb, an interest coverage below 3x or 4x is worrisome in most industries.
Equity and Book Value
Shareholders’ equity is what’s left for owners after liabilities. It’s often called book value. While book value doesn’t always reflect market value (think of a company like Coca-Cola (KO 0.00%↑)), its brands are worth far more than the balance sheet shows), changes in equity can tell a story. If a company is consistently profitable, equity tends to grow (through retained earnings), unless it’s aggressively buying back stock or paying big dividends (which reduce equity).
On the flip side, serial losses will erode equity. In extreme cases, a company can have negative equity meaning liabilities exceed assets, a sign of grave distress unless you’re in a unique industry like banking or an early-stage tech firm where market value relies on intangibles. Generally, an expanding equity base (via retained profits) is a healthy sign, whereas shrinking equity due to losses or write-downs is a yellow flag.
Not all assets are created equal
One dollar of cash is very different from $1 of goodwill on the balance sheet. We care about the quality of assets. This is where you hear about “tangible book value” (equity minus intangible assets), which tells you what the hard assets backing the company are.
If a company’s equity is mostly made of goodwill and intangibles from acquisitions, be cautious. Goodwill arises when one company acquires another for more than the fair value of its net assets, essentially an accounting plug for “we paid extra, expecting future benefits.”
It’s an intangible blob that can’t be sold or used to pay debts. Goodwill often gets written down if an acquisition doesn’t pan out. As they say, goodwill is an asset “waiting to become an expense.” It sits on the balance sheet until management admits an overpayment and impairs it, flowing through the income statement as a loss.
Pro Tip: Write off goodwill completely when analyzing. Treat it as valueless. That’s extreme, but it underlines skepticism toward goodwill’s real worth.
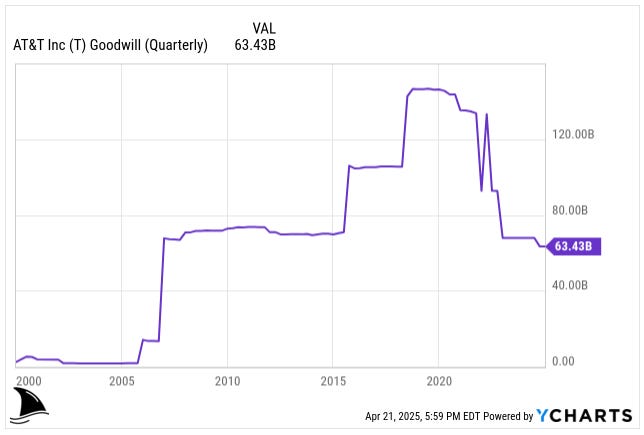
Consider AT&T (T 0.00%↑): after a spree of overpriced acquisitions (Directv and Time Warner), AT&T’s balance sheet swelled with goodwill, over $146 billion at one point. Those deals also saddled it with a mountain of debt (over $150 billion). Eventually, AT&T had to acknowledge the obvious: it overpaid massively. In 2022, AT&T took a goodwill impairment of almost $25 billion related to its floundering media businesses. Essentially, tens of billions of “asset” value evaporated, because it was never real to begin with, it was just goodwill on paper.
The lesson: A balance sheet heavy on goodwill from acquisitions deserves extra scrutiny. Are those acquisitions truly earning returns, or will that goodwill become a write-off?
A spike in goodwill is often a warning sign that a company paid top dollar for expansion. If you see goodwill balloon year-over-year, dig deeper. Is the company buying growth at any price? And if so, could it be because organic growth is stalling?
Many disastrous stock investments involve companies that went on acquisition binges, loaded up on goodwill and debt, then later wrote off half of those deals (destroying shareholder value in the process).
Other Assets and Liabilities (Where the Subtle Signals Hide)
Some of the most telling clues about a company’s financial health live in the quieter corners of the balance sheet.
Property, Plant & Equipment (PPE)
Most asset-heavy businesses report PPE as net of depreciation meaning gross PPE minus accumulated depreciation. But this number can be wildly different from economic reality.
First, companies carry land and assets at historical cost. So if a company bought land in the 1970s that now sits in the heart of a booming city, it might still show up on the books at $1 million even if it’s worth $50 million today. That’s understated book value. KT Corp. comes to mind. KT 0.00%↑ supposedly sits on real estate worth as much as its market cap.
Second, depreciation is usually straight-line accounting depreciation, not economic depreciation. The former assumes assets lose the same value each year. But in the real world? Value might drop sharply early on, or barely decline at all. A warehouse may be fully depreciated on paper, but still generate value. So net PPE often reflects accounting convention more than true economic worth.
Pro tip: If a company has a lot of older, depreciated assets still in use, or land in a now-prime location, book value may understate real value. But the reverse can also be true: a recent factory build could be overvalued on the books if it’s underperforming.
Accounts Receivable (AR)
This is money the company is owed by customers. If AR is growing much faster than revenue, it’s a yellow flag. It could mean the company is:
Extending loose credit terms
Booking revenue it hasn’t collected
Or worse, recognizing revenue that might never materialize
Healthy companies keep receivables in line with sales. Watch the days sales outstanding (DSO) trend. If it’s stretching, cash flow might soon feel it.
Inventory
Rising inventory + flat sales = bad news. It usually means the company misjudged demand and is sitting on goods it can’t move. That leads to markdowns, write-downs, or obsolescence. None of which are great for margins.
Inventory bloat also ties up cash. Even if the income statement looks fine, the cash flow statement may tell a different story when working capital eats up liquidity.
Accounts Payable (AP)
Payables are bills to suppliers. When managed well, they’re a source of short-term financing (Amazon famously uses AP to its advantage). But if you notice days payable outstanding rising fast, it might mean the company is delaying payments just to conserve cash, a sign of financial strain.
Short-Term Debt Maturities
Always check how much debt is due within the next 12 months. A big lump-sum maturity (“bullet payment”) can pressure a company to refinance, especially dangerous in tight credit markets. Companies with recurring short-term refinancing needs carry liquidity risk, even if it doesn’t show up in long-term ratios.
Equity Dilution
You won’t see dilution spelled out on the balance sheet, but the clues are there. If a company is repeatedly issuing shares to raise cash, you’ll see jumps in common stock or additional paid-in capital, often paired with a boost in cash.
Sometimes this kind of capital raise is necessary (especially for early-stage or distressed companies). But repeated dilution tells you the company isn’t self-sustaining. Internal cash flow should fund the business not serial equity raises. Every new share issued chips away at existing shareholders’ ownership. Watch for rising share counts in the equity section or footnotes.
What’s the first thing you look for when judging a company’s balance sheet?
Spotting Strong vs. Weak Balance Sheets (Real-World Examples)
Johnson & Johnson ✅
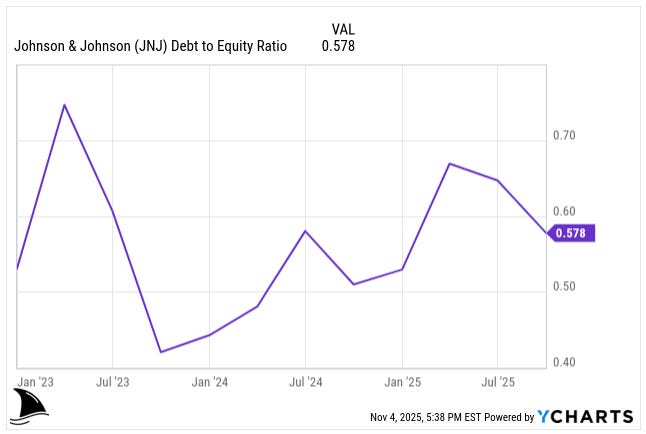
J&J (JNJ 0.00%↑) is a conservative stalwart. It carries a reasonable amount of debt but also substantial assets and stable cash flows. As of its latest filing, JNJ’s debt-to-equity is around 0.6, and it maintains a high credit rating.
It has significant cash on hand ($19 billion) and a diversified portfolio of businesses. This strong balance sheet allowed J&J to weather huge litigation expenses and still increase its dividend for decades straight. Investors often refer to J&J as having a “fortress balance sheet,” meaning it would take extreme adversity to impair its solvency. It’s no coincidence that J&J is one of a handful of AAA-rated companies.
Key takeaway: a moderate leverage ratio, steady retained earnings growth (equity growing), and ample interest coverage make for a low-risk balance sheet.
Alphabet ✅
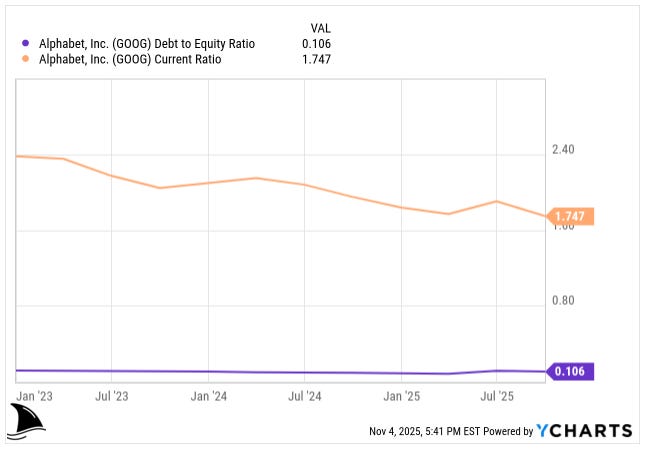
We already noted Alphabet’s gigantic cash hoard. To add perspective: Alphabet’s current ratio is about 1.7, and its debt-to-equity is a mere 11% .
This is the kind of balance sheet that lets a company invest in moonshots (self-driving cars, etc.) without endangering the core business. It means one’s downside is somewhat protected even if advertising revenues dip in a recession, Alphabet has the financial strength to ride it out.
You’re unlikely to face a dilution or bankruptcy with a balance sheet like this. It’s a case where the balance sheet enhances the stock’s appeal (it deserves a premium for safety).
Ford Motor Company 🤔
The automotive industry is capital-intensive, and even established companies like Ford carry substantial debt. Ford (F 0.00%↑)’s financial structure encompasses both its automotive operations and its financing arm, Ford Credit.
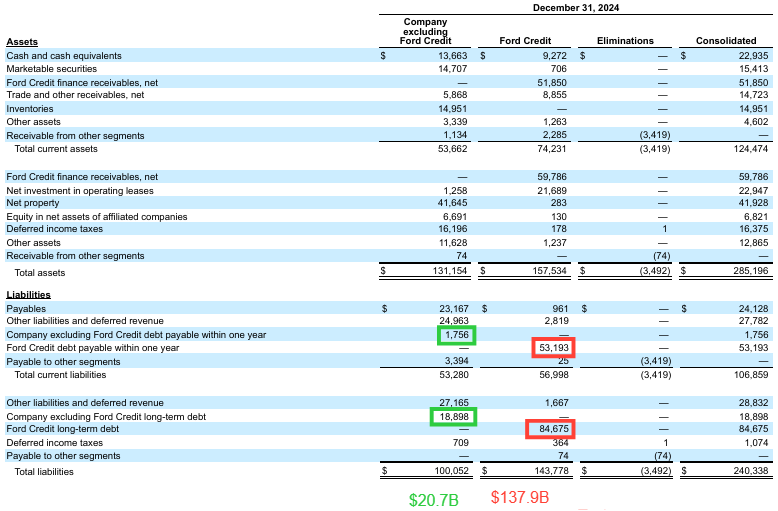
As of December 31, 2024, Ford’s automotive debt stood at approximately $20.7 billion, excluding Ford Credit. In contrast, Ford Credit held about $137.9 billion in debt, primarily backed by customer auto loans and leases.
At first glance, Ford’s liabilities may appear to exceed its assets; however, this is characteristic of its financing business model. When excluding Ford Credit, Ford typically maintains an investment-grade balance sheet.
Regarding pension obligations, Ford’s funded plans remained fully funded as of the end of 2024. The underfunded status for its pension and other post-employment benefit (OPEB) plans was approximately $0.5 billion and $4.4 billion, respectively. In 2024, Ford contributed $1.1 billion to its global pension plans and expects to contribute $800 million in 2025.
During the 2008–2009 financial crisis, while competitors GM (GM 0.00%↑) and Chrysler filed for bankruptcy due to overwhelming debt and pension liabilities, Ford avoided bankruptcy by securing a substantial credit line of $23.6 billion in 2006, mortgaging nearly all of its assets. This strategic move provided Ford with the necessary liquidity to restructure and survive the downturn.
The key takeaway is that in cyclical industries like automotive manufacturing, a robust balance sheet can be crucial for survival during economic downturns. It’s essential to understand industry norms; a balance sheet that appears risky in one sector may be standard in another.
Peloton Interactive 🚨
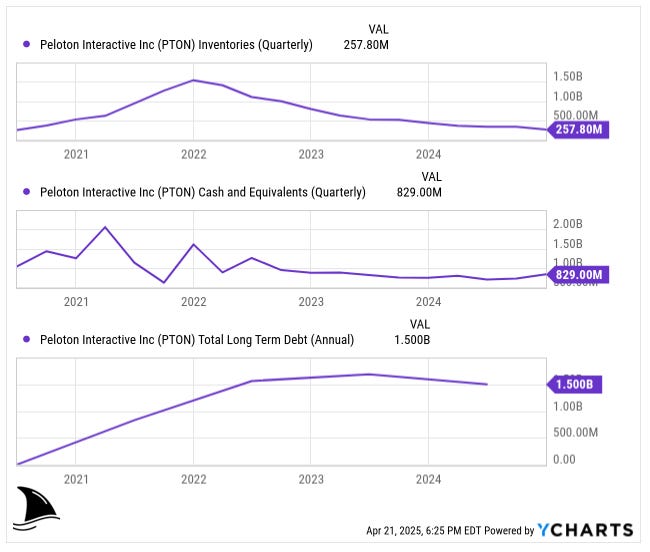
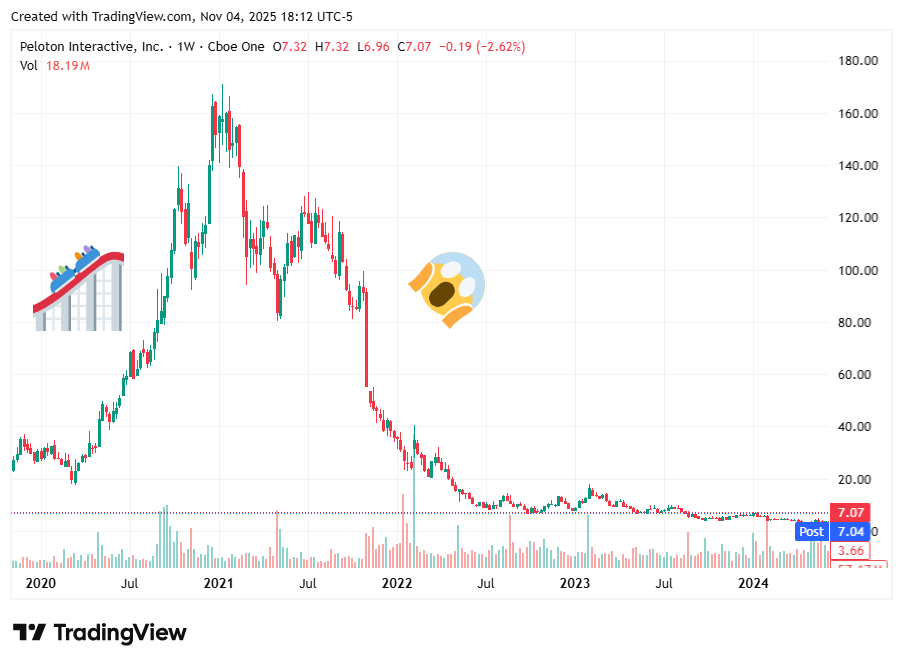
Peloton (PTON 0.00%↑) was flying high in 2020 with surging sales. But by 2022, demand cratered and Peloton’s inventories ballooned. Listen to the 3-part series of Business Wars on Peloton, it is great!
The company had tied up a huge amount of cash in building bikes and treadmills that were not selling. Its balance sheet went from asset-light (more cash than debt) to asset-heavy in all the wrong areas (excess inventory, mounting debt).
Peloton had to take out expensive loans and even sell a stake to raise cash. Its current ratio fell below 1, and debt-to-equity spiked as losses eroded equity. This is a classic case of how quickly a balance sheet can deteriorate when the business environment changes. Investors who watched Peloton’s quarterly balance sheets could see the storm brewing: inventory up dramatically (from under $0.5B to over $1B), cash down, debt up. Not sustainable.
Sure enough, the stock collapsed as liquidity fears took hold.
Moral: a formerly “okay” balance sheet can turn sour fast if the company misjudges demand or doesn’t control its working capital. Always monitor trends, not just static numbers.
In practice, when assessing a company’s balance sheet strength, compare within its peer group. Banks, for instance, operate with high leverage by nature (their liabilities are mostly deposits). It doesn’t make sense to hold a bank to the same debt/equity standards as a manufacturing firm. Instead, use industry-appropriate metrics (for banks, look at capital ratios like Tier 1 capital). For most non-financial stocks, however, the common metrics we’ve discussed will serve you well: current ratio, debt/equity, interest coverage, and the composition of assets.
Wrapping It Up (And Where to Go From Here)
A balance sheet won’t tell you everything about a business but it tells you a lot about what can go wrong. It’s where financial strength (or fragility) hides in plain sight. Cash cushions, dangerous leverage, goodwill bloat, silent liquidity issues are signals that don’t show up in headlines. But they’re right there, in black and white, for those who know where to look.
And here’s the truth most us learn the hard way: A great company can still be a terrible investment if its balance sheet is unsound. Likewise, a struggling company can buy time (or even stage a comeback) if its balance sheet gives it breathing room. We want the odds in our favor so it means prioritizing businesses with solid financial footing or, if we’re taking on risk, demanding a big discount.
In the words of Benjamin Graham, “margin of safety” is paramount and the balance sheet is often where that safety (or lack of it) reveals itself. So next time you research a stock, don’t just drool over the income statement. Give the balance sheet a long, hard look (and yes: the cash flow statement is coming next month 😉). It might just save you from a costly mistake or point you to an underappreciated gem.






The balance sheet really is the foundation, you're right that cash and debt levels matter more than most people realize. The Peloton example is a perfect case study of how cash can evaporate when working capital gets out of contrl. The Alphabet fortress balance sheet comparison shows why net cash companies can weather any storm.