What Is a Good Free Cash Flow Yield? A Simple Guide to Smarter Stock Picks
A clear, practical breakdown of free cash flow yield: what it is, how to judge if it’s “good,” and why it matters for avoiding traps and finding undervalued stocks across industries.
Next Wednesday, I’ll be releasing this October’s stock pick for paid subscribers. It’s a great one: right in telco, a space I know well and love, and it adds some welcome geographical diversity to our portfolio.
In the meantime, I’m sharing a piece from my LinkedIn newsletter “Monthly Investing Fundamentals” on free cash flow yield. It’s one of those simple yet powerful metrics that helps cut through the noise, sharpen your valuation lens, and avoid overpaying for hype.
Every stock investor eventually comes across the term free cash flow yield and the question, “What is a good free cash flow yield?”
Free cash flow yield tells us how much cash a company is churning out relative to its price. A higher yield often means a cheaper stock (and potentially a better bargain), while a low yield can hint that a stock is pricey. But as with all things in investing, context is everything.
Table of Contents:
What is Free Cash Flow (FCF)?
Free Cash Flow (FCF) is essentially the cash a business generates from its operations after paying all the bills and investing in the basic upkeep of its assets. Think of it as the money left over that could be used to pay dividends, buy back shares, pay down debt, or just pile up in the bank. Formally, it’s often calculated as:
Free Cash Flow = Operating Cash Flow – CapexOperating cash flow is the cash earned from the company’s core business activities. Capex are the funds spent on physical assets (like equipment, property, technology, etc.). By subtracting capex, we get the free cash. Cash that isn’t needed just to keep the lights on. In other words, free cash flow is the cash that’s truly “free” for shareholders after the company has reinvested enough to maintain its current operations. If a company’s operating cash flow is, say, $500 million and it spends $100 million on new equipment and maintenance, the remaining $400 million is its free cash flow.
FCF is a favourite metric for many investors because it strips away a lot of accounting noise and focuses on actual cash generation. Unlike net income (earnings), which can be clouded by non-cash charges and accounting rules, cash flow is harder to fake. Free cash flow reflects “the net result of actual cash received and paid during a company’s operations,” making it a good gauge of a firm’s ability to sustain its business and grow. In short, strong free cash flow means the company is bringing in real money, not just paper profits.
Maintenance vs. Growth Capex: Why It Matters
Not all capex is created equal. This is a crucial point: there’s a big difference between maintenance capex and growth capex. Maintenance capex is the mandatory spending required to keep the business running at its current level (like repairing machines, replacing worn-out trucks, updating software; the corporate equivalent of changing the oil and tires on your car). Growth capex, on the other hand, is discretionary; it’s money spent to expand the business and fuel future growth (like building a new factory or entering a new market).
Why should we care about this? Because when we evaluate free cash flow, we want to know how much cash a company can generate on a recurring, sustainable basis. If a firm is investing heavily in growth, its total capex will be high and thus its reported FCF will be low. But that doesn’t necessarily mean the business isn’t a cash cow. It might just mean management is choosing to reinvest aggressively right now.
Pro tip: Always look at the ‘adjusted’ FCF, which uses maintenance capex rather than total capex. It gives a clearer picture of the cash the business throws off if it only spends what’s needed to maintain current operations.
Warren Buffett coined the term “owner earnings” to capture this idea. He described owner earnings as the reported earnings plus non-cash charges (depreciation, amortization, etc.) minus the average annual maintenance capex required to keep the business running. Buffett even pointed out the “absurdity” of Wall Street focusing on “cash flow” figures that add back depreciation but don’t subtract maintenance capex. In plainer terms, some financial metrics make a company look like it’s swimming in cash by ignoring the money needed to maintain the business. Buffett’s approach corrects that: you must account for the cost of staying in business.
Buffett’s insight: A company’s true cash-generating power should subtract the upkeep costs. As he put it, many so-called cash flow numbers “include (a) plus (b) but do not subtract (c)” (with c being maintenance capex). In other words, don’t kid yourself that all the depreciation added back is free to spend. Some of it has to go back into the business to keep the wheels turning.
Academic and investment experts agree on distinguishing maintenance vs. growth capex. Professor Aswath Damodaran notes that capex comes in two flavours: maintenance capex to keep existing operations running, and new/growth capex to generate new growth. Both types reduce cash flow, but only one is optional. A savvy management team can decide to cut back on growth capex if needed (for example, in a downturn, they might delay building that new plant), but they can’t avoid maintenance expenditures without hurting the business. This is why, when analyzing a company’s cash flow health, I prefer focusing on Operating Cash Flow minus Maintenance Capex as it shows the core, repeatable free cash flow the business produces.
However, a practical word of caution: companies don’t explicitly break out maintenance vs. growth capex in their financial statements. Analysts often have to estimate it, and estimates can be fuzzy. Some use depreciation as a rough proxy for maintenance capex, on the assumption that if you’re depreciating $100 million a year in assets, you might need roughly that to replace/maintain them.
Others, like Bruce Greenwald, have proposed more elaborate methods to approximate maintenance capex over time. In the absence of precise figures, many investors simply take total capex as a conservative stand-in for maintenance needs, as it is better to underestimate free cash flow than to overestimate it and later find out the business needed more “upkeep” spending than you thought.
Key takeaway: be aware of the distinction: if a company’s free cash flow is only positive because it slashed growth investment to zero, that might not be sustainable in the long run. Conversely, if a company’s reported FCF is low or negative due to heavy growth capex, its maintenance FCF could tell a much rosier story.
What is Free Cash Flow Yield?
Now that we know what free cash flow is, let’s talk about FCF Yield. FCF yield is a valuation metric that shows how much free cash flow a company generates relative to its market value.
Free Cash Flow Yield = Free Cash Flow per Share / Share PriceYou can also calculate it for the whole company: FCF divided by the company’s market capitalization (which is just share price times number of shares). Both approaches give the same result percentage-wise. It’s analogous to the earnings yield (the inverse of the P/E ratio) but using free cash flow instead of earnings.
For example, if a stock trades at $100 per share and the company generated $5 in free cash flow per share over the last year, the FCF yield is $5 / $100 = 5%. This means the company’s annual free cash flow is 5% of its market price. In a sense, if you bought the whole company (i.e. all its stock), a 5% FCF yield implies you’d “get back” 5% of your purchase price in free cash flow each year (assuming cash flows stay constant).
I like FCF yield because it directly answers the question: “How much cash am I getting for the price I’m paying?” A higher FCF yield means you’re getting more cash flow per dollar invested (which could signal a bargain). It’s a bit like a rental property: if House A and House B both cost $200,000 but House A generates $20,000 in rent while House B generates $10,000, House A has a 10% “yield” vs. House B’s 5%. All else equal, House A is the better deal. The same logic applies to stocks with FCF yield: all else equal, higher is better.
Another way to think of FCF yield is as the inverse of the Price/Free Cash Flow (P/FCF) ratio. If a stock has a Price/FCF of 20, that means it’s priced at 20 times its annual free cash flow. In yield terms, that’s an FCF yield of 1/20 = 5%. If another stock has a P/FCF of 10, that’s an FCF yield of 10% (you’re paying $10 for each $1 of FCF it generates annually: a 10% return). So, much like a low P/E or low P/FCF can indicate a cheap stock, a high FCF yield can indicate the same. In fact, some investors prefer FCF yield over earnings-based measures because free cash flow is harder to manipulate than earnings. FCF reflects actual cash generation after necessary expenses, whereas earnings can be massaged by accounting choices. FCF yield provides a more accurate picture of a company’s ability to generate cash that can be returned to shareholders or reinvested in the business, making it particularly valuable for value-focused investors.
It’s worth noting that there are slight variations in FCF yield. Some analysts use FCF/EV instead of market cap. Using EV (which includes debt and excludes excess cash) can be useful to compare companies with very different debt levels. For instance, a company with a ton of debt might look like it has a high FCF yield on equity (since its market cap is depressed), but if you consider enterprise value (which adds that debt back), the yield might not be so impressive. Using enterprise value “accounts for net debt” and can bias the measure in favour of companies with stronger balance sheets. Both approaches (FCF/Market Cap and FCF/EV) are valid. In this discussion, we’ll stick to the simpler market cap version.
Just remember: if you’re comparing two companies and one has a lot more debt, that debt can make its equity FCF yield look higher than a peer – an important consideration we’ll revisit when we talk about traps.
What Is a “Good” Free Cash Flow Yield?
What counts as a good free cash flow yield? Is 5% good? 10%? It turns out, what’s “good” is a bit of a moving target as it depends on the industry, the company’s growth prospects, and the prevailing market conditions. There isn’t a single magic number that is always best, but let me outline some general benchmarks and considerations.
My Rule of Thumb: FCF yields in the mid-single-digits or higher are acceptable in my books but double-digits yields are interesting.
FCF Yield above ~5%
FCF yield above 5% is an indicator of value. It suggests the company is generating a healthy amount of cash relative to price, possibly indicating undervaluation. In other words, >5% implies the company’s free cash flow is more than 5% of its market cap, which is quite solid (for context, that’s like a P/FCF under 20).
While a yield of FCF is good, I set the bar even higher; I look for FCF yields of 10%. A yield in the double-digits (+10%) is often a sign of a potential bargain but also might come with higher risk (we’ll get to that).
FCF Yield ~3% to 5%
This would be a moderate or “okay” range for many companies. It indicates the company is generating a fair amount of cash, though not necessarily a screaming deal. If the business is a steady grower or lower-risk, 3–5% might be perfectly fine.
For instance, a company reinvesting a lot of cash into growth might only show a 3-4% FCF yield, but that could be acceptable because that reinvestment is fueling future expansion. In a low-interest-rate environment, even a 3-4% FCF yield could be relatively attractive compared to bonds.
But in 2025, with interest rates higher than they were a few years ago, investors have become a bit choosier. A 3% FCF yield (equivalent to a P/FCF ~33) is now often viewed as on the expensive side unless the company’s growth prospects justify it.
FCF Yield below ~3%
Often seen as low. A yield in the 0-3% range (like many hot tech stocks had at their peaks) signals that investors are paying a high price for relatively little free cash flow. That’s not necessarily bad if the company is poised for explosive growth (some companies intentionally reinvest almost all their cash to grow, so current FCF is low, think of Amazon (AMZN 0.00%↑) in its early years, or many biotech firms). But generally, a <3% FCF yield means the stock is priced for perfection or future growth, and there’s not a lot of cash yield today. It could be a red flag if it’s a mature company. Why pay such a high price for so little cash return?
Pro Tip: If you find a stock with a 10% FCF yield (i.e., P/FCF of 10), that’s generally considered quite good, it might merit a closer look as a value investment. On the other hand, a glamour stock with a 2% FCF yield (P/FCF of 50) had better have stellar growth prospects to justify such a low cash return.
Industry and Sector Differences
It’s critical to compare apples to apples. What counts as a good FCF yield in one sector might be ordinary in another. Different industries have different typical cash flow profiles:
High-Growth Tech & Biotech: Low Yields, Big Reinvestment
In high-growth tech or biotech, heavy reinvestment can drive FCF yields down into the low single-digits (or even negative) while fueling rapid top-line expansion.
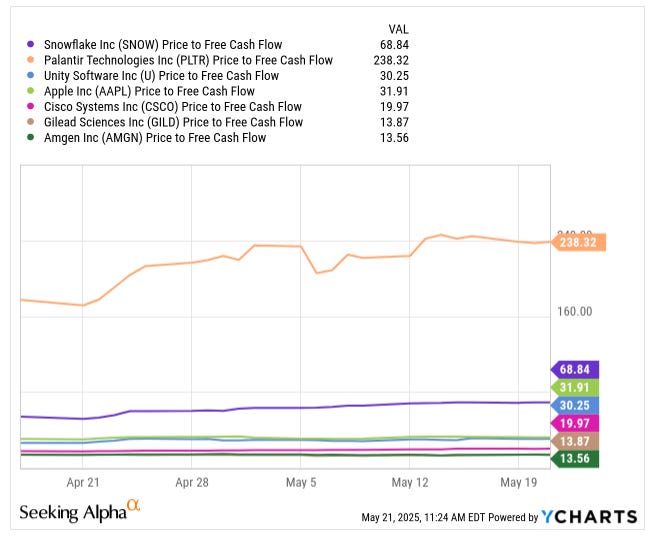
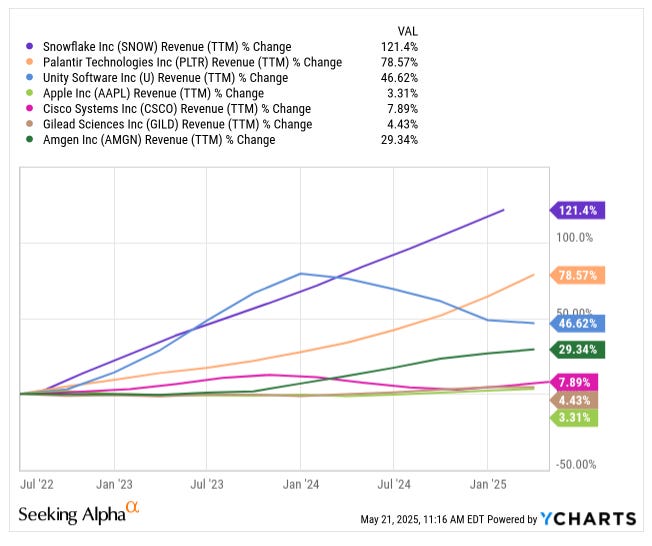
Take Snowflake (SNOW 0.00%↑) and Palantir (PLTR 0.00%↑). SNOW trades at roughly 69x FCF (a sub-1.5% yield) and PLTR at 239x (under 0.5%), yet behind those lofty multiples sit 121% and 79% revenue growth over the last two years, respectively. Both companies are plowing cash into R&D, cloud-buildout, and sales expansion, investments that crush today’s yield in hopes of tomorrow’s breakout.
Unity Software (U 0.00%↑) straddles the middle ground: its 30x P/FCF (~3% yield) is higher than SNOW or PLTR, but Unity’s revenue growth (~47% since mid-2022) isn’t quite as torrid. It still reinvests heavily in platform features and user acquisition hence a comparatively modest yield despite healthy growth.
On the other end, more mature names generate robust cash but grow more slowly:
Apple (AAPL 0.00%↑): ~32x P/FCF (~3.1% yield), 3.3% revenue growth. Its massive iPhone and Services engine requires far less reinvestment per dollar earned.
Cisco (CSCO 0.00%↑): ~20x P/FCF (~5.0% yield), 7.9% growth. Networking stalwarts’ modest capex needs to free up cash for buybacks and dividends.
Gilead Sciences (GILD 0.00%↑): ~14x P/FCF (~7.1% yield), 4.4% growth. Blockbuster antivirals still produce steady cash well above reinvestment outlays.
Amgen (AMGN 0.00%↑) stands out: trading at just 13.6x FCF (~7.4% yield) while delivering 29% revenue growth over the same period. A portfolio of high-margin, low-capex biologics (think Enbrel, Otezla) lets Amgen reinvest selectively, so it simultaneously fuels growth and hands investors premium cash returns.
Key Takeaway: A low FCF yield isn’t a red flag if it buys you outsized growth, but be sure to check that growth is really happening (and sustainable). Conversely, high yields can signal stability, but watch for stagnation if growth tails off too far. Finally, companies like AMGN that combine above-average growth with double-digit yields can be rare gems in your portfolio.
Stable, Mature Industries (Utilities, Consumer Staples, Telecom)
These tend to have more predictable cash flows and lower growth, so they often sport higher FCF yields. A regulated utility or a telecom might have a higher FCF yield (maybe 5-8%), and that’s expected, because investors demand a solid cash return from a slow-growth business. They’re not going to pay 50x cash flow for a utility the way they might for the latest Silicon Valley darling.
For instance, utilities often exhibit higher FCF yields due to their stable cash flows and limited growth opportunities.
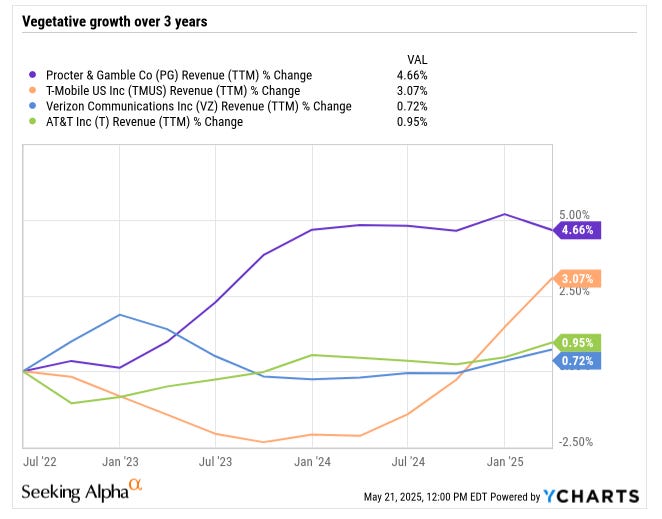
For example, over the past three years:
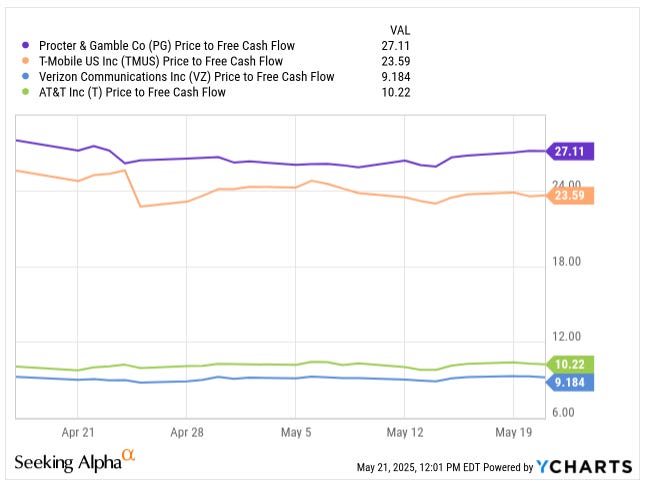
Verizon (VZ 0.00%↑) revenues have inched up just 0.7%, yet its Price/FCF of 9.2 implies an ~11% FCF yield.
AT&T (T 0.00%↑) grew 0.95%, trading at 10.2x FCF, or about a 9.8% yield.
Even T-Mobile (TMUS 0.00%↑), with 3.1% revenue growth, sports a 23.6x FCF multiple (~4.2% yield) as it finishes its 5G build-out.
Compare that with a non-telco such as Procter & Gamble (PG 0.00%↑) (+4.7% revs) at 27.1x FCF (~3.7% yield). Solid, but built more for stability than rocket-ship upside.
I’ve held each of these telco stalwarts in my portfolio, leveraging my years in the industry to spot value (hint: my next stock pick is a telco, but none of the above 😊). I first bought AT&T in 2022. Interestingly, while the shares have only gained 14%, the total return has been 84%, thanks to a high dividend supported by a high FCF yield.
Added VZ in March 2023 as well.
Locked in T-Mobile in April 2024. Their reliable cash flows and attractive FCF yields make them cornerstones of a dividend-and-income sleeve in my strategy.
Cyclical Industries (Energy & Commodities): What “Good” Looks Like Only in Context
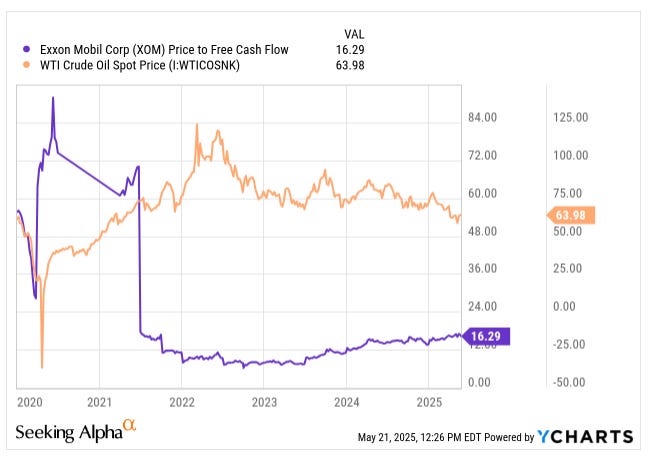
Cyclical names are tricky because headline FCF yields swing with the price chart of whatever comes out of the ground. Take Exxon Mobil (XOM 0.00%↑): when WTI spiked above $100 in 2022, Exxon was minting cash so fast that its P/FCF dropped into the high single digits, an eye‑popping double‑digit yield that looked like a permanent bargain.
Fast‑forward to May 2025 with oil hovering in the mid‑$60s and the same stock trades at roughly 16 x FCF, or about a 6 % yield. Nothing “went wrong” at Exxon; the gush of cash was simply tied to temporary commodity pricing.
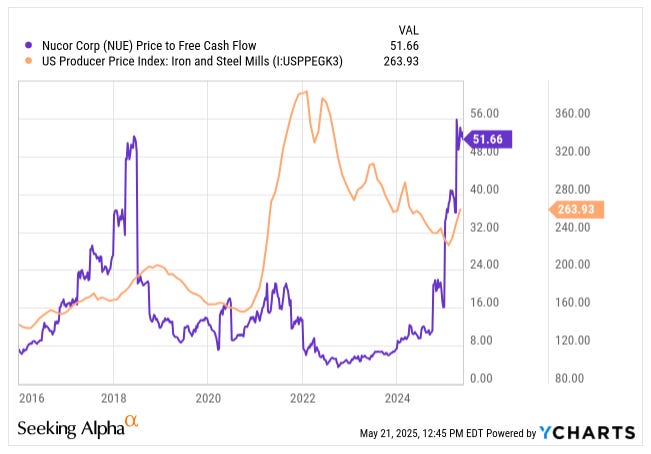
You see the same pattern in steel. During the pandemic boom, the U.S. steel price index blasted past 360, and Nucor’s cash machine went into overdrive, briefly offering investors a 25% FCF yield!
As steel prices normalized, that yield evaporated; today, Nucor (NUE 0.00%↑) changes hands at more than 50x FCF (barely a 2 % yield) even though the company is fundamentally the same.
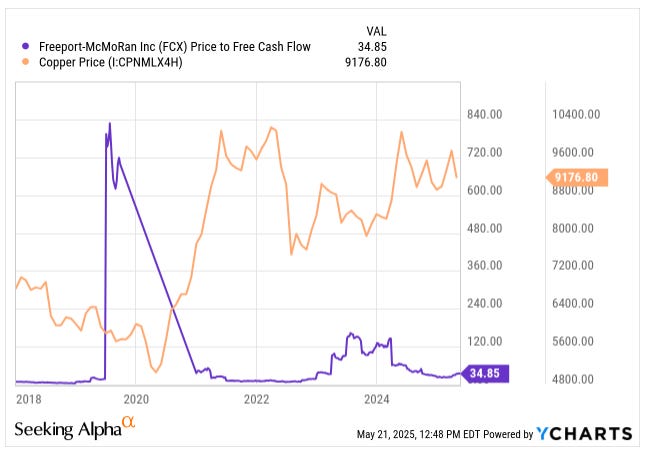
Copper tells a similar story. When the metal flirted with $10,000 per MT, Freeport‑McMoRan (FCX 0.00%↑) looked absurdly cheap on cash‑flow metrics and a 12% FCF yield. With copper back near $9,200 per MT, Freeport’s P/FCF has drifted into the mid‑30s, slicing its yield to roughly 3 %. The “bargain” was really just the top of the cycle.
The lesson is clear: a 12 % FCF yield in energy, steel, or mining can be a mirage if it’s calculated in a boom year. Always ask what the business would earn at mid‑cycle prices and base your valuation (and your margin of safety) on that normalised figure. In cyclicals, a “good” FCF yield is one that still looks attractive after the party ends.
To illustrate, the broad S&P 500 carried a 4.08 % free‑cash‑flow yield, while the FCF‑focused index stood at 9.77 % (source).
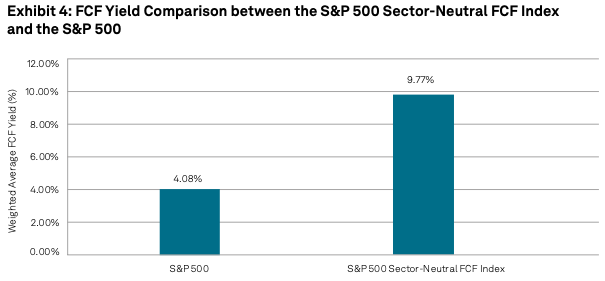
This tells us two things:
Roughly 4 % was the market’s going rate. Investors were collectively paying about 25x free cash flow for the average blue chip.
By concentrating on high‑FCF yield names, you could assemble a portfolio near 10 %, though it skews toward cash‑rich sectors such as energy, telecom, and other value pockets.
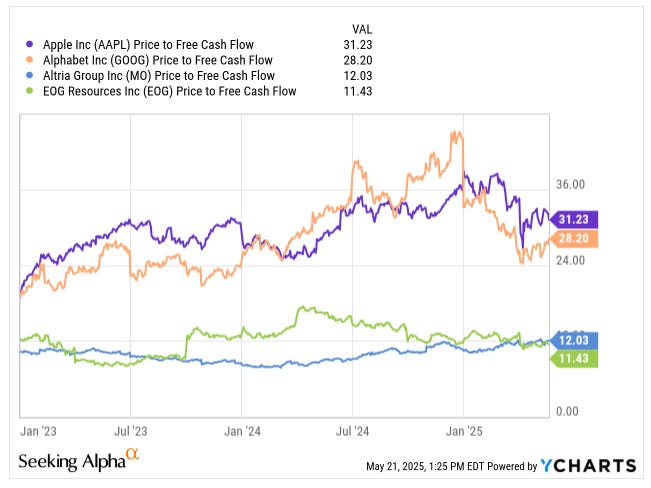
Fast‑forward to 2024, and the picture shifted as rising rates clipped equity prices in several cyclical areas, nudging median FCF yields a bit higher across the board. Even so, the spread has remained wide: mega‑cap tech like Apple or Alphabet (GOOG 0.00%↑) often trades around a 3% yield, whereas tobacco companies or E&P operators such as EOG 0.00%↑ can still print close to 10 %.
Key takeaway: Always benchmark a company’s FCF yield against its sector cohort. A 5 % yield may be outstanding for a cloud platform but ho‑hum for an oil driller. And if a yield towers above peers, it’s either a gift horse or a red flag worth dissecting.
High FCF Yield: Opportunity or Trap?
So, you stumble on a stock with a very high free cash flow yield say 10%, 15%, even 20%. Champagne corks should pop, right?
Well, maybe. A high FCF yield can indeed signal an opportunity, but it can also be a classic value trap. Separating the two is a critical part of an investor’s job.
When High FCF Yield Signals Opportunity
If a company truly has a high, sustainable FCF yield, it can be a fantastic find. It means the market might be pricing the stock too low relative to the cash it’s generating. This is the essence of classic value investing: finding situations where Mr. Market is pessimistic or asleep at the wheel.
In practical terms, a consistently high FCF yield could mean the company is generating loads of cash that can be returned to shareholders. Perhaps the business is in an out-of-favour sector or had a temporary issue that depressed the stock price, but the cash kept rolling in. These situations can lead to great returns when the market catches on.
Companies with “cash cow” status (generating more cash than they need) often return that cash via dividends or buybacks, which can drive stock prices up over time.
For example, United Rentals (URI 0.00%↑) started a dividend program and a share repurchase program as it had more cash than the business could absorb as I explained in my deep dive.
If you find a stock with, say, a 12% FCF yield and you believe that cash flow is reliable, you might reasonably expect that either the stock price will rise (bringing the yield down eventually), or you’ll get a lot of that value back through distributions. It’s like buying a $1 coin for $0.50, as long as you’re sure it’s a real $1 coin.
Why a High FCF Yield Could Be a Trap
On the flip side, sometimes a high yield is the market’s way of shouting “Danger!” Remember, a stock’s yield can rise not just because free cash flow went up, but also because the stock price fell. If investors suspect the company’s cash flows are about to drop, they sell the stock, lowering the price and mathematically boosting the FCF yield.
In such cases, the yield is high because nobody believes it’s sustainable. An abnormally high FCF yield (way above industry norms) can be a classic value trap, where the stock looks cheap but for good reason: the cash flow might be poised to decline or get diverted.
An exceptionally high yield could mean the market may be anticipating cash flow problems or business model challenges that aren’t yet fully reflected in financial statements. In other words, the company might be earning a lot of cash now, but perhaps its product is going obsolete next year, or a new competitor is eating its lunch, or it’s in a cyclical peak.
A few common reasons a high FCF yield can be a trap:
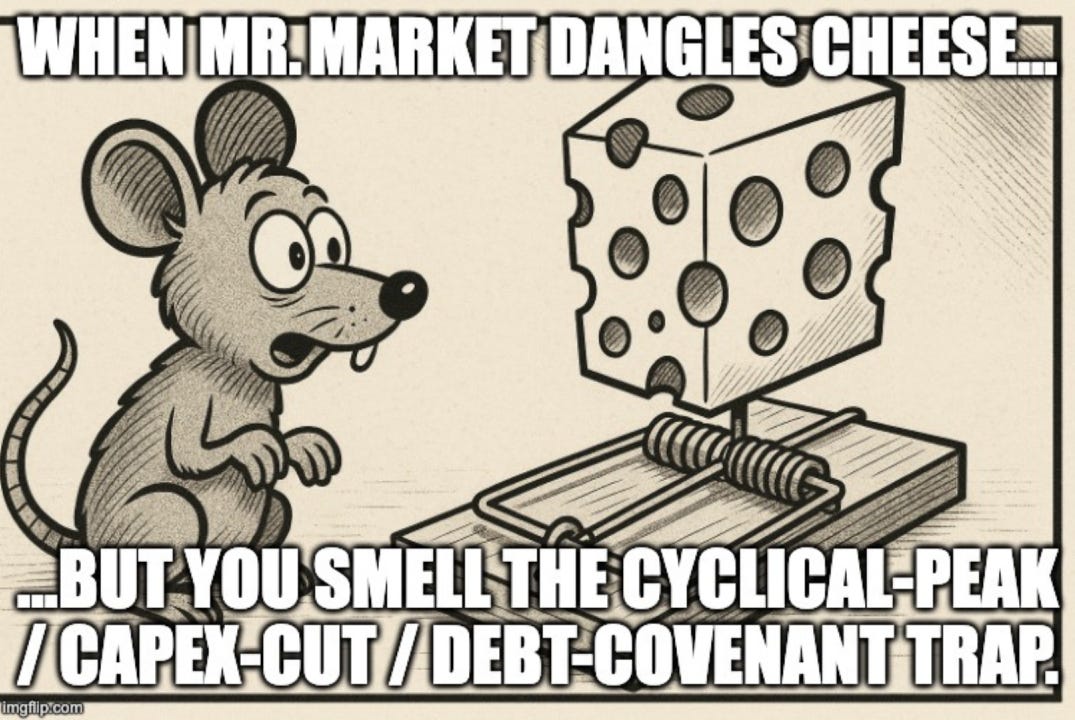
Cyclical Peak: The company is in a cyclical industry enjoying temporarily high prices (think commodity producers during a boom). Cash flow is strong this year, but if oil/metal prices or whatever revert to normal, next year’s FCF could be much lower. The stock might appear dirt cheap on current FCF, but that FCF is not going to last. Always ask: is the current free cash flow level sustainable or is it temporarily inflated by a favorable cycle?
Underinvestment: Remember the maintenance vs. growth capex discussion? A company can goose its free cash flow in the short term by slashing investment. If you see an unusually high FCF yield, it’s worth checking if the company has cut capex dramatically. Delaying necessary capital projects can make FCF look great for a year or two, but it’s not sustainable. Eventually, machines break, stores need renovation, and technology needs updating. A firm can’t starve its business forever without consequences. Companies can temporarily boost FCF by postponing necessary capex, which might improve short-term FCF yield but can harm long-term prospects. So, a company may show a high FCF yield because it’s skimping on upkeep or growth. That’s a red flag if true.
One-time boosts: Sometimes, free cash flow is high due to one-time events, e.g., a big legal settlement collected, a major asset sale, or working capital movements. These can make FCF lumpy. If a high yield is driven by one-off cash inflows, don’t expect it to recur. We should adjust for those non-recurring items. Likewise, aggressive working capital maneuvers (like delaying paying suppliers) can temporarily bump up FCF; again, not sustainable forever.
Structural Decline in Business: The company might be a declining business, throwing off cash from shrinking operations. For example, imagine a legacy media company or a tobacco company: they might have high FCF yields because their stock prices are low (no one expects growth, maybe even expects decline), yet they still generate cash from a dwindling but profitable business. These can actually be decent investments if the decline is slow and the valuation is low enough. Sometimes they’re cash cows that return a lot to shareholders. But other times, the decline accelerates or management misallocates the cash, and investors get stuck with a “melting ice cube.” The market might award a high FCF yield to a business it thinks won’t be around in 10 years; the yield is high, but if the “yield” in year 5 or 6 is zero (because cash flows dried up), the early high returns weren’t enough to save the day.
Debt and Other Claims on Cash: A company might have a high FCF yield to equity, but if it has a mountain of debt, a lot of that cash might need to go to debt repayments or interest rather than to equity holders. This is where looking at FCF to Enterprise Value is helpful. If a firm is highly leveraged, the equity might seem cheap (high FCF/Market Cap), but much of the cash is spoken for by creditors. For example, General Electric (GE 0.00%↑) during certain years had a high FCF yield on its stock price, but an enterprise yield would factor in its hefty debt and give a more modest figure. If you only look at the equity yield and ignore that the company must use cash to pay down debt, you might be misled. Always consider the balance sheet strength: a strong balance sheet (low debt, cash in bank) makes FCF truly free for shareholders; a weak one can make a chunk of that FCF essentially belong to bondholders.
A recent personal scar serves as a concrete reminder. In March 2023, I pounded the table on Sociedad Química y Minera de Chile (SQM 0.00%↑) (read my article on Seeking Alpha). On paper, it looked like a lay‑up: roughly $3.1 billion of FCF against a $24 billion market cap: a fat 13 % FCF yield that dwarfed peers.
Six months later, the “bargain” revealed its claws. Lithium carbonate prices, which had been hovering near record highs, began a steep slide; by year‑end spot prices were down more than 60 %. SQM’s quarterly run‑rate FCF collapsed, management guided to sharply lower 2024 cash generation, and the Chilean government floated a new public‑private lithium framework that could lift royalty burdens and require hefty reinvestment.
In hindsight, the high yield was signalling “cyclical peak + policy overhang,” not a permanently mis‑priced cash machine. My mistake was treating an extraordinary, price‑driven cash gush as sustainable when, in reality, both the commodity cycle and looming capex/royalty obligations were set to drain that yield away.
Ensure you’re diversified. While stocks with higher FCF yields have, on average, outperformed those with low yields over the long run (supporting the idea that value wins in the end), the high-yield stocks also “suffer higher drawdowns” and volatility. In other words, they can be risky, and some will be traps, so it’s wise not to bet everything on one or two names. Diversifying across several high-FCF-yield stocks can mitigate the risk that one turns out to be a dud.
Beyond the Yield: Other Factors to Consider
FCF yield is a powerful metric, but it’s not a standalone magic bullet. No single metric can capture a company’s full story. Here are some other dimensions to keep in mind when using FCF yield in your analysis:
Capital Intensity
How much ongoing investment does the business require to keep running or to grow? A high capital intensity business (think airlines, auto manufacturers, telecom infrastructure) might have lower true free cash flow relative to earnings because it must continually pour money into assets.
If a company has a high FCF yield today but operates in a capital-intensive industry, ask if that FCF is sustainable. Are they deferring capital projects? Do they have to replace factories or equipment soon?
Sometimes, companies with lower capital intensity (say a software firm or an advertising agency) can turn a greater portion of their earnings into FCF, supporting a higher FCF yield more easily.
Also, capital intensity can make FCF volatile. One big project can swallow cash for a year. Look at FCF margin (FCF as % of sales) and how much of operating cash goes back into capex over time.
Cyclicality
As discussed, cyclicality can dramatically swing a company’s FCF and therefore its yield. For cyclicals, it’s useful to look at average free cash flow over a full cycle or use peak/trough analysis.
A rule of thumb: don’t take a single year’s FCF at face value for a highly cyclical company. Instead, consider what a mid-cycle or through-cycle FCF might be.
What would the FCF yield be at normal commodity prices or normal economic conditions? If a company looks cheap based on peak earnings/FCF but not so much on normalized numbers, be cautious. Conversely, a cyclical stock might look expensive at the bottom of a cycle (low FCF or negative FCF, hence low or no yield), but that’s actually the best time to buy if you expect a rebound.
Context is key.
Reinvestment Opportunities and Growth Needs
This touches on the maintenance vs. growth capex angle in another way. If a company has lots of profitable reinvestment opportunities (e.g., it can open new stores at high returns, or invest in projects with great ROI), then having a lower free cash flow (and yield) now might be fine as they’re plowing money back in to grow.
On the flip side, a company with few growth opportunities will have more free cash (since they don’t have much reason to reinvest it), which can result in a higher FCF yield. That sounds good, but a no-growth company might deserve a higher yield (lower valuation) to compensate for the lack of growth.
Essentially, consider the company’s growth profile. High-growth companies often trade at low FCF yields (investors accept a lower current yield, betting on future growth in FCF), whereas low-growth or no-growth companies trade at high yields (investors demand more immediate cash return).
A “good” FCF yield for a growth stock might be lower than a “good” yield for a stagnating company. Also, check if management is allocating cash wisely: are they investing in projects that earn a good return? If not, it might be better if they return cash to shareholders rather than reinvest at low returns.
Balance Sheet and Financial Strength
A company’s debt and liquidity situation affect how we interpret FCF yield. A firm with net cash (more cash than debt) might warrant a bit of a premium (lower FCF yield) because you know its cash flows are truly free and there’s a safety cushion. A firm with heavy debt might trade at a discount (higher FCF yield) because that free cash flow has higher demands on it (interest and debt repayments).
Always check debt levels, interest coverage, and debt maturities. If a company’s FCF yield is high but it has, say, big debt payments due in two years, some of that “free” cash will be used to whittle down obligations, which might be fine, but then it’s not coming to you as a shareholder.
Also, if the yield looks extremely high, ensure that the company isn’t in distress (the market pricing in a possible bankruptcy or major problem: distressed stocks can show crazy-high yields right before a collapse because the price plummets).
A quick look at credit ratings or bond yields can give insight: if a company’s bonds yield 10% and its FCF yield is 12%, that’s not as comfy as a company whose bonds yield 2% and FCF yield is 6%. In short, a strong balance sheet makes FCF more valuable, and a weak balance sheet can erode the value of that FCF to equity holders.
Consistency of FCF
Is the company a consistent cash generator, or is its FCF all over the map? Consistency generally deserves a premium (lower yield) because you can count on it, while erratic cash flows are riskier. Look at the past 5-10 years of FCF if available. A company that steadily produces FCF year after year (and especially one growing its FCF) is arguably in great shape.
One that sometimes has a positive FCF, other times a negative FCF, is harder to judge. Consistent high FCF over several years can indicate a truly undervalued stock if the market hasn’t caught on. Conversely, if the FCF is large only this year but not historically, investigate why.
Management and Capital Allocation
Finally, qualitative factors count. What is management doing with the free cash flow? Are they shareholder-friendly (paying dividends, buying back shares, paying down debt)? Or are they empire-building (spending cash on questionable acquisitions or excessive expansion)?
A high FCF yield is most compelling when you trust that management will use that cash in ways that benefit shareholders. A great management can create a lot of value with strong free cash flow (or at least return it to owners); a poor management can squander it.
Wrapping Up
FCF yield is a handy metric to gauge value. It boils down complex cash flow statements into a single percentage that says, “This is how much bang (cash) you’re getting for your buck (price).” A “good” FCF yield is generally one that is above the market or industry average (often north of 5%) but what’s good varies by sector and situation.
High FCF yields can signal undervaluation. However, as we’ve discussed, you must look under the hood: ensure those cash flows are real, recurring, and sustainable. Watch out for situations where the yield is high because the business is deteriorating or cash flows are about to fall off a cliff.
Focusing on FCF yield can simplify a lot of the noise around stocks. It helps cut through hype. If a hot tech stock has a 0% FCF yield, it’s clear you’re betting on future improvements, not current cash generation. If a boring industrial firm has a 12% FCF yield, it could be a diamond in the rough… or a warning of trouble.
The metric encourages an owner’s perspective: how much cash is this business actually spitting out for me each year relative to what I’m paying? That’s a very fundamental question, and FCF yield is a straightforward way to answer it.
To optimize your investing decisions, use FCF yield alongside other metrics and qualitative research. It pairs well with ROIC (to gauge quality), growth rates, and debt analysis.


