ROIC Explained: The Most Overlooked Metric That Drives Stock Returns
A practical guide to Return on Invested Capital: from GE’s mistakes to oil company case studies, and why ROIC vs WACC is the key to long-term outperformance.
I still remember the lightbulb moment early in my investing journey when I discovered Return on Invested Capital (ROIC). At Moneda Asset Management, it was a metric we studied in detail along with the unit economics.
It was one of the first metrics I truly learned to use, and it completely changed how I evaluate businesses. Up until then, I had been looking at the usual suspects like earnings and Return on Equity (ROE), but something wasn’t adding up.
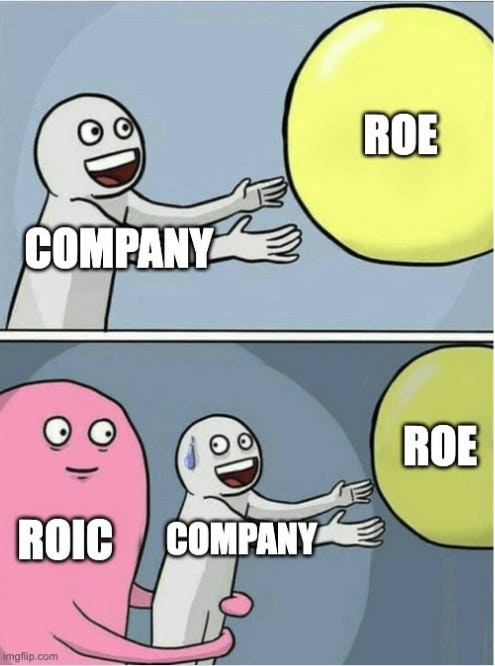
A company I was researching boasted a high ROE, yet somehow it kept disappointing. That’s when I learned a critical lesson: ROE can lie by telling only half the story, while ROIC cuts through the noise. Seeing ROIC in action was a game-changer for me. It was like putting on glasses and finally seeing the financial landscape in focus.
In this primer, I want to share why ROIC became the real MVP in my investing toolkit. I’ll start with a quick story (spoiler: it involves avoiding a classic investing pitfall), then break down what ROIC really measures and why it matters more than the hyped-up ROE.
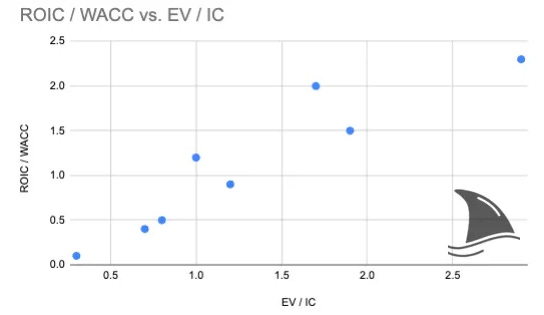
I’ll dive into how to calculate ROIC and its components. I’ll show you how I learned to graph ROIC against WACC (Weighted Average Cost of Capital) and track the spread between them. A simple habit that directly ties into valuation via the EV/IC ratio (Enterprise Value to Invested Capital). In fact, plotting ROIC/ WACC alongside EV/IC multiples has become a staple of my long-term investing research, helping me spot mispricings in the market.
I’ll also walk through a full case study using upstream oil companies to see ROIC in action, breaking it into basic operational drivers (so you can see exactly what moves this metric). And because no discussion of ROIC is complete without a dose of reality, I’ll talk about competitive moats: why a sky-high ROIC without a moat is usually short-lived as rivals rush in and returns get competed away.
That ties into a crucial point about the long run: how we treat ROIC in the terminal year of a DCF (Discounted Cash Flow analysis) can make or break a valuation. I’ll wrap up by sharing a bit about how this ROIC-centric framework has paid off for me, including my performance (yes, it’s been beating the S&P 500 for more than a decade using these very principles).
So grab a coffee, and let’s demystify ROIC… the most important metric you’re probably not using (yet).
Table of Contents:
What ROIC Really Measures (and Why It Matters)
ROIC is, at its core, a simple concept: it tells you how good a company is at turning all the money it uses (debt & equity) into profit. Formally, ROIC is defined as a company’s after-tax operating profit divided by the total capital invested in the business.
Joel Greenblatt, in The Little Book That Beats the Market, describes ROIC as a way to figure out “how much cash a company generates in relation to the capital tied up in its business”. In other words, a higher ROIC means the business is able to pocket more profit for each dollar invested, which is obviously a good thing. Greenblatt actually uses a form of ROIC as the “good company” half of his famous Magic Formula, defining it as EBIT divided by tangible capital (net working capital + net fixed assets). He points out that companies able to earn a high return on capital, even for a short time, usually have something special about them, otherwise competition would have already driven those returns down. This hint about competition is critical (I’ll revisit it when we talk about moats).
McKinsey’s tome Valuation likewise highlights ROIC as a key driver of value creation. It uses a similar definition: after-tax operating profit divided by the sum of working capital and fixed assets. In their framework, a company that consistently earns a ROIC above its cost of capital is creating value, whereas one with ROIC equal to the cost of capital is just breaking even, and below that is destroying value.
Professor Aswath Damodaran in Investment Valuation drives the point home: growth alone doesn’t guarantee value: “growth unaccompanied by excess returns creates no value.” If a company is growing fast but only earning its cost of capital (or less) on that growth, shareholders won’t benefit. It’s excess returns (ROIC above the cost of capital) that matter. Damodaran actually argues that the focus on these excess returns has increased over time, because investors learned the hard way that chasing growth without looking at ROIC leads to disappointment. By the way, Professor Aswath writes a newsletter. It is great! I really recommend it: Musings on Markets.
In short, ROIC is a holistic measure of efficiency and effectiveness. It asks: for every dollar of debt and equity sunk into this business, how much after-tax operating profit is it generating? If the answer is “a lot,” that’s a sign of a high-quality business (it’s using capital wisely). If the answer is “not much,” or worse, “nothing at all,” that’s a warning sign.
ROIC cuts through accounting gimmicks and financial engineering because it doesn’t care whether profits go to debt holders or equity holders, as it looks at all capital. This aligns perfectly with what I care about: Is the company creating real economic value? If ROIC is well above the Weighted Average Cost of Capital (WACC), the company is creating value with every dollar it invests; if ROIC is equal to WACC, it’s treading water; if it’s below, value is being destroyed.
Why ROE Falls Short
Early on, I was enamoured with ROE; after all, a 25% ROE sounds like the company is “killing it,” right? But I learned that ROE can be very misleading if you’re not paying close attention. The best analogy I’ve heard is that judging a business by ROE alone is like judging a car’s performance by how fast it can spin its tires, not by how far it actually goes. Sure, spinning the tires might look impressive (high ROE), but it doesn’t tell you if the car is making real forward progress (creating value).
The core problem is that ROE only measures returns to equity, ignoring the other sources of capital. This opens the door to distortion. A company can “juice” its ROE simply by piling on debt. If you take on more debt and use it to buy back stock or reduce the equity base, mathematically, your ROE (Net Income/Equity) can shoot up even if the actual operations of the business haven’t improved at all. It’s a bit of financial magic: the same earnings spread over fewer equity dollars yield a higher ROE. But that doesn’t mean the business itself is performing better. It could actually be more fragile due to all that debt risk. This is why a bank can show a +20% ROE and still be a house of cards, which is exactly what happened with many banks in the mid-2000s.
They flaunted high ROEs, but only because they were sitting on mountains of leverage. When the music stopped in 2008, those equity returns collapsed (and in some cases turned deeply negative), revealing how flimsy the equity base really was.
ROE didn’t warn investors; it rarely does in such cases.
If you want to understand the proper way of using ROE, check out my primer on ROE.
This is where ROIC comes in as a reality check. ROIC looks at the entire capital structure, so it “filters out the financial engineering” and shows you the true operational return. It asks: For all the money entrusted to the company (no matter if it’s borrowed or raised from shareholders), what return is management earning on it through the actual business operations? That’s way more useful for us as investors because we care about the company’s ability to create value with every dollar it controls, not just shareholder equity.
ROE flatters, but ROIC informs.
If a company has an awesome ROE but a lousy ROIC, you can bet there’s some financial leverage trickery or one-time accounting boosts propping up that ROE. On the other hand, a strong ROIC tells me the business itself is fundamentally strong (not just juiced by debt).
That said, there are a few important exceptions. ROE still matters, especially in financials like banks and insurance companies. If you’ve read my deep dive on KINS (an insurance company), you’ve seen me lean on ROE. That’s because in those businesses, the balance sheet is the business. They don’t generate returns from factories, oil wells, or data centers; they generate returns by taking in capital (equity and float) and deploying it into loans, securities, or underwriting risk.
In that setup, leverage is not a trick; it’s the core business model. A bank’s whole purpose is to borrow short and lend long. An insurer collects premiums, invests the float, and pays out claims later. In both cases, ROE captures the economics more directly than ROIC, because debt isn’t just a financing choice, it’s a raw material. You can still look at ROIC for a sense of operational efficiency, but it won’t tell you as much as ROE does in these industries.
So while I use ROIC as my go-to metric across most sectors, I keep ROE in my toolkit for financials. Context is everything: the right metric for the right business model.
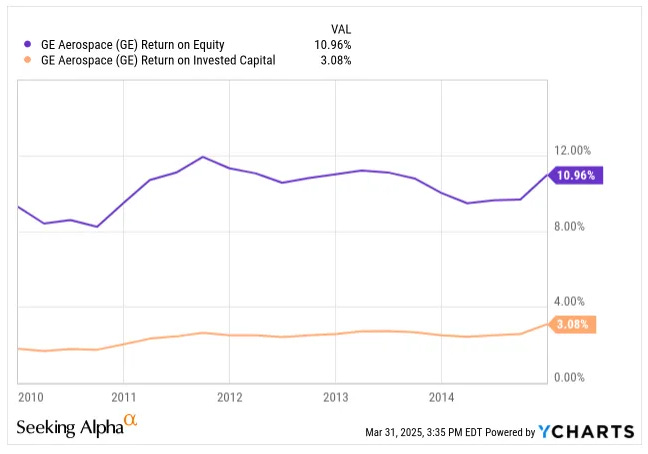
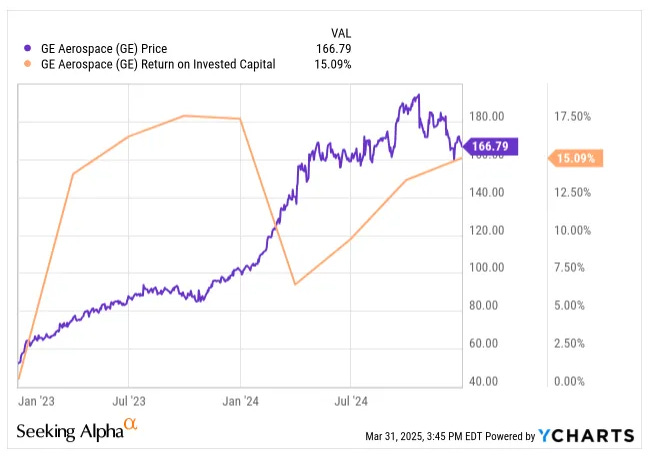
Let me illustrate the importance of ROIC with a real-life throwback: General Electric (GE 0.00%↑) in the 2010s. Back around 2010, GE’s ROE looked solid enough. The company had a respectable ROE, and people assumed the ship was sailing smoothly. But ROIC told a very different story.
GE was plowing huge amounts of capital into various businesses that, in reality, were barely earning above their cost of capital … if at all.
In fact, many of GE’s investments were yielding returns below the cost of capital. Essentially, they were borrowing money at, say, 7% (their cost of capital) to invest in projects that only returned about 3%. That’s like taking out a loan with 7% interest and putting the cash into an investment that pays 3%, you don’t need an MBA to see that’s a value-destroying move.
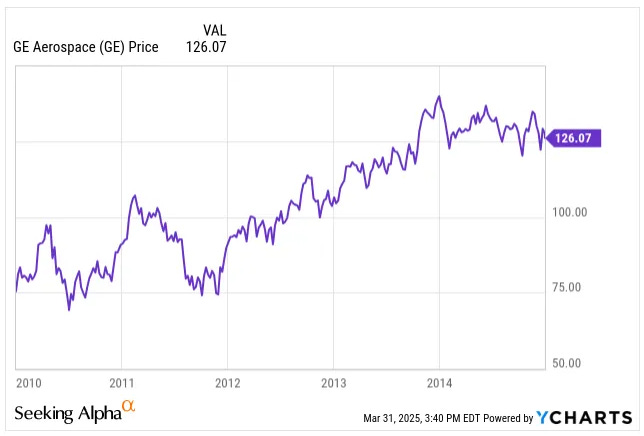
But ROE alone didn’t flag this problem because GE’s equity shrank due to buybacks and other maneuvers, keeping ROE's appearance decent. Investors who only looked at ROE missed the warning signs. GE’s share price actually climbed from around $75 in 2010 to $126 by 2014, as people were still buying the growth story.
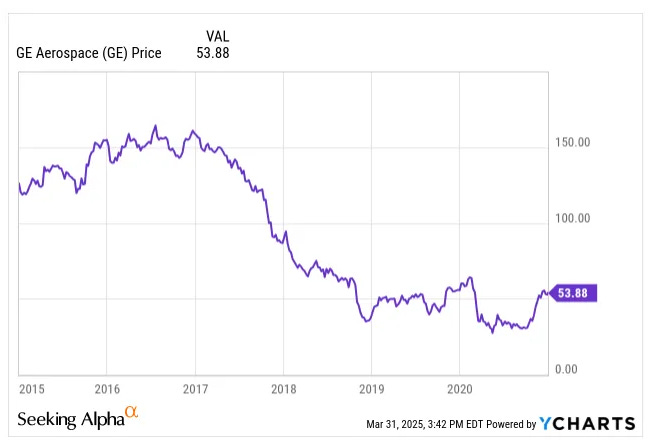
But as always, share prices eventually follow fundamentals. By 2019, GE’s stock had plunged to about $50.
The underlying value destruction (low ROIC relative to WACC) eventually came home to roost.
The ironic end to that tale?
Once GE finally started restructuring and generating a ROIC above its cost of capital later on, the market noticed and the stock was rewarded accordingly.
It was a hard lesson that chasing high ROE without checking ROIC is a recipe for unpleasant surprises.
The GE saga cemented in my mind why ROIC matters so much. It reinforces the idea that a company can only create long-term shareholder value if it earns above its cost of capital on its investments. High ROE achieved by shrinking equity or taking on debt is a bit of financial sleight of hand; high ROIC, on the other hand, is usually a sign of true operational excellence.
Breaking ROIC Down to Basics
By now, we know what ROIC is and why it’s valuable. But one of the big challenges (and opportunities) with ROIC is understanding what drives it.
Early in my career, I would see a company’s ROIC number and think of it as this abstract figure that was either “good” or “bad.” With experience, I learned to break ROIC down into tangible operational metrics. This was a game-changer: it allowed me to see which levers are moving ROIC and by how much.
At its simplest, you’ll often see it like this:
This formula itself can be expanded step by step to reveal the drivers. One handy trick is to multiply and divide the formula by revenue (sales). By doing that, you introduce two new ratios: EBIT/Sales (which is operating profit margin) and Sales/Capital (which is capital turnover). The formula then looks like:
This is a more intuitive breakdown: how profitable each sale is (EBIT margin), times what fraction of profits you keep after tax, times how efficiently you generate sales from your capital base.
In plainer terms, ROIC is shaped by:
Profitability: are you selling your product/service at a healthy margin?
Tax and other drags: how much do you keep after taxes (and royalties or similar costs)?
Capital intensity: how much capital do you need to support a given level of sales?
All three pieces multiply together to determine ROIC.
We can keep going.
In different industries, it makes sense to break things down further into industry-specific drivers. Let me share a full example that I often use: an upstream oil company.
Oil exploration & production is a great case study because it’s a capital-intensive business with a few very clear operational levers (and it’s also an industry where a small change in assumptions can swing ROIC massively).
For an upstream oil company, I would break ROIC into the following drivers:
EBIT margin: Which, in this context, comes from Gross Profit and SG&A. Essentially, how much of each dollar of oil sales is left after direct costs and overhead. Gross profit is heavily influenced by operational efficiency (e.g., cost to extract a barrel) and, of course, the price of oil. SG&A is the other part, which we can express per dollar of revenue. In our example, let’s say SG&A is a steady 7% of revenue.
Tax (and royalty) efficiency: The percentage of profit the company keeps after paying taxes and any royalties to governments. If the effective tax+royalty rate is 25%, then tax efficiency = 1 - 0.25 = 75%.
Oil price per barrel: This drives revenue. We can think of it as Sales per unit of production. If oil is $50 per barrel versus $80, that’s a big difference in sales. (In fact, oil price affects gross margin too, because higher prices often improve margins for producers as their costs don’t rise as fast as the price, at least up to capacity limits.)
Production volume per well: How many barrels of oil does each well produce in a year? More output per well means more sales for the same capital investment. Our example assumes each well produces 100 barrels per day, roughly 36,000 barrels per year.
Capital invested per well: How much it costs to drill and equip a well (the capital expenditure). We’ll say $10 million per well on average. This factor, combined with production per well, tells you how capital-intensive it is to produce a barrel of oil.
We can string these together. In fact, the full expanded equation for ROIC in this oil example looks like:
It seems like a lot, but it’s just multiplying by clever forms of 1 (sales/sales, production/production, wells/wells) to unpack the economics.
By breaking ROIC down this way, you see how every operational lever from pricing, production per well and capital per well contributes to overall returns. It becomes a cheat sheet of what really matters. If you want to forecast or improve ROIC, these are the knobs to turn.
Now let’s plug in some realistic numbers to see how it all comes together. We’ll consider two scenarios for oil prices to show the range: say $50 per barrel vs $80 per barrel.
At $50 oil, perhaps our company’s gross profit margin is around 60%, and at $80 oil, the gross margin might rise to 70%.
We already set SG&A at 7% of sales, so at $50 oil, EBIT margin = 60% - 7% = 53%. At $80 oil, EBIT margin = 70% - 7% = 63%.
Tax+royalty is 25%, so after-tax efficiency is 75% in both cases.
Each well produces 36,000 barrels/year, so yearly revenue per well is $1.8 million in the first scenario, and $2.88 million in the second.
Each well costs $10 million.
Now, crunching ROIC:
At $50 oil: ROIC = 53% EBIT margin x 75% tax efficiency x $50 per barrel x 36,000 barrels per well / $10 million per well = ~7.2%.
At $80 oil: ROIC = 63% x 75% x $80 x 36,000 / $10 million = ~13.6%.
That’s a huge swing, basically doubling ROIC with a $30 increase in oil price. This range lines up with what we expected: depending on your outlook for oil prices, ROIC could swing between about 7% and 14% for the same company. The low end (7%) is below most companies’ cost of capital, which might spell trouble (value destruction), while the high end (14%) is well above a typical cost of capital, indicating strong value creation.
This example illustrates exactly why a small change in key drivers can mean the difference between a “great investment” and an “oops” in a capital-intensive commodity business.
The takeaway is that ROIC is not some black box number. You can break it apart to see what’s driving it. Is it high because of fat profit margins? Or efficient use of capital (high turnover)? Or maybe a low tax burden? Conversely, if ROIC is low, you can diagnose the culprit: maybe margins are thin (competitive industry), or the business guzzles capital for little output (low turnover).
By decomposing ROIC, I analyze businesses in a more granular way. It also helps me test assumptions. For example, in the oil company case, if someone is forecasting a sustained 15% ROIC, I’d better see very rosy assumptions (like consistently +$80 oil, great productivity, etc.), otherwise that forecast is suspect.
ROIC and Valuation: Connecting to EV/IC
ROIC isn’t just an abstract efficiency metric; it has direct implications for a company’s valuation.
One of the most powerful relationships to understand is between ROIC, WACC, and the Enterprise Value to Invested Capital multiple (EV/IC).
This sounds technical, but it’s basically the valuation ratio that tells you how many dollars of enterprise value the market is placing on each dollar of invested capital in the business. If you have a handle on ROIC and WACC, you can get a sense of what a fair EV/IC multiple should be.
In fact, there’s a neat formula for a no-growth scenario (i.e. assuming the company will just maintain current profits without growth):
This formula says that if a company’s ROIC exactly equals its WACC, then EV/IC = 1. The enterprise value would equal the invested capital, meaning the market values the business at just the capital put in (no premium or discount).
If ROIC is greater than WACC, EV/IC will be greater than 1 (the business is worth more than its book capital, reflecting the present value of those excess returns).
Conversely, if ROIC is less than WACC, EV/IC will be less than 1 (the market discounts the invested capital because the company isn’t earning its keep).
This makes intuitive sense, right?
If a company earns more than it costs to fund it, you’d pay a premium for that stream of value creation. If it earns less, you’d only buy at a discount (if at all). In practice, the EV/IC multiple in the market tends to track the ROIC/WACC ratio closely over time.
Companies with sustainably high ROIC often trade at high multiples of their invested capital, whereas chronic underperformers languish at low multiples (or become takeover bait for restructuring).
Keep in mind that if a company is growing, the formula gets a bit more involved (with growth g, the formula becomes EV/IC = (ROIC – g) / (WACC – g) for a stable-growth scenario). But the core insight remains: it’s the spread between ROIC and WACC that creates (or destroys) value. A company that can reinvest at a high ROIC will create a lot of value through growth, and its EV/IC will be even higher.
In contrast, growth is actually bad for a low-ROIC company: pouring more money into projects that don’t beat the cost of capital will destroy value, and smart investors won’t pay up for that. This is why two companies with the same growth rate can have very different valuations: the one with higher ROIC (excess returns) will command a premium multiple.
I’ve made it a habit to keep track of long-term ROIC and WACC for dozens of companies, plotting their ROIC-WACC spreads against their EV/IC multiples. When a stock’s EV/IC multiple drifts too far from what ROIC/WACC would imply as “fair,” it’s a signal to dig deeper. Maybe the market is overly pessimistic or optimistic about future ROIC, or maybe there’s some risk not captured in WACC.
This approach has been incredibly useful in identifying mispriced opportunities. It adds a quantitative backbone to the age-old investing question: Is this company’s stock cheap or expensive relative to its quality? Here, quality is encapsulated by ROIC (relative to WACC).
To cement this concept, imagine a company that has $100 of invested capital. If its WACC is 10% and it earns exactly $10 after-tax on that capital (ROIC = 10%), it’s just earning its keep. You’d expect the business to be worth roughly its $100 capital (EV/IC ~1.0). But if it earns $20 (ROIC = 20% on that same capital with WACC 10%), it’s creating $10 of excess profit on that $100 every year. You’d rightly pay more than $100 for that!
In fact, the simple formula says it might be worth about $200 (EV/IC ~2.0 in a no-growth perpetuity scenario). Conversely, if it only earns $5 (ROIC = 5%, below the 10% cost), it’s destroying $5 of value per year per $100. You wouldn’t pay full price for that and might only offer, say, $50 or so (EV/IC ~0.5).
In practice, markets anticipate changes, so they might price a turnaround or decline, but understanding this relationship anchors your valuation reasoning in economic reality. It guards you from overpaying for “growth” that isn’t truly profitable growth, and it helps you spot cases where the market underappreciates a company’s ability to create value.
High ROIC and Moats: The Competition Factor
Whenever you see a company sporting a very high ROIC, your next thought should be: “How and for how long can they sustain this?”
This is where competitive advantages, or “moats,” come into play.
A high ROIC is like a magnet for competition. If there’s nothing special preventing competitors from coming in, they will, and they’ll drive those returns down over time. Think of ROIC as a lake of profit; if the lake is much higher than the surrounding terrain (the average cost of capital), water (competition) will flow in until an equilibrium is reached. Only a sturdy dam (a moat!) can keep the water level high.
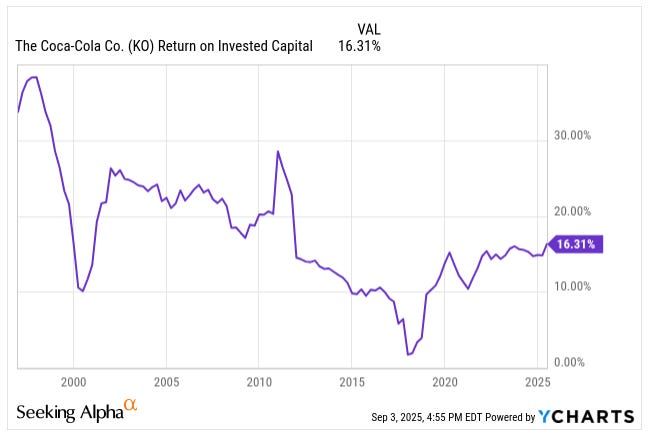
I’m not going to delve into moats here (If you need a refresher on moats, read my Moats 101: The Ultimate Guide to Competitive Advantages in Investing). Moats can be things like strong brand identity (Coca-Cola), network effects (Facebook), cost advantages (Southwest Airlines in its heyday), high customer switching costs (enterprise software), patents, regulatory licenses, etc. The effect of a moat is that it prevents or delays the natural competitive erosion of ROIC.
Joel Greenblatt alluded to this, noting that to earn a high return on capital even for one year suggests there’s “something special” about that company’s business; otherwise, competition would have already pushed returns down to lower levels. A company with a true moat can fend off competitors and maintain ROIC above the industry average for many years.
Why does this matter for us?
Two reasons: quality and duration.
First, a company with a moat is usually a higher quality business, and it can sustain high ROIC without succumbing to margin pressure. Second, and often overlooked, is the duration of excess returns. If I find a company that currently has ROIC of, say, 25% and WACC of 10%, I get excited, but I also need to ask, how long can they keep this up? If it’s easy for others to copy their product or undercut their prices, that ROIC will shrink fast as competitors gnaw away at it. On the other hand, if there are significant barriers to entry or durable advantages, the company might be able to maintain an ROIC-WACC spread for a decade or more.
The importance of moats is directly tied to valuation. If a company has a high ROIC but no moat, you have to be cautious in valuing it because you should assume ROIC will fade toward WACC over time. This fading can drastically reduce the present value of future cash flows. It’s essentially saying: “Enjoy it while it lasts, because capitalism will have its way.”
On the flip side, if a company has a solid moat, you can be more justified in modelling elevated ROIC for longer, which can support a higher valuation. However, and this is key, even the best moats usually don’t last forever. Competition, technological disruption, or market saturation eventually erodes excess returns in most cases.
Sometimes it takes decades (look at how long high-ROIC companies like Coca-Cola (KO 0.00%↑) sustained their advantages), but eventually things tend toward equilibrium.
We should be realistic: assuming a company can earn huge excess returns indefinitely is dangerous.
I often say that in the long run, ROIC tends toward WACC for most businesses, especially in mature industries. That’s basically the economic version of “what goes up must come down,” unless prevented by strong forces. So when I see a high ROIC without clear barriers to entry, I treat it as temporary. Perhaps it’s a cyclical peak or a niche that will attract entrants. Conversely, when I see a high ROIC with identifiable moats, I get more interested, but I still remain conservative in how far into the future I project those high returns.
For example, suppose a company has a new patented technology and currently earns a 30% ROIC. Patent protection is a legal moat, but it expires eventually. I might forecast that ROIC will stay high until the patent expiry, then start to fall off as generics or competitors come in.
Another company might have an entrenched network (like an exchange or a social media platform). That can be a wide moat, but even networks can erode if something better comes along (remember MySpace?). So you might assume ROIC gradually declines over time from its lofty level toward industry norms. The presence of a moat delays the inevitable. Think of it as allowing a company to earn excess returns for longer than the average firm.
To tie this back to Greenblatt’s Magic Formula and Buffett’s philosophy: the ideal investment is a company with a high ROIC and a strong moat, bought at a reasonable price. High ROIC alone might be fleeting, but high ROIC with a moat is a potent combination for long-term compounding. But even then, be mindful of the question: “How long will this moat hold?”.
In summary, ROIC tells us how good a business is; the moat tells us how long it can stay that way. A high ROIC with no moat is like a castle with no walls. Enjoy it now, but invaders are coming.
A high ROIC with a wide moat is the dream scenario: the company can keep minting value year after year, and those returns will be more defensible. Recognizing the difference helps us avoid overpaying for “ephemeral excellence” and positions us to capitalize on truly exceptional, durable businesses.
ROIC in the Long Run: Terminal Value and DCF Assumptions
Let’s shift to how ROIC factors into one of the most important (and tricky) parts of valuation: the terminal value in a DCF analysis. The terminal value is the estimated value of a business beyond the explicit forecast period, and it often represents a large portion of the total DCF value (especially for growth companies). Getting it wrong can massively skew your valuation. A common pitfall here is being overly optimistic about future ROIC, implicitly baking in the assumption that a company will keep earning excess returns forever. This is where all the discussion of moats and competitive dynamics comes to a head.
When projecting cash flows into the future, especially into a “stable growth” or terminal period, we have to make an assumption about what the company’s ROIC will look like in the long run. The safest (and most conservative) assumption is that in the very long term, ROIC will converge to WACC, meaning the company eventually becomes a “normal” company with no excess returns.
If you assume ROIC = WACC in the terminal state, then any growth beyond that point creates no additional value (because the company is just growing at break-even returns). In a DCF formula, if ROIC = WACC in perpetuity, the terminal value simplifies significantly; essentially, the future growth doesn’t add value by itself, it just keeps value flat. Damodaran emphasizes this: if you assume no excess returns in perpetuity, the growth rate in the terminal period becomes irrelevant to value. The math works out such that the present value of any growth is exactly offset by the additional capital needed to support that growth when ROIC = WACC.
In practical terms, that means if you think a company will eventually lose its special edge, you shouldn’t give it credit for value-creating growth forever. Growth will just make it bigger, not more valuable per se, once excess returns are gone.
However, what if you believe the company will still have some excess return even in the stable phase? Perhaps it will maintain a small moat or operational edge. It’s not unreasonable for some exceptional firms to earn, say, a few percentage points above their cost of capital for a very long time (maybe not forever, but for a long time). In those cases, you might assume a terminal ROIC that’s slightly higher than WACC, but you have to be very careful here. Damodaran suggests that any assumption of perpetual excess returns should be modest (on the order of 4-5% or less) and well-justified.
Another way to handle it is to explicitly model a fade period: you forecast ROIC and growth over, say, 10 or 15 years with ROIC gradually trending down from its current high level toward a lower stable level (maybe equal to WACC or slightly above). McKinsey’s Valuation book often advocates for this approach, gradually “fade” returns and growth to industry or economy norms by the terminal year. This avoids a sudden, unrealistic drop and reflects the idea that competition’s effect is gradual. The key is what you assume as the endpoint. If you end with ROIC = WACC, you’re effectively saying the moat is completely gone by then. If you end with ROIC > WACC, you’re saying some advantage remains. The latter will give you a higher terminal value, but you’d better have a strong rationale for it.
A rule of thumb I use is: if I do assume any excess return in perpetuity, I keep it small. For example, maybe assume ROIC ends up 1-2% above WACC at most, unless I’m dealing with a truly extraordinary monopoly-like business like TSMC (TSM 0.00%↑). And I’ll often run a sensitivity or alternate scenario with ROIC = WACC to see how much difference it makes. (Often, it makes a big difference, which is sobering.)
The formula for terminal value (with growth g) in a free cash flow to firm model is typically:
There’s an equivalent expression:
Assuming a constant ROIC and growth g beyond. If terminal ROIC is higher than WACC, the numerator is positive even after subtracting g, and that boosts value. Essentially, you’re capitalizing an infinite series of excess returns. If I instead assumed ROIC drops to 10% by the terminal year (equal to WACC), the formula would reduce to Invested Capital (because ROIC - g = WACC - g, making the fraction = 1). The difference in those two assumptions can be billions of dollars for a big company! So we have to be very deliberate here.
One more thing to watch: terminal growth rate assumptions. Often, people push the growth rate a bit higher to get a juicier terminal value, but if you’re also assuming high ROIC, you may be double-counting optimism. If a firm can grow at a high rate and maintain high ROIC, that’s extremely valuable, but you can’t just assume that without justification. Cap terminal growth at something reasonable (like no more than the economy’s growth rate, so maybe 2% for a mature company in real terms, plus inflation if you’re in nominal terms).
And importantly, make sure the implied reinvestment makes sense: high growth requires reinvesting a lot of capital if ROIC is finite. For example, if you think a company can grow at 5% forever at 15% ROIC, then it must reinvest 33% of its after-tax operating profit (because growth = ROIC × Reinvestment Rate). Sometimes people plug a growth number but forget to link it to reinvestment and ROIC, ending up with inconsistent DCFs. Always check that the math and economics line up: growth, ROIC, and reinvestment are inextricably linked.
In summary, when dealing with the terminal value, err on the side of caution with ROIC assumptions.
Conclusion: ROIC as a Tool for Outsized Returns
Standing back, it’s clear that ROIC is more than just another metric; it’s a mindset. Embracing ROIC fundamentally changed how I analyze companies and make investment decisions. It forces you to think like an owner of the whole business, not just a stock picker looking at this quarter’s earnings. You ask the big questions: Is this business truly creating value? Where is it allocating capital, and what return is it getting? Will those returns stick?
By focusing on ROIC (and the spread over WACC), you…
cut through a lot of noise,
become skeptical of growth for growth’s sake and instead zero in on the quality of growth,
learn to spot the telltale signs of financial engineering versus real operational performance.
Adopting this ROIC-centric approach has paid off in my own investing journey. Since I seriously started analyzing ROIC and WACC and making them core to my investment process more than a decade ago, my portfolio has returned over 3,500%, that’s about 8.4x the S&P 500’s performance over the same period.
And more recently, since launching this investment newsletter in October 2024, the portfolio has continued to deliver. In less than a year, it has generated returns 2.2x the market’s returns.
The point of sharing this is not to brag, but to emphasize the power of a disciplined ROIC framework. By keeping an eye on ROIC and WACC, and pouncing when the market severely misprices a company’s ability to create value, I was able to find opportunities that others glossed over.
I didn’t beat the market by chasing the latest fads or speculating on macro swings; I did it by systematically analyzing businesses’ returns on capital and buying when they were undervalued relative to their ROIC potential. It’s a strategy rooted in fundamental common sense: pay a fair or cheap price for companies that can consistently earn high returns on their capital.
Before I wrap up, let me leave you with a practical tip. Next time you research a company, do three things:
Look up its ROIC (and if possible, its historical ROIC trend), and
Find out its estimated WACC.
Then compare the two.
This simple exercise can be incredibly illuminating. If ROIC is well above WACC, dig into why.
And if you want to level up, calculate the company’s EV/Invested Capital multiple and see if it roughly corresponds to ROIC/WACC, as theory suggests. Discrepancies can reveal market expectations.
Happy investing!


