


Hello fellow Sharks,
Friday’s rebound put us back in the green after a rough Thursday. This week, I’m digging into CDE’s record cash flow and why it still belongs on my trim list. If you want to skip straight to the numbers, jump to the Portfolio Update.
Last week, a portfolio company reported earnings.

The position is up 64% since I picked it in May last year.

In the coming days, I’ll share my review of the results and what I plan to do next.
Next week, there are no portfolio earnings scheduled, just two dividend events. That gives me time to work on the September Stock Pick.
In the Thought of the Week, I go over CDE’s Q2 earnings results and what we should do with the position.
Enjoy the read, and have a great Sunday.
~George
Table of Contents:
Thought of the Week
CDE Q2 2026: Record Cash Flow, but HOLD Still Fits
Record cash flow supports HOLD, but the valuation puts CDE on my trim list.
Coeur Mining [CDE 0.00%↑] generated more cash in Q2 than at any other point in its history. It also cut its production and cash-flow outlook. Both deserve attention.
The first full quarter with New Afton and Rainy River showed what the enlarged portfolio can earn. It also exposed how much work remains before the Canadian mines deliver the expected production rates. My recommendation remains HOLD, but CDE enters my trim list.
TLDR
Q2 FCF reached $388M, with $1.05B of cash and $347M of net cash at June 30. CDE can fund the operating improvements without an immediate financing problem.
FY2026 FCF guidance fell from $2B to $1.5B. Lower assumed gold and silver prices explain part of the reduction; slower Canadian production and additional Rainy River spending explain the rest.
New Afton’s cave ramp-up looks principally like a timing issue. Rainy River requires extra equipment, labour and infrastructure, which warrants more caution about future costs.
My updated price target is $19.47, using $5,000 gold, $75 silver, $5 copper and a 5% discount rate for producing mines. NAV before the growth premium is $12.93. The target is about 5% below the market price of $20.58, leaving me at HOLD with CDE on my trim list.
What RankedStocks is picking up
CDE scores 62 on RankedStocks, with growth doing most of the lifting. The valuation and outlook scores give me reasons to remain selective.
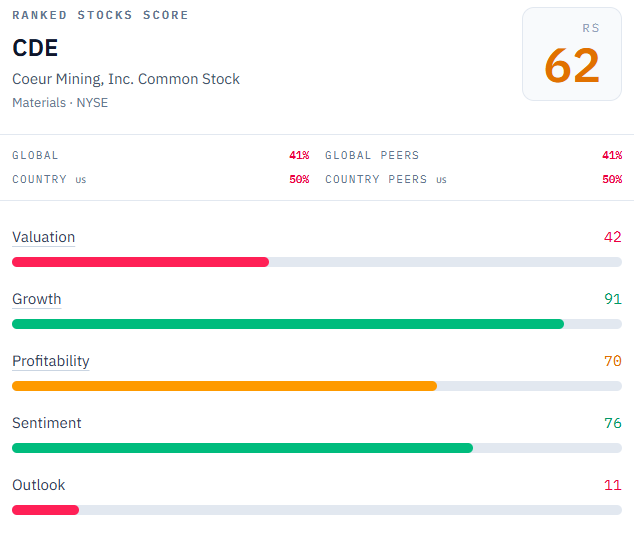
The growth score of 91 reflects strong revenue, operating earnings and cash-flow growth.
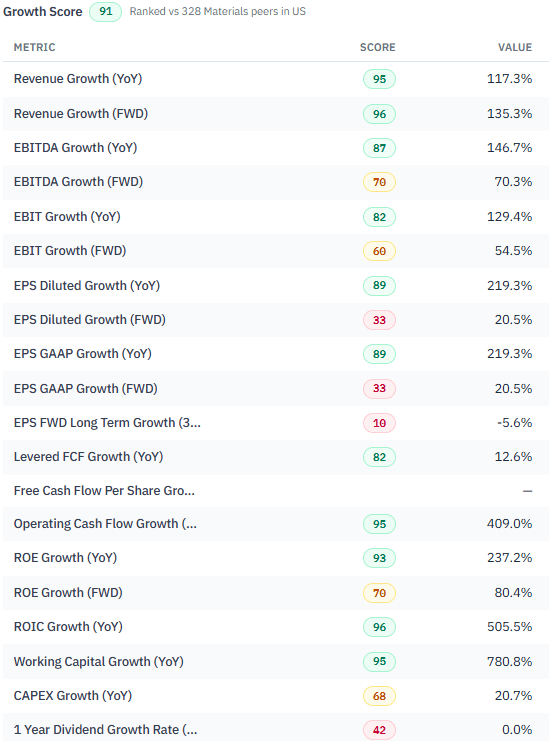
A large acquisition makes those comparisons look impressive, however. We became CDE shareholders through our New Gold [NGD] holding when the acquisition closed in March. I had rotated from IAMGOLD [IAG 0.00%↑] into NGD in June 2025. Receiving newly issued CDE shares means the larger business needs to deliver better results per share.

Profitability is encouraging, particularly the operating margins and cash conversion.
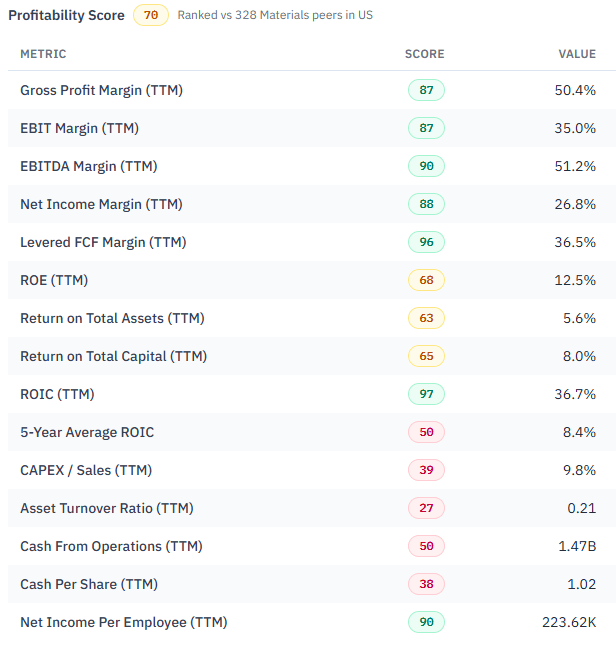
Still, return measures can be distorted while the acquired earnings and the enlarged asset base enter the trailing calculation at different times. I would give the combined business several quarters before treating its current return-on-capital metrics as a settled operating record.
The valuation score of 42 gives me less comfort. CDE trades at 18.8x forward earnings and 12.3x forward EBITDA. The low PEG ratio benefits from a surge in acquisition-driven growth, which is unlikely to repeat indefinitely. The broader multiples suggest Mr. Market already expects a good deal of operating progress.
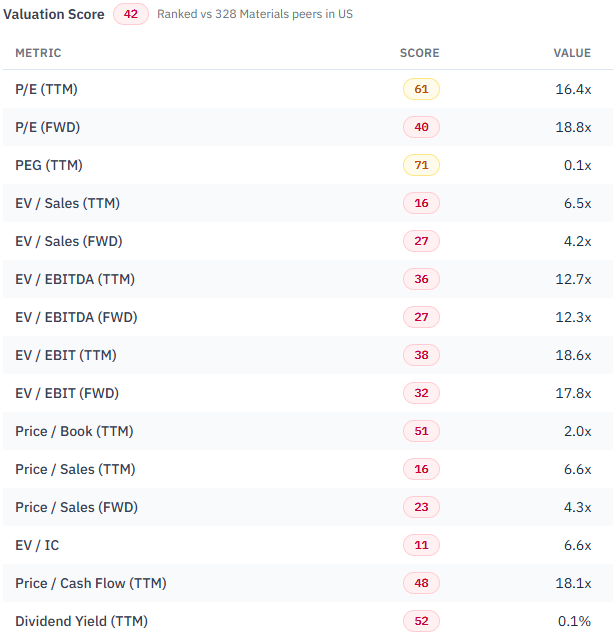
The outlook score of 11 in the factor panel below is another reason for caution. The Canadian production cuts show where expectations have weakened. The composite score does not establish which estimates changed or by how much, so I would not treat it as a forecast of the next earnings report.
RankedStocks is free, and you can use the company research tools to compare these factors with your other holdings.
The original thesis, tested against Q2
In my deep dive, the attraction was a larger North American portfolio emerging from a heavy investment period, with stronger cash generation and opportunities to extend mine lives. The position came through the New Gold acquisition.
Cash generation and financial strength: confirmed. CDE has demonstrated that the seven-mine portfolio can produce substantial cash while funding investment and returning capital. The size of the cash balance gives management room to address the operating gaps.
Production ramp-ups: challenged in the near term. The Canadian assets have fallen behind the inherited schedule. The economics may still be attractive, but delayed ounces arrive later and have a lower present value. Additional costs can reduce that value further.
Exploration and mine-life extension: progressing. K-Zone, Palmarejo’s Eastern District and Silvertip remain credible avenues for future growth. They still need drilling, studies and investment before they can be treated as producing assets.
Valuation: less comfortable. After converting the NGD cost basis to CDE, the position is up 82%.

Record cash flow, with an accounting complication
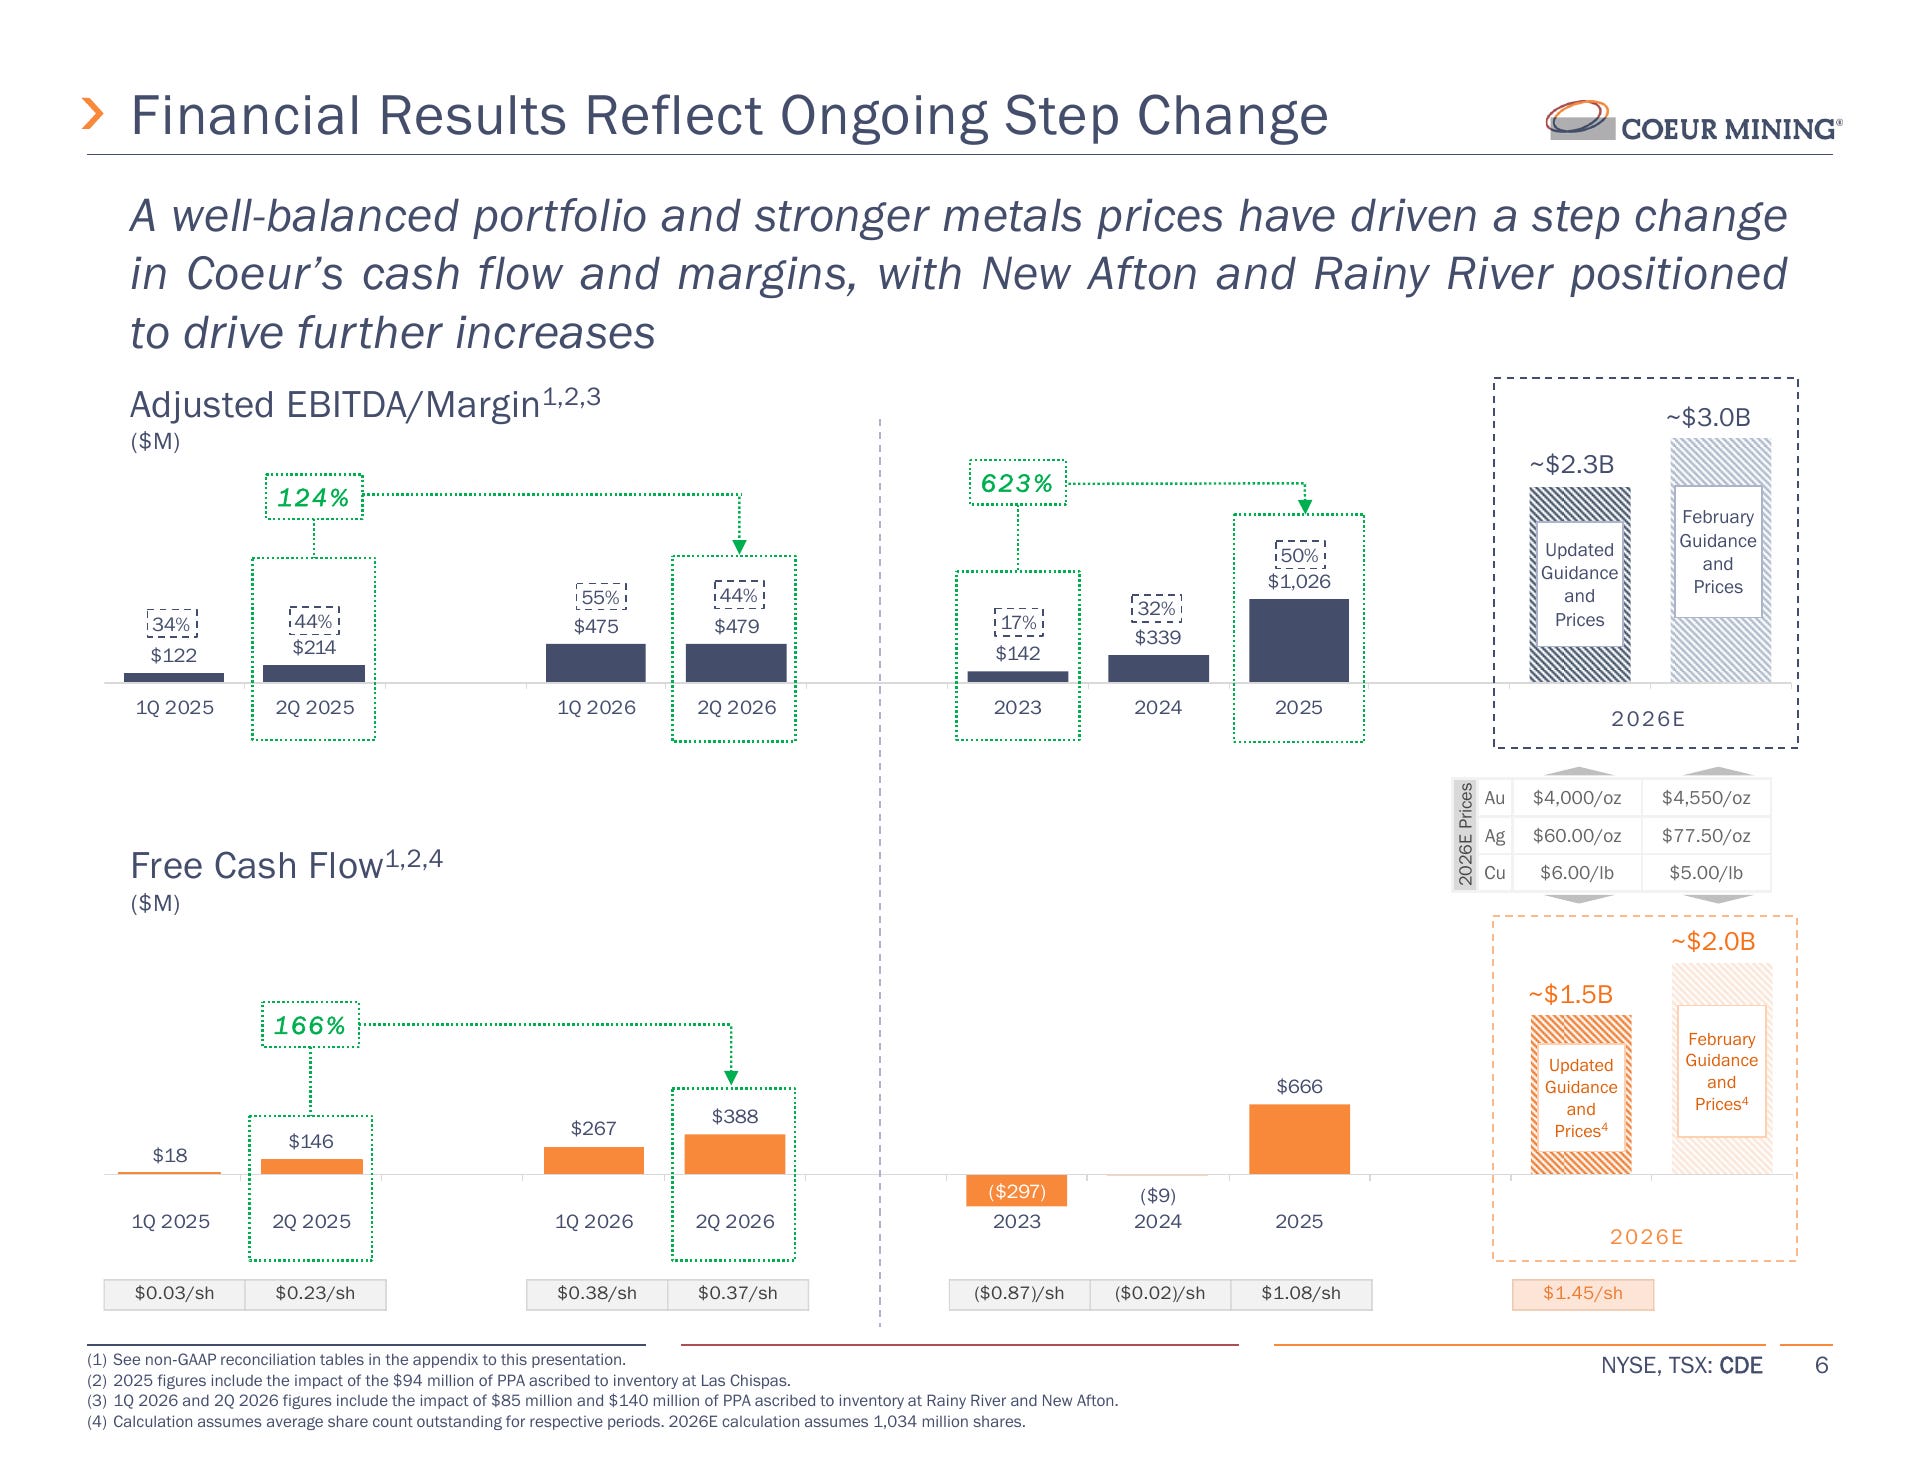
CDE reported $1.09B of revenue, $478M of adjusted EBITDA and $388M of FCF. The cash result was the strongest part of the release: FCF increased 45% from Q1 despite lower realized gold and silver prices.
The enlarged portfolio explains much of the revenue increase. Revenue rose 126% y/y, while GAAP EPS increased from $0.11 to $0.12. The weighted average diluted share count rose substantially after the acquisition.
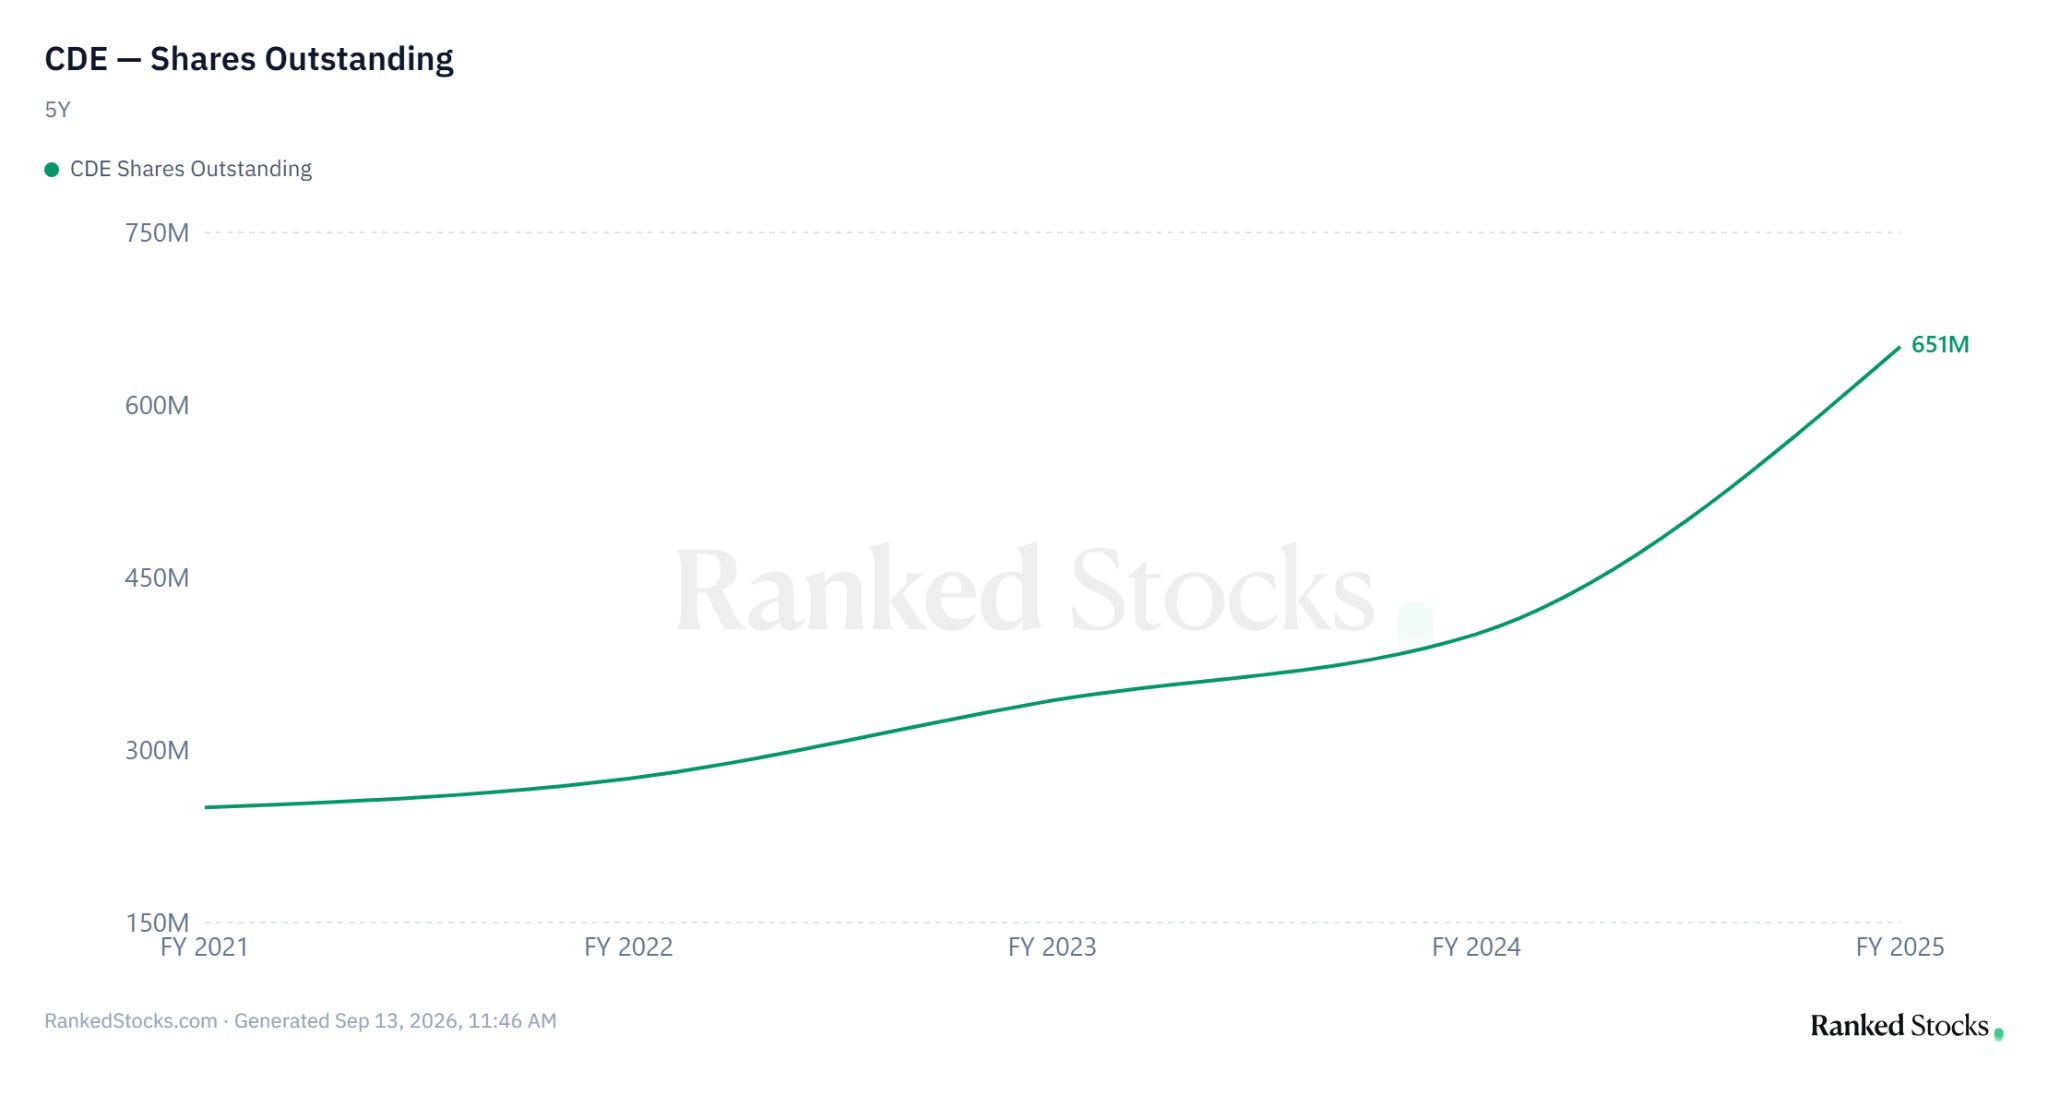
Revenue growth by itself gives an incomplete picture of the benefit to each share.
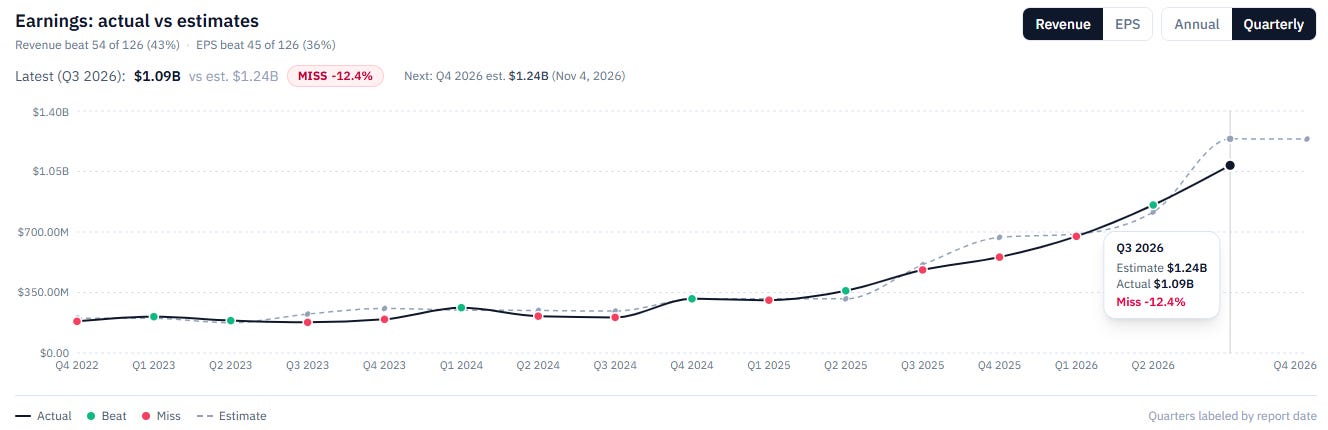
Adjusted EPS of $0.12 also fell short of consensus.
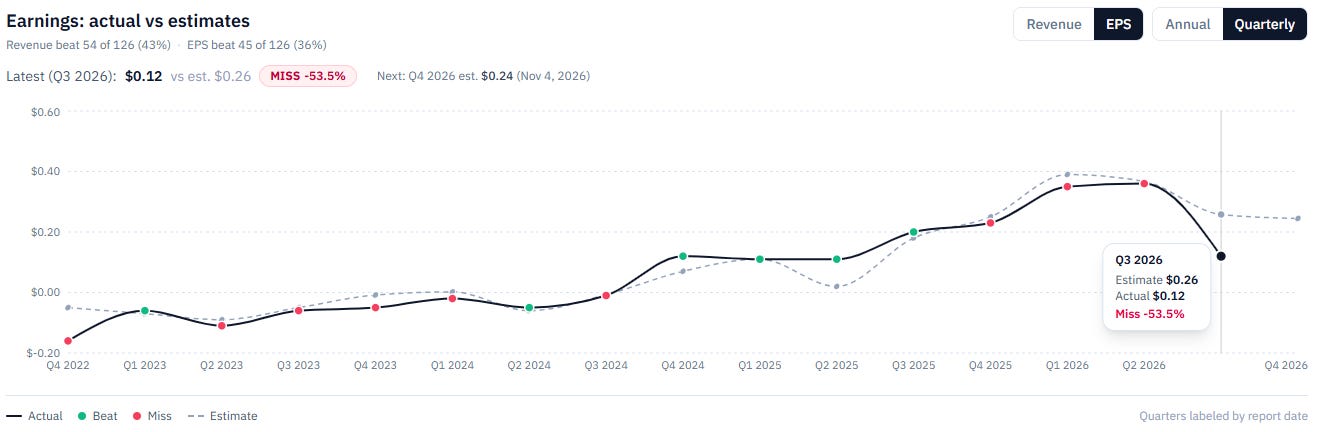
Management identified $140M ($0.10 per share), of non-cash purchase-price accounting associated with acquired inventory. That expense remained in adjusted EBITDA, adjusted earnings and reported costs applicable to sales.
The inventory adjustment represents the fair-value uplift assigned to inventory when CDE bought NGD. As that inventory is sold, the uplift flows through expenses. It is not a fresh $140M cash operating outflow in Q2. Equally, adding it back to the $388M of FCF would count a benefit twice.
Management expected the remaining approximately $38M to run through Q3. Reported earnings should become easier to interpret after that.
Why the guidance cut matters
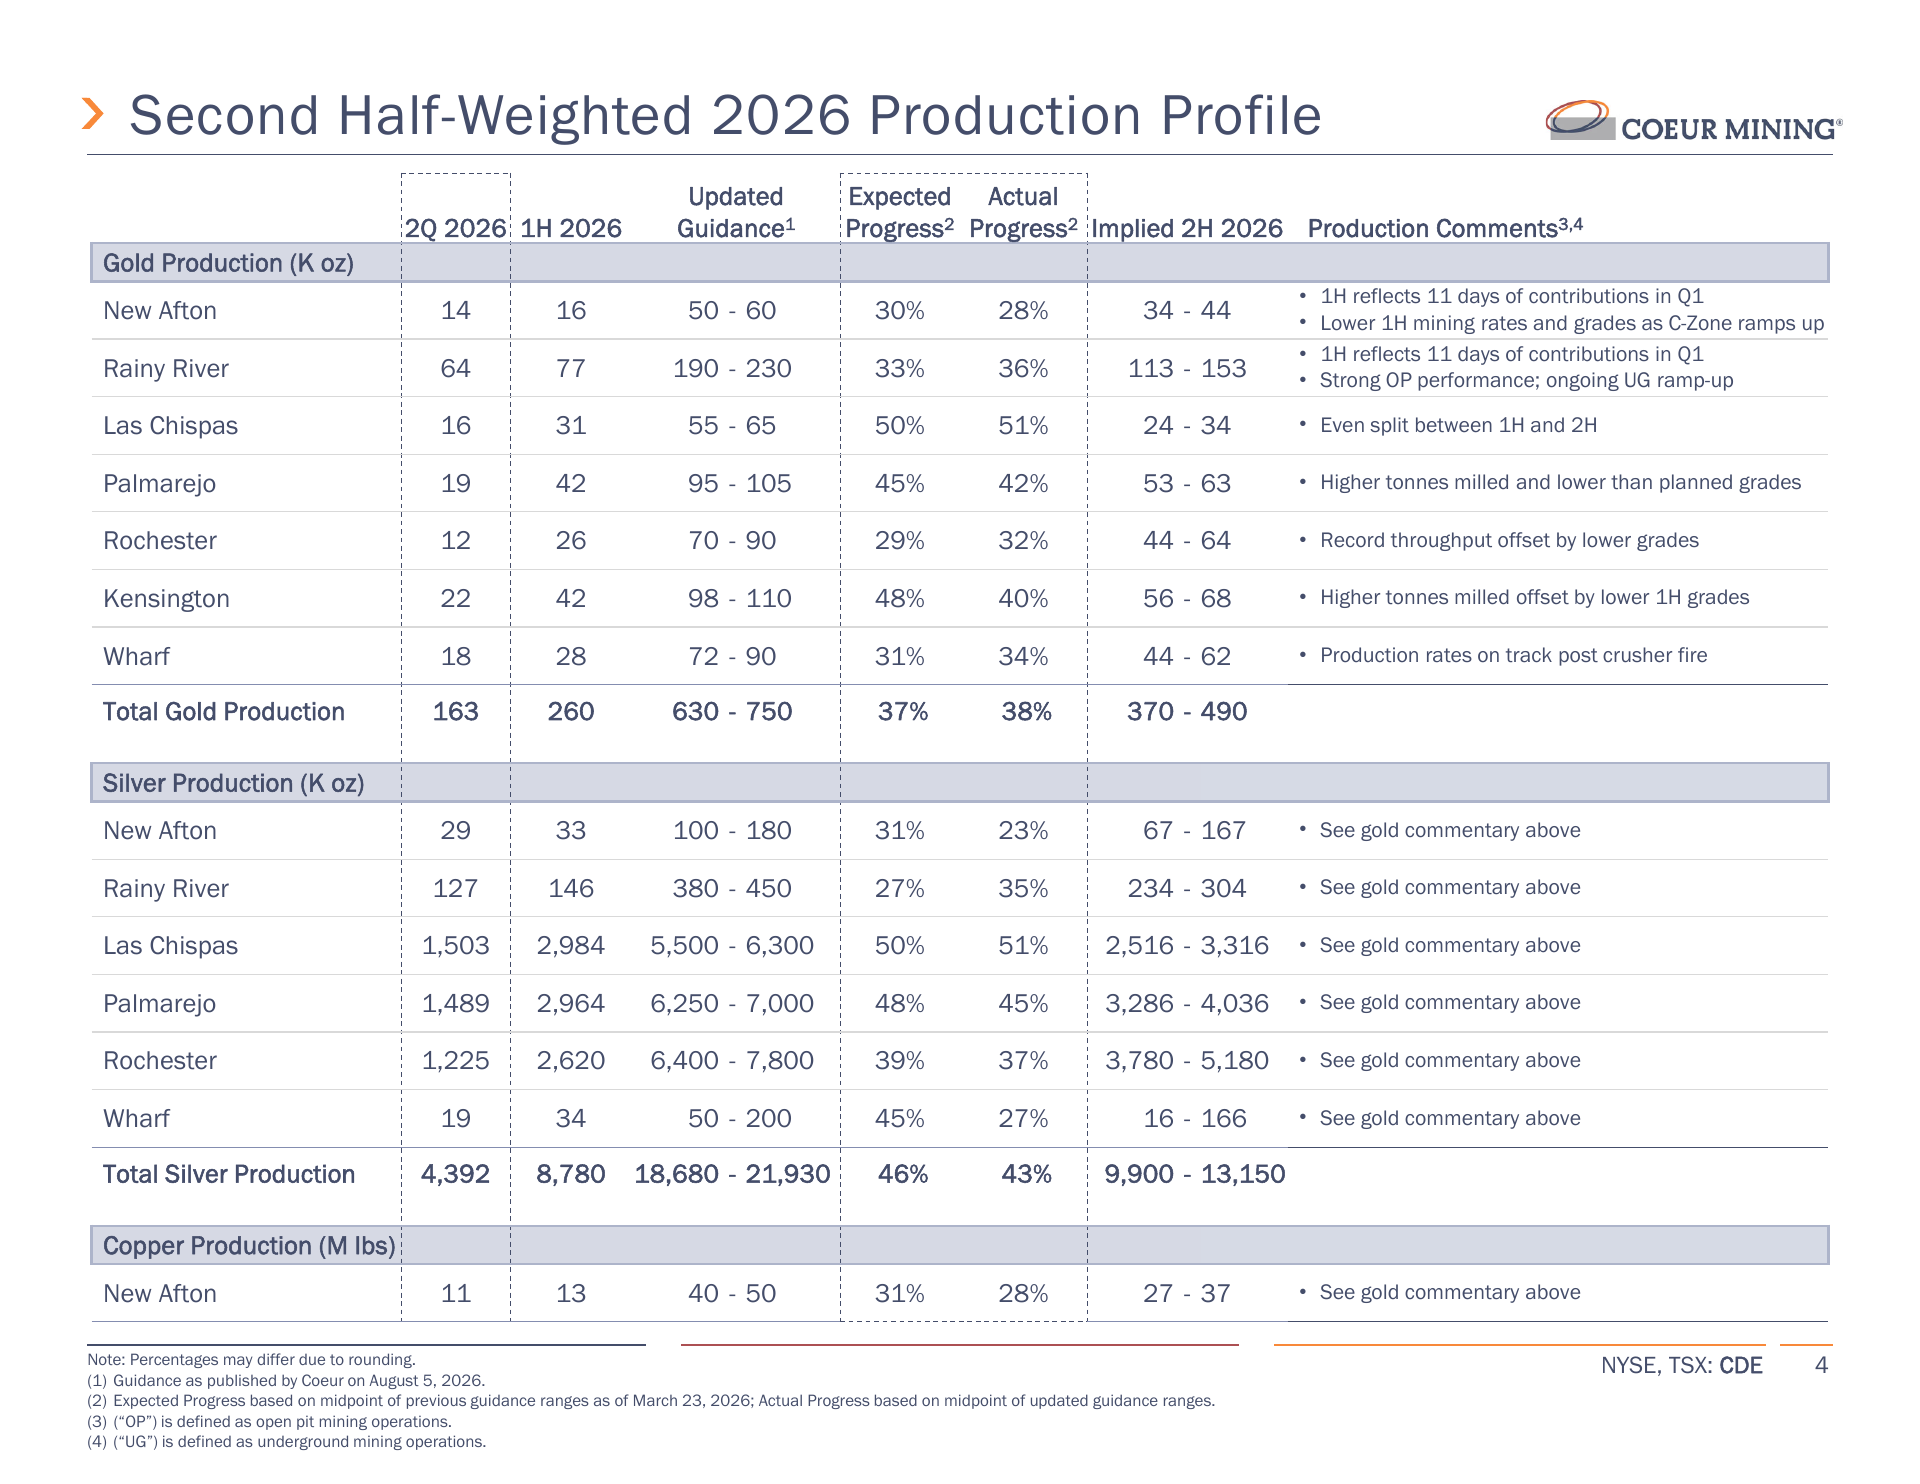
The updated gold guidance midpoint fell about 8%, while the copper midpoint fell about 22%. Silver guidance was largely unchanged, and the five legacy operations retained their production ranges. The reductions were concentrated in the two newly acquired Canadian mines.
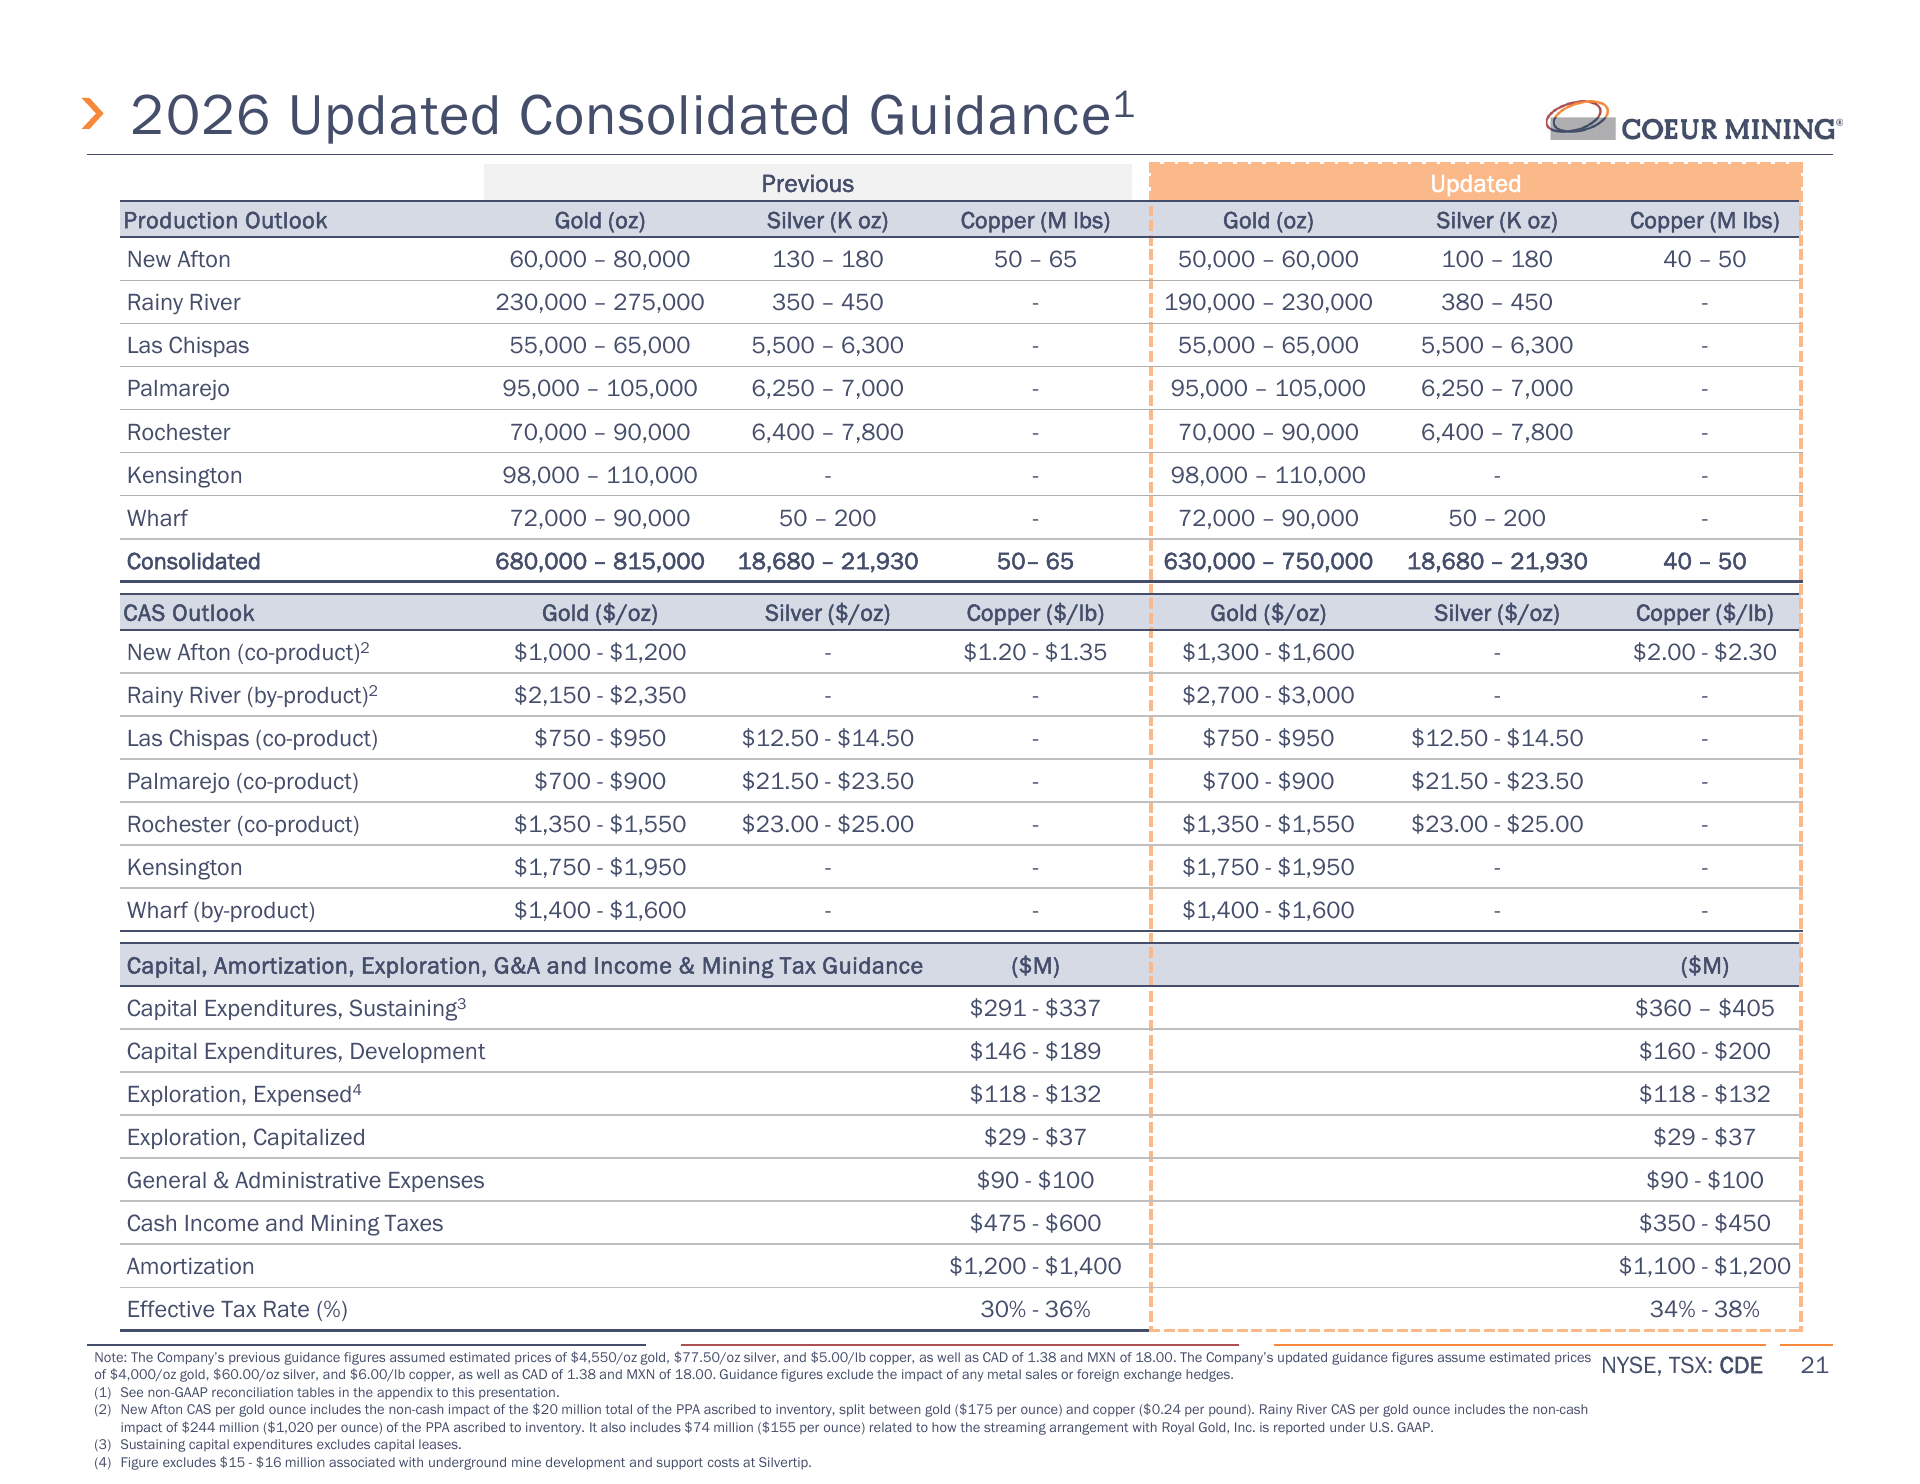
The $500M reduction in FY2026 FCF cannot be attributed entirely to operating disappointments. Management also lowered its forecast gold and silver prices, while raising copper. On the call, the CFO explained that the revised cash-flow outlook incorporated $4,000 gold, $60 silver and $6 copper for the remaining forecast period.
CDE did not provide a complete dollar-by-dollar bridge separating price, volume, tax and cost effects. I would therefore avoid assigning an exact percentage of the FCF cut to any one factor.
The new guidance still requires a stronger second half. After $654M of H1 FCF, reaching $1.5B implies $846M in H2. That is about $423M per quarter, compared with $388M in Q2. It is achievable if production improves, but higher capital spending means the extra ounces must turn into cash.
New Afton: protecting the cave delays the higher grades
At New Afton, management is controlling how ore is drawn from different parts of the C-Zone cave. The aim is to let the cave develop evenly and preserve its long-term productivity.
The higher-grade areas are not all available at the same pace. Drawing more material from the north and west while limiting the higher-grade south and east reduces the near-term grade mix. That helps explain why simply increasing tonnes is insufficient to forecast the next quarter’s gold and copper output.
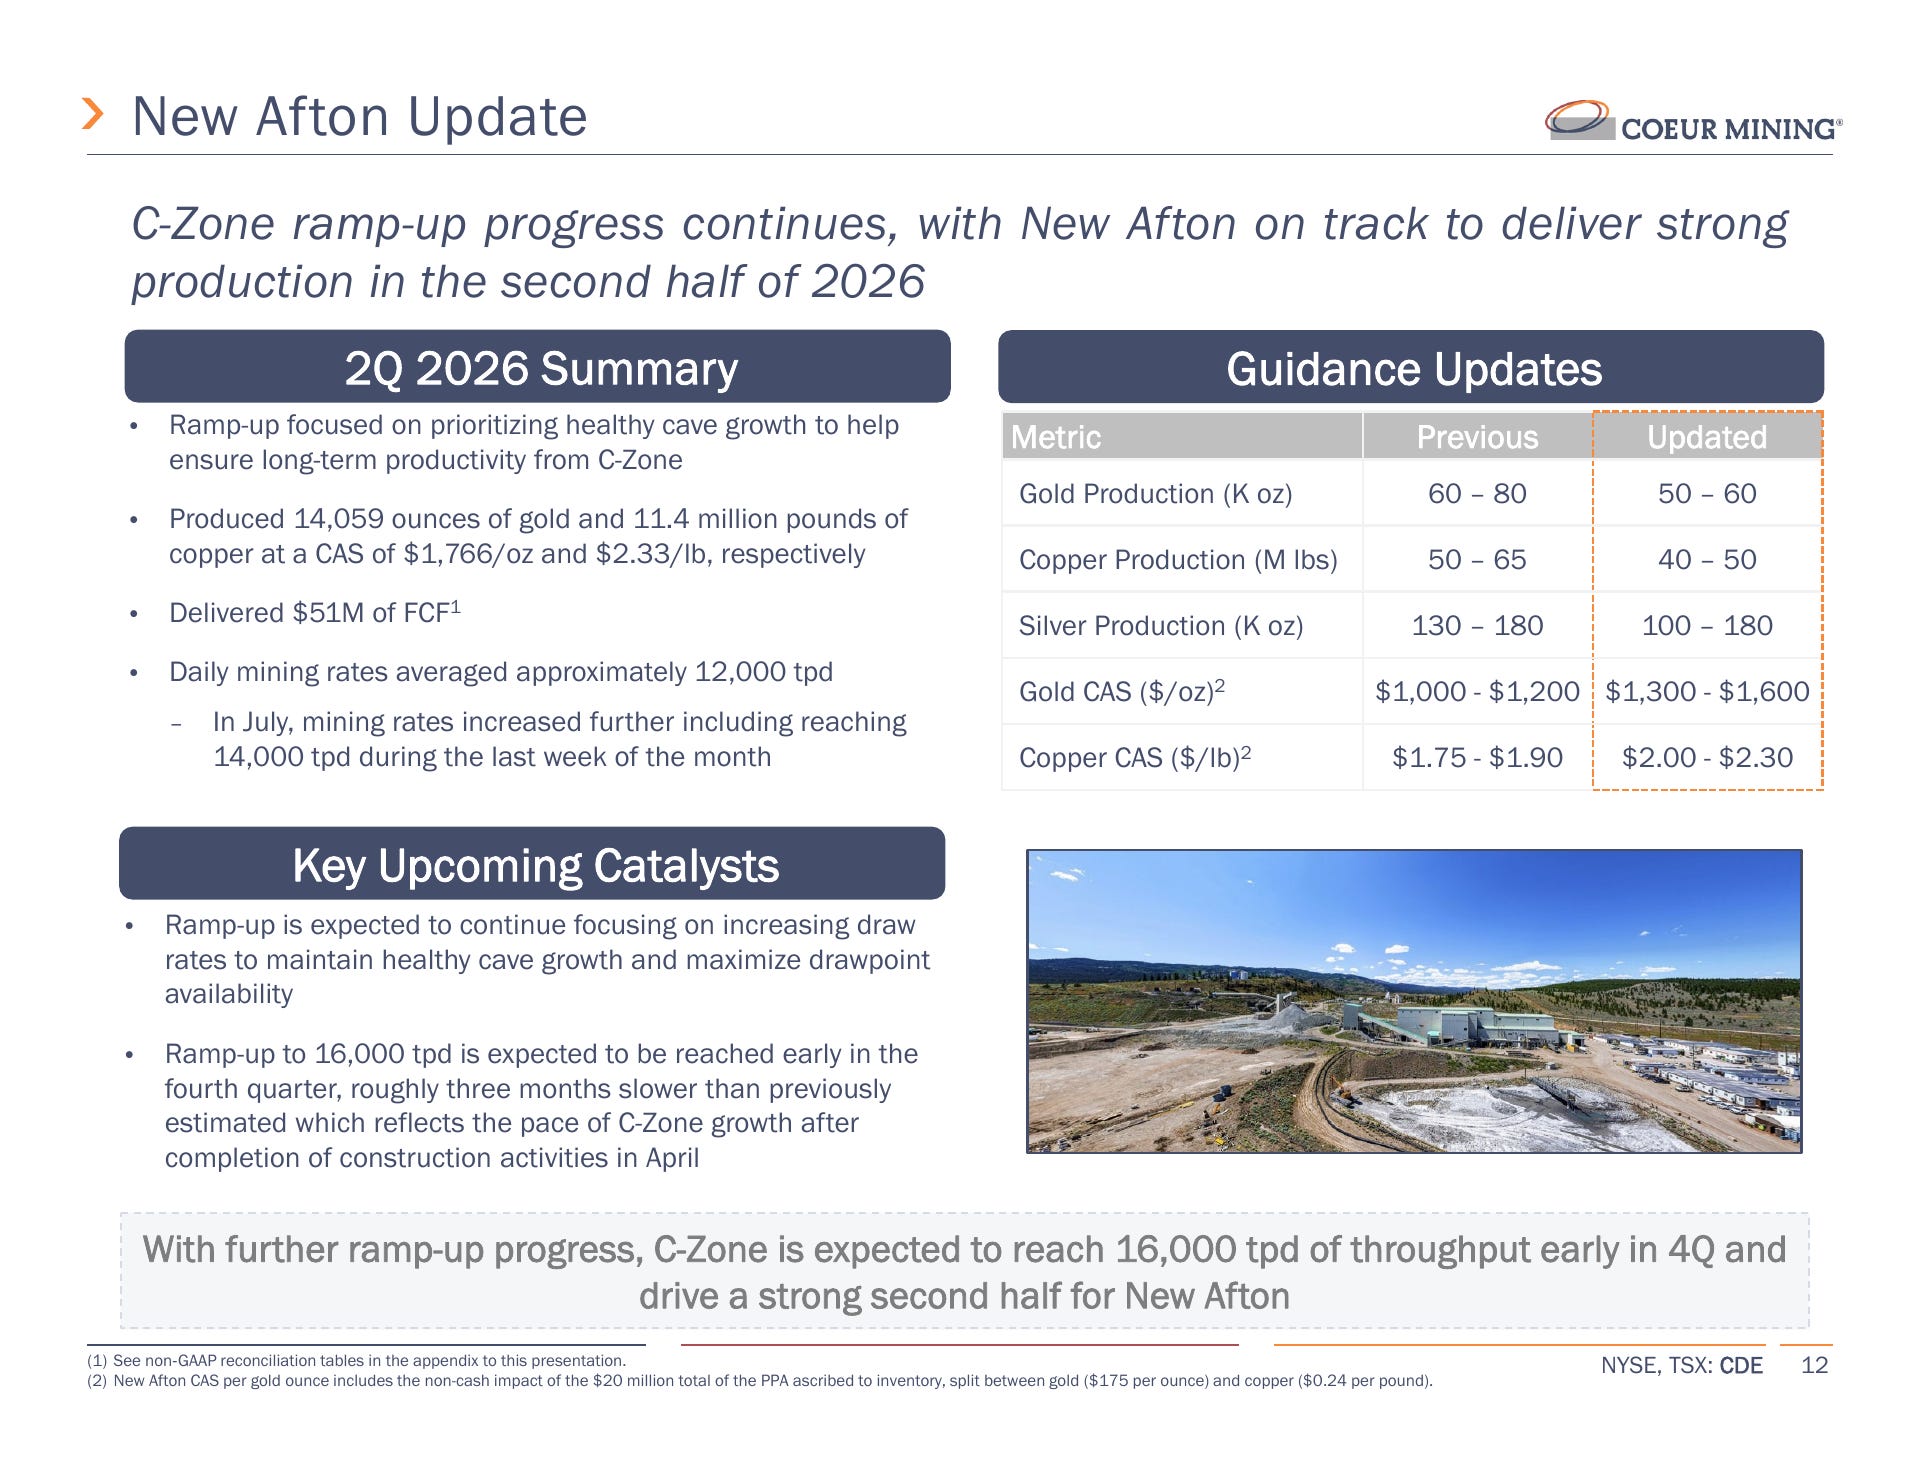
Mining rates averaged approximately 12,000 tonnes per day in Q2 and reached 14,000 in the final week of July. Management moved its 16,000-tonne target from the end of Q2 to early Q4.
The useful distinction is that New Afton’s overall operating-cost budget did not increase with this guidance revision. Producing fewer ounces and pounds over the same period raises the unit cost even when the total spending is unchanged. If the cave develops as planned, production and unit costs should improve together.
There is still a risk beyond this year. Asked whether the revised draw sequence might smooth the high grades previously expected in 2027 and 2028, management said it was rerunning the plans. It reported no sterilised ore, but did not confirm the old annual grade profile.
I therefore retain the longer-term production opportunity while using a more gradual ramp. The evidence supports patience; it does not yet justify treating the previous peak-year schedule as certain.
Rainy River: the cost reset deserves more attention
Rainy River’s open pit and mill performed well enough to generate $123M of Q2 FCF. The underground operation was the weak point.
Management identified gaps involving equipment, personnel and infrastructure as development advanced faster than the mining operation could follow. Underground production averaged roughly 2,300 tonnes per day in Q2, improving to 3,300 in July. The target is now 5,000 by year-end. That is an exit rate, rather than an average for Q4.
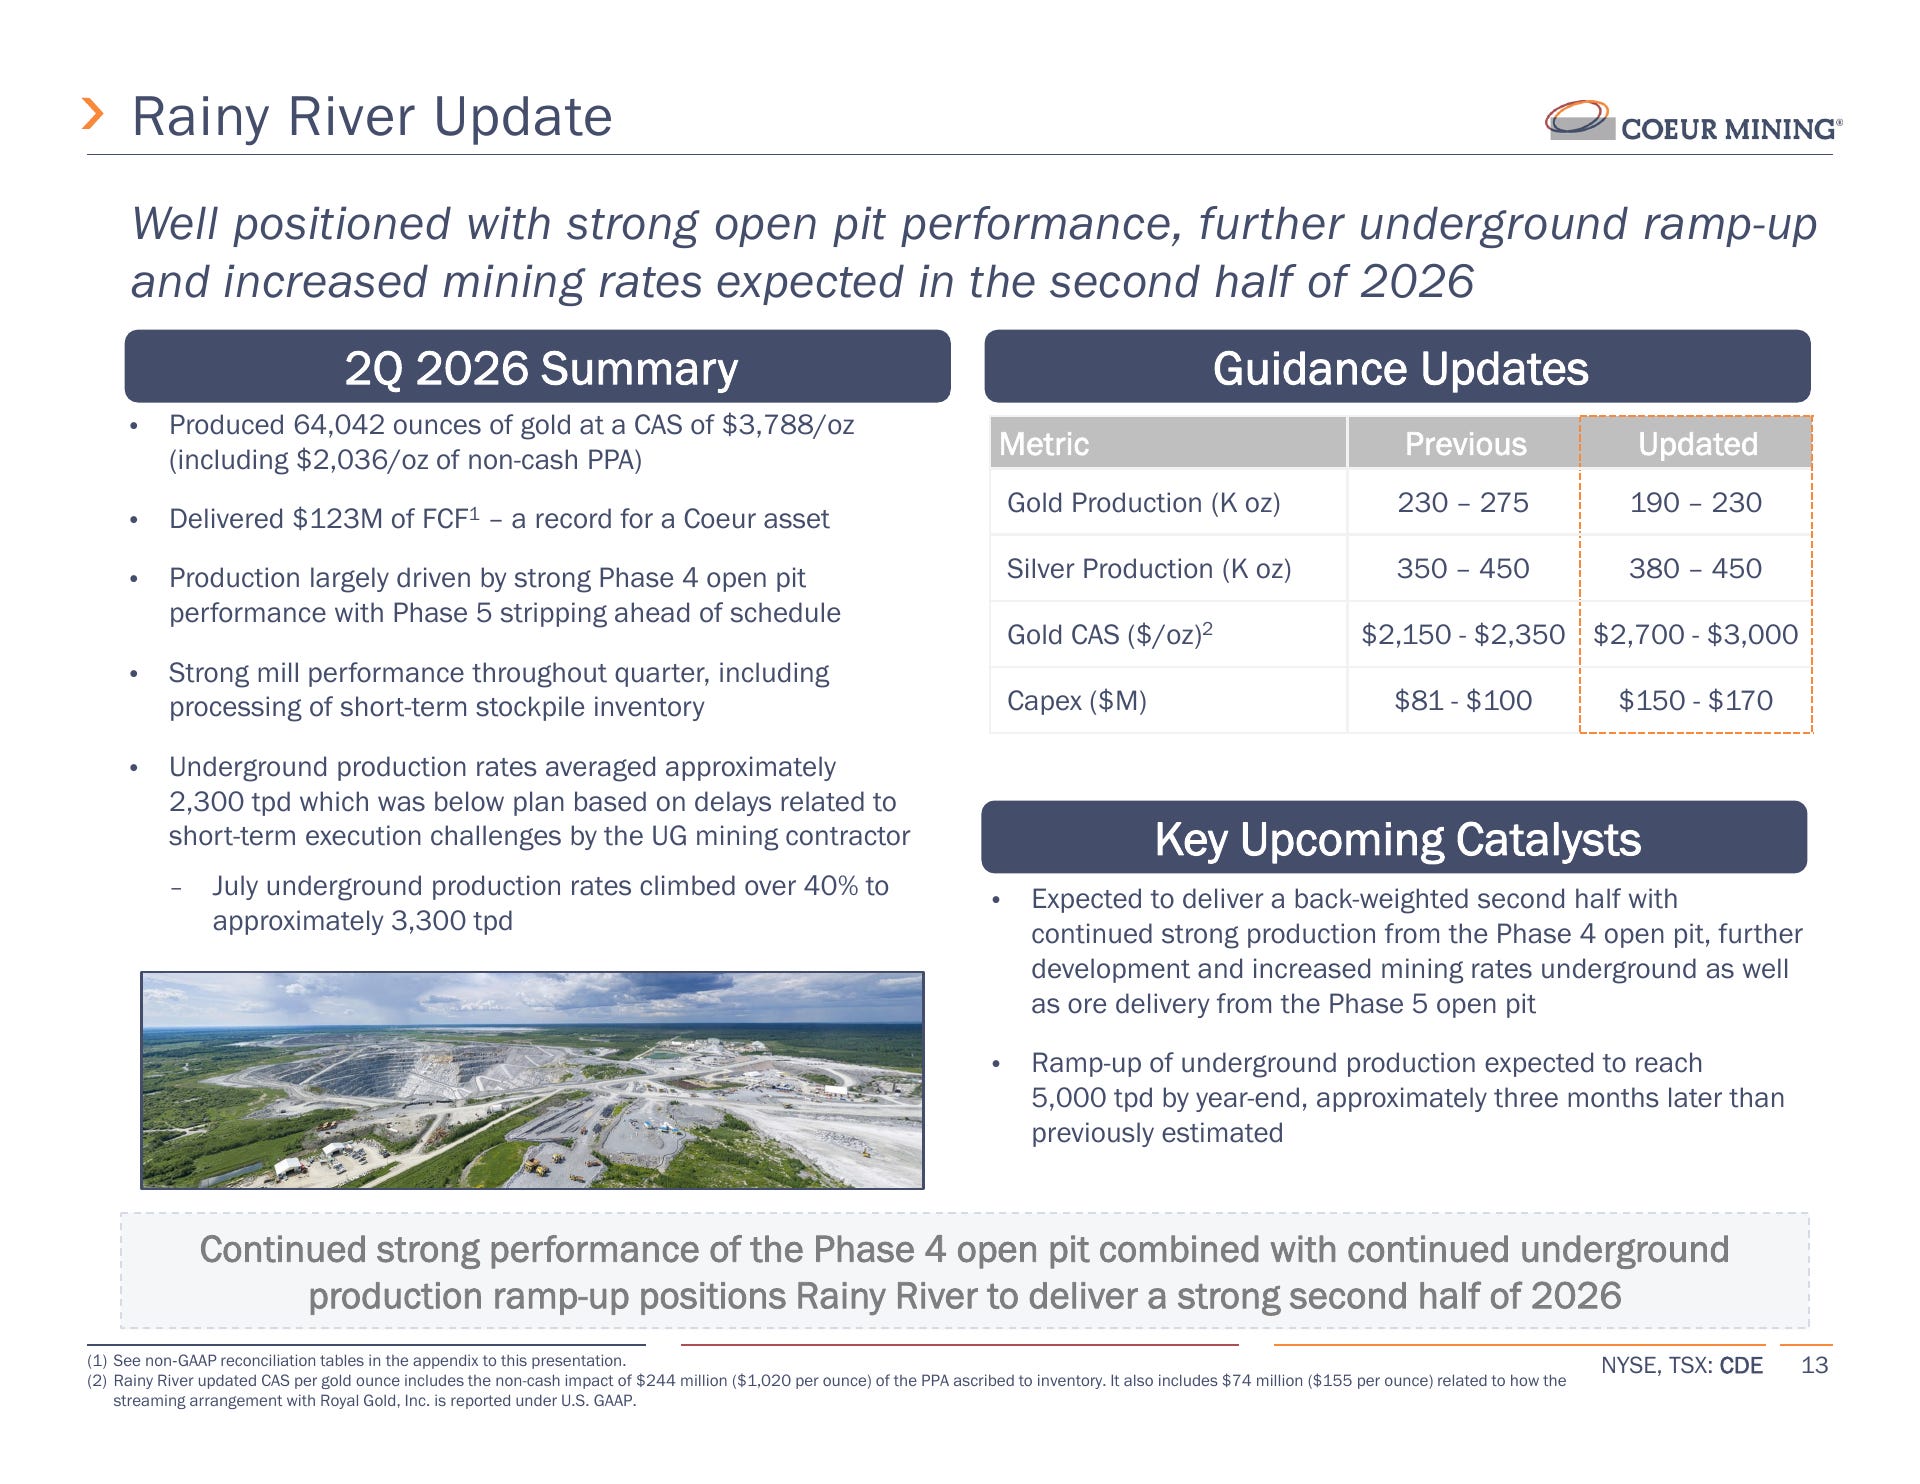
Unlike New Afton, Rainy River needs additional spending. Management expects about $30M in incremental operating costs this year and $25M for underground development, equipment, and infrastructure. Those amounts reflect a practical problem that must be fixed.
A further $45M moved from operating costs into capitalized stripping. That changes where the cash appears in the financial statements. It does not make the expenditure disappear from FCF.
The reported $3,788 per ounce Q2 CAS includes $2,036 of non-cash inventory uplift. Subtracting that item gives a useful view of the accounting distortion, but it does not create a clean life-of-mine cost forecast. Stockpile consumption, the open-pit mix, underground productivity, stream accounting and stripping treatment all matter.
My NAV now starts Rainy River at $2,050 per ounce of cash costs, with 3% annual escalation and a $150M starting annual capital allowance. This is a forward operating assumption, not reported CAS or a $2,050 life-of-mine average. The Q2 results put reported nine-month cost guidance at $2,700-$3,000, including $1,020 of non-cash inventory uplift and $155 for the stream. Removing those items gives $1,525-$1,825 before the stream, so $2,050 retains a cushion for the underground transition. The model deducts the stream separately and schedules 1.92M gold ounces across nine producing periods.
The upcoming budget will help determine how much of the cost increase persists. A July improvement is encouraging, but a full quarter at higher underground rates would provide better evidence.
The legacy mines give CDE some breathing room
Rochester crushed a record 6.8M tonnes in Q2, up 15% sequentially. Management also pointed to ore placed close to the liner on the new leach-pad section as a reason to expect stronger H2 production. Gold should arrive sooner; the larger silver response is weighted toward Q4.
The distinction between tonnes placed and recovered metal remains important. I want to see the improvement in silver sales and cash flow before treating the crusher record as the completed operating turnaround.
Las Chispas continues to provide a more stable contribution. It generated $107M of Q2 FCF, while Palmarejo contributed $56M despite weaker grades. Wharf’s repaired crusher reached full capacity in May, and the temporary contract-crushing units were subsequently removed.
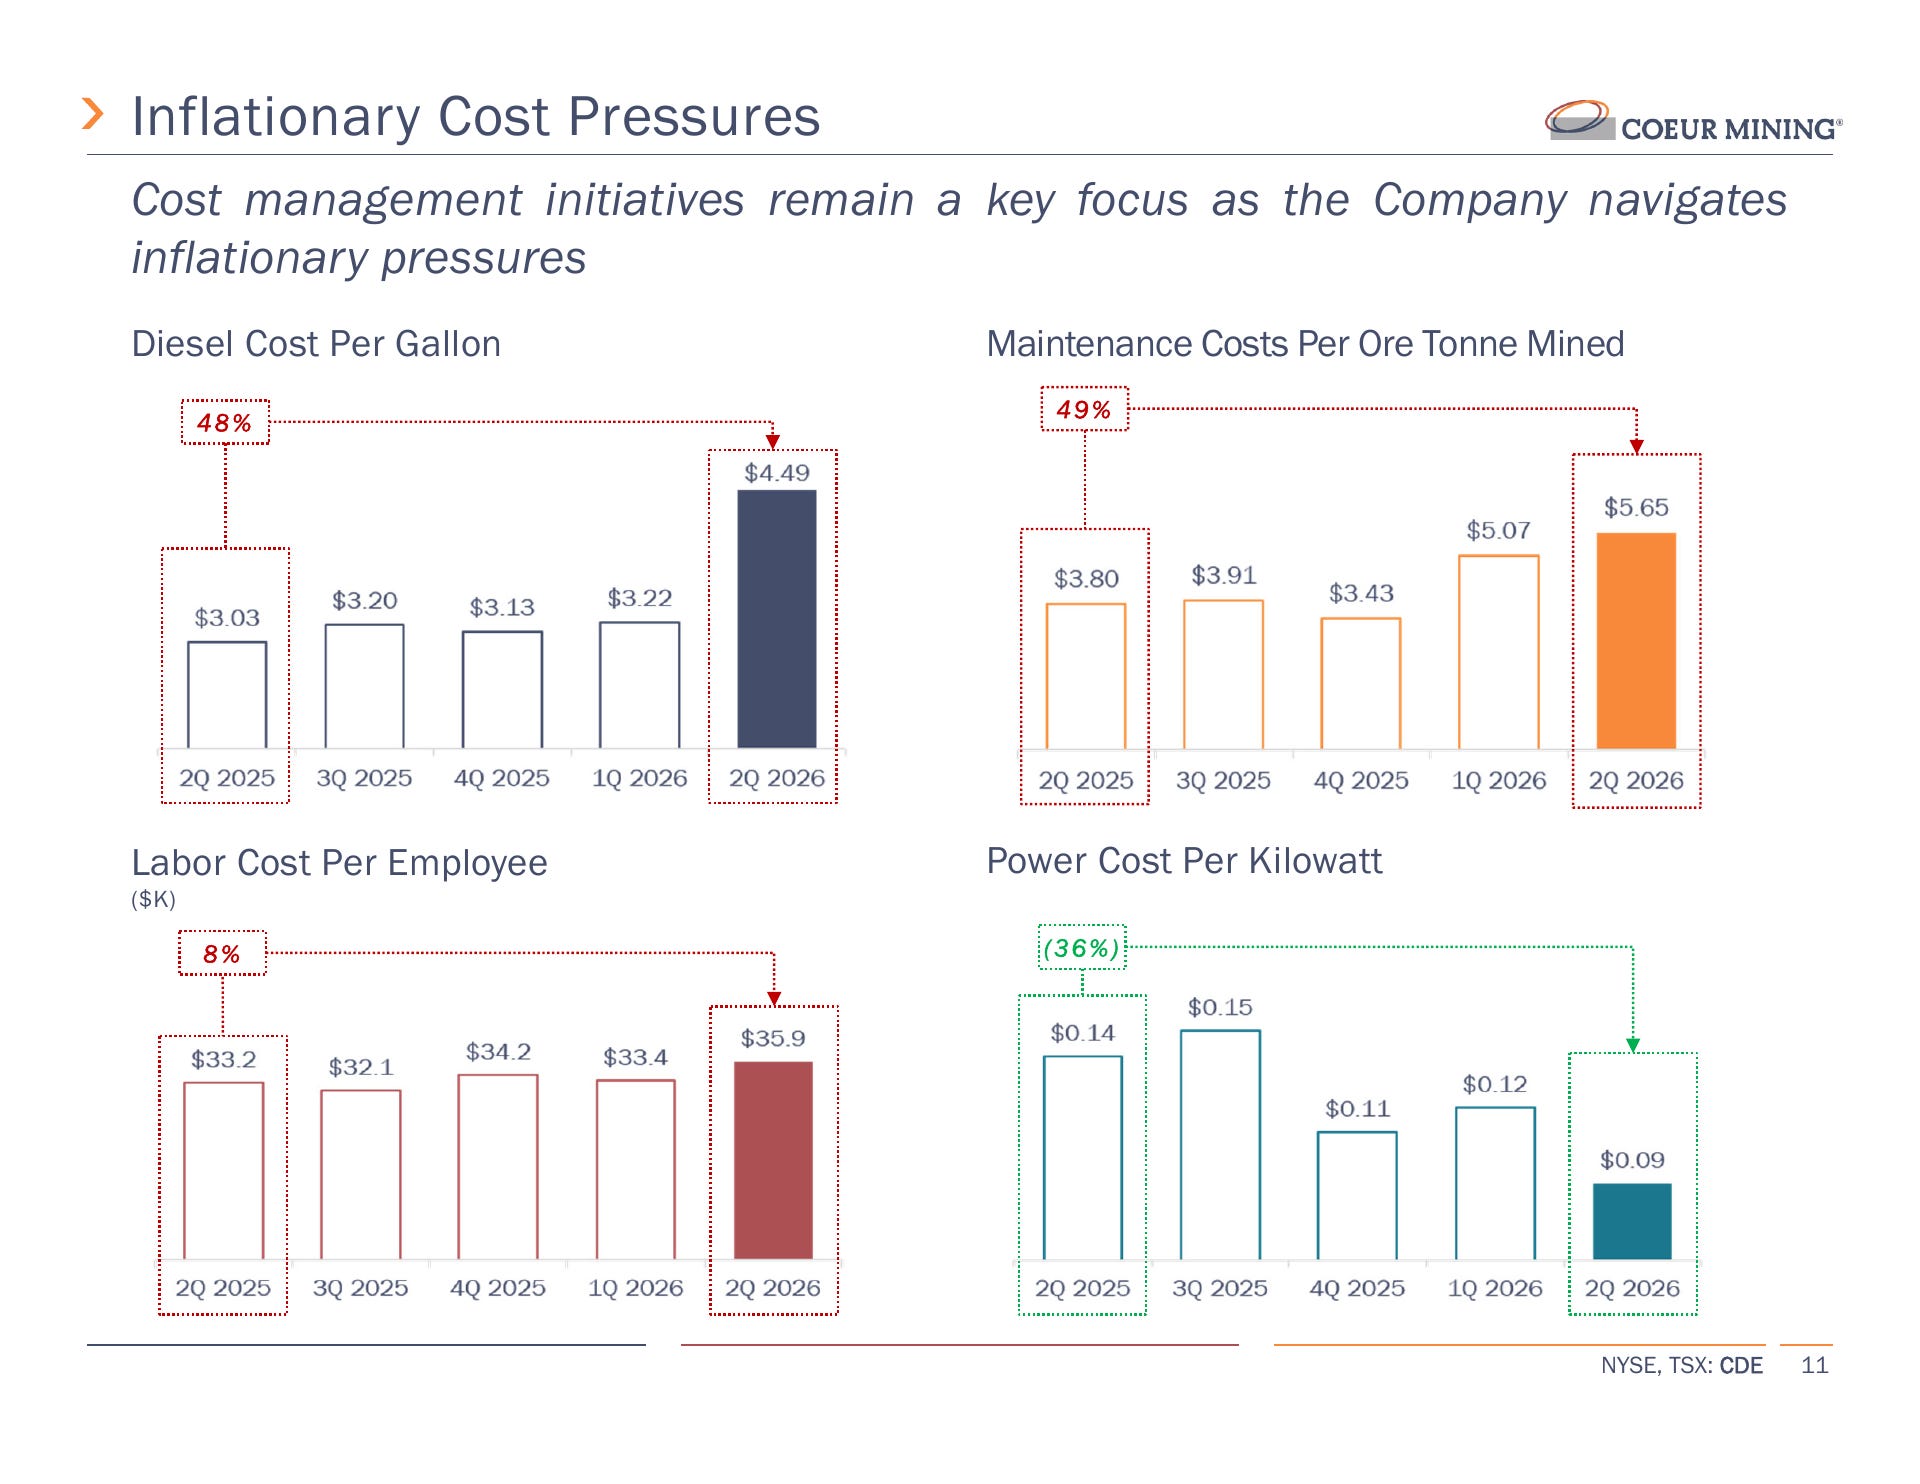
These operations help CDE fund the Canadian work. They also face their own grade, recovery and cost risks. Management’s cost presentation shows why a North American portfolio still needs careful operating control.
Gold fundamentals remain supportive, with two-way price risk
Gold averaged approximately $4,506 in Q2, 37% above the year-earlier period but 8% below Q1. That comparison captures the situation for miners: margins can remain attractive while quarterly earnings weaken.
The World Gold Council’s Q2 demand report estimates 289 tonnes of central-bank purchases, alongside approximately 45 tonnes of ETF outflows. Jewellery volumes remained under pressure. Different buyers are responding to different incentives, so strong official-sector demand does not guarantee a rising price every quarter.
The Council’s August review then recorded a 13.3% monthly rally to $4,563, supported by investment flows and a weaker dollar. By September 11, Reuters reported spot gold near $4,352 during Asian trading, with interest-rate expectations again applying pressure.
An IMF working paper found an association between financial sanctions and a larger gold allocation in central-bank reserves. The research supports a structural diversification argument.
That backdrop supports my $5,000 gold assumption. It is about 11% above the Q2 average, so I am assuming official-sector buying and investment demand sustain a higher price over time. The World Gold Council evidence supports that argument, but the ETF outflows and recent volatility show why it remains a constructive assumption rather than an assured outcome.
Silver and copper add opportunity, with different constraints
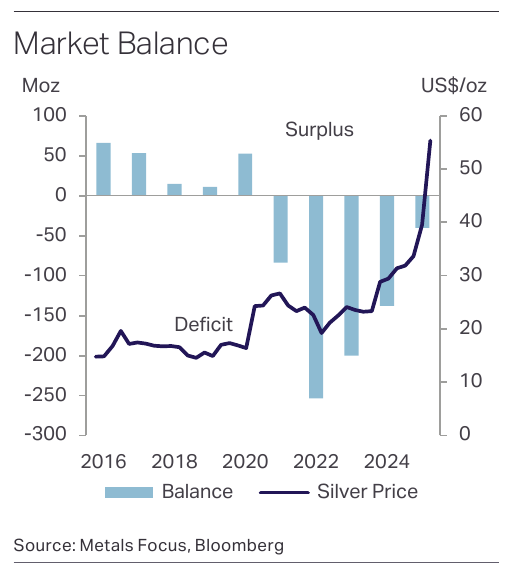
The World Silver Survey 2026 projects a sixth consecutive annual silver deficit, approximately 46M ounces. Yet industrial demand is expected to decline about 3% this year. Photovoltaic manufacturers are reducing silver use and substituting materials as costs rise.
I use $75 silver because persistent deficits and pressure on available stocks support a higher price than the old cycle averages. The Silver Institute reported silver trading in the mid-$70s in early April after a sharp retreat from its January peak. My assumption does not require a return to that peak. It does require investment demand and supply constraints to outweigh further industrial thrifting, substitution and recycling. A deficit alone cannot establish a durable price.
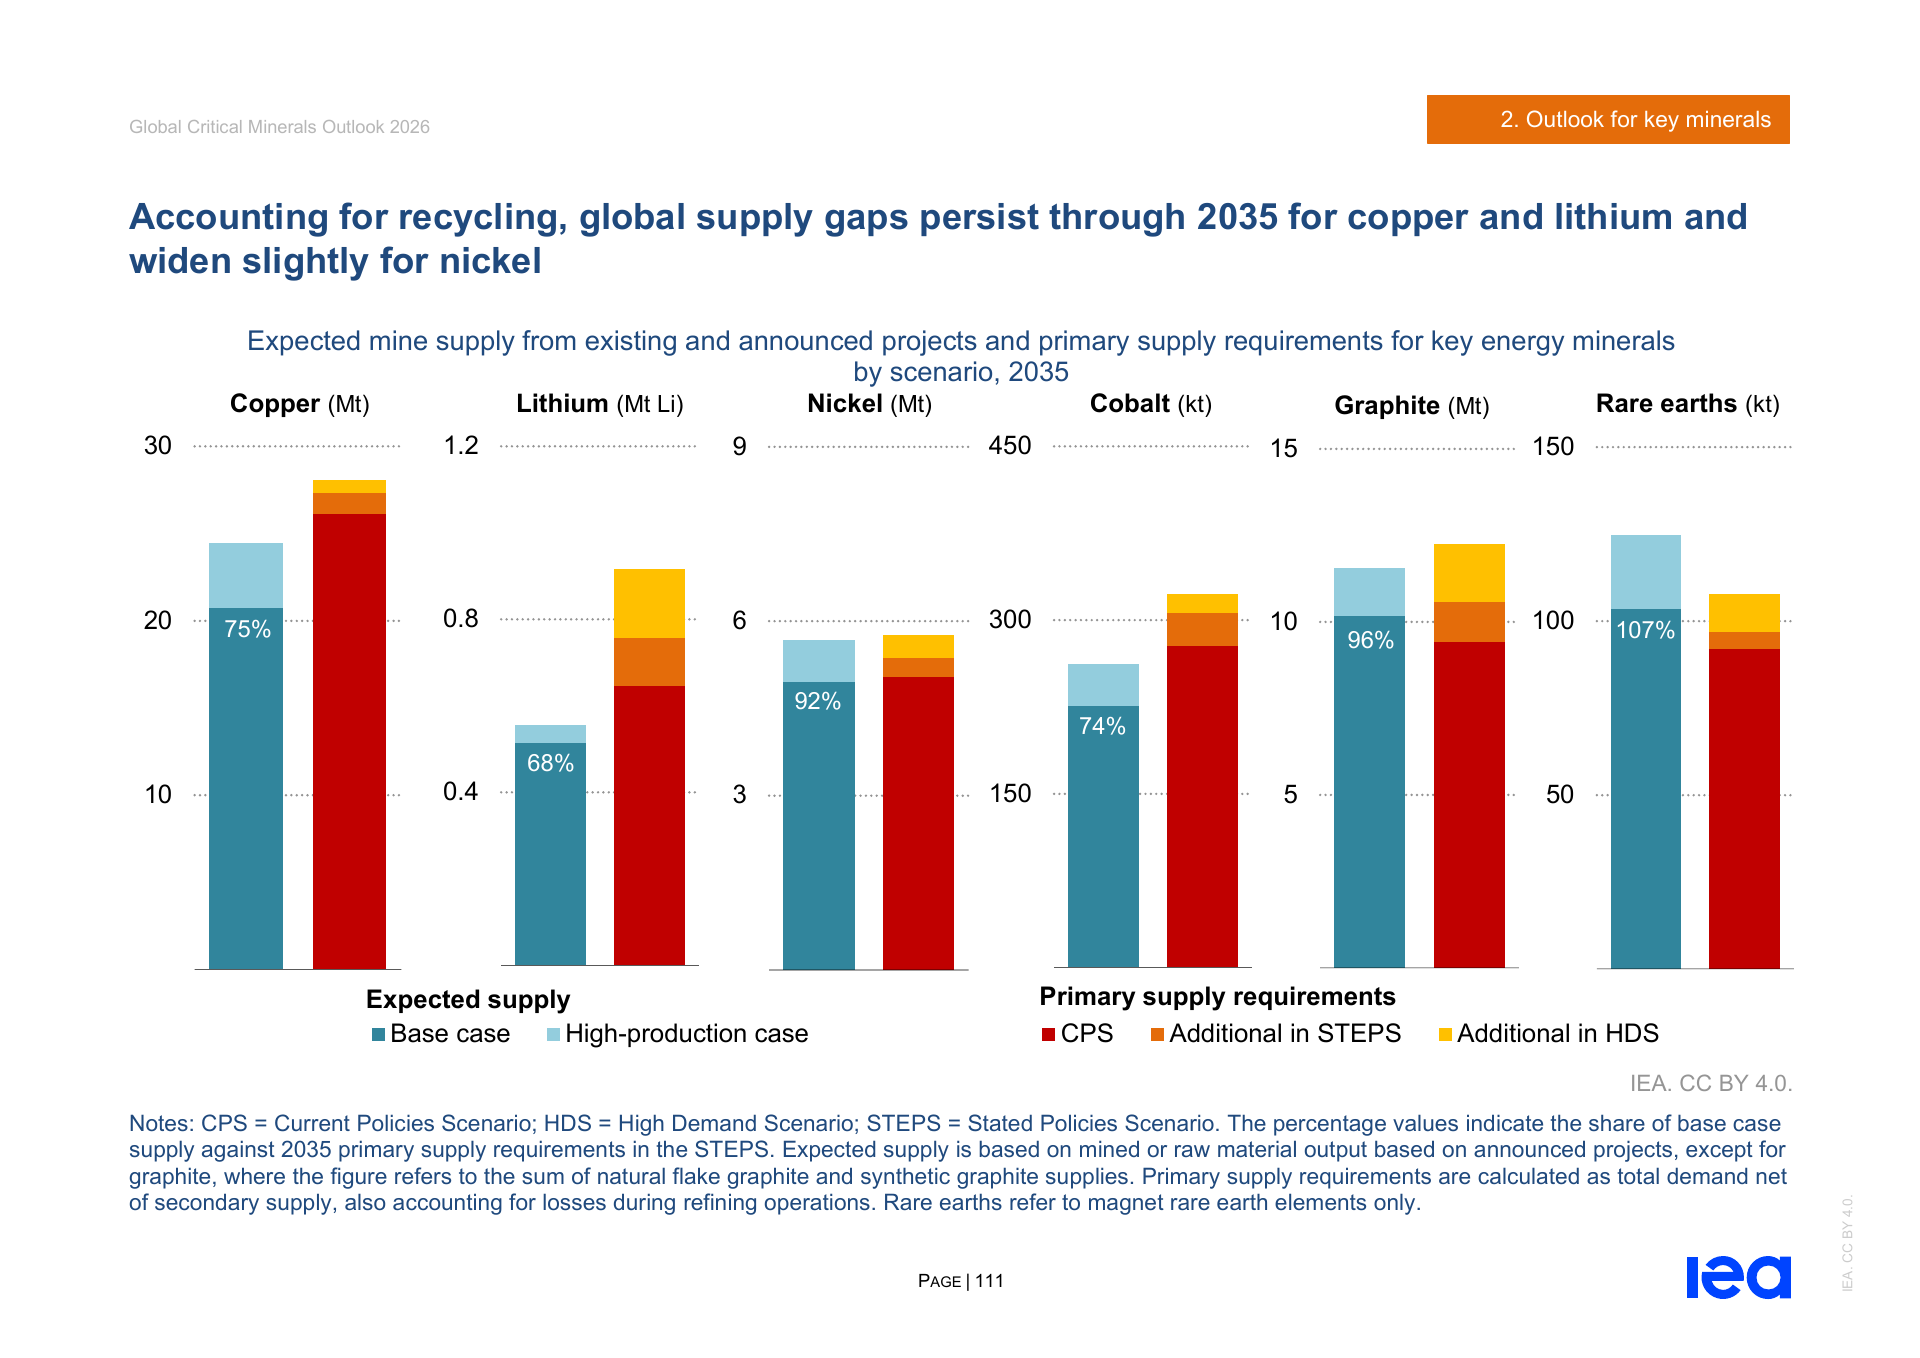
Copper has a separate longer-term supply argument. The IEA’s 2026 Critical Minerals Outlook estimates a roughly 25% gap between expected mine supply from existing and announced projects and 2035 primary supply requirements under its stated-policy scenario. That gap has narrowed from the previous outlook as projects advanced.
It is a conditional project-pipeline assessment. Higher prices, substitution, recycling and new investment can change the outcome. For CDE, it supports the importance of New Afton and its extension opportunities; it does not remove the need to develop the cave successfully.
Exploration can extend the business, but it is not cash yet
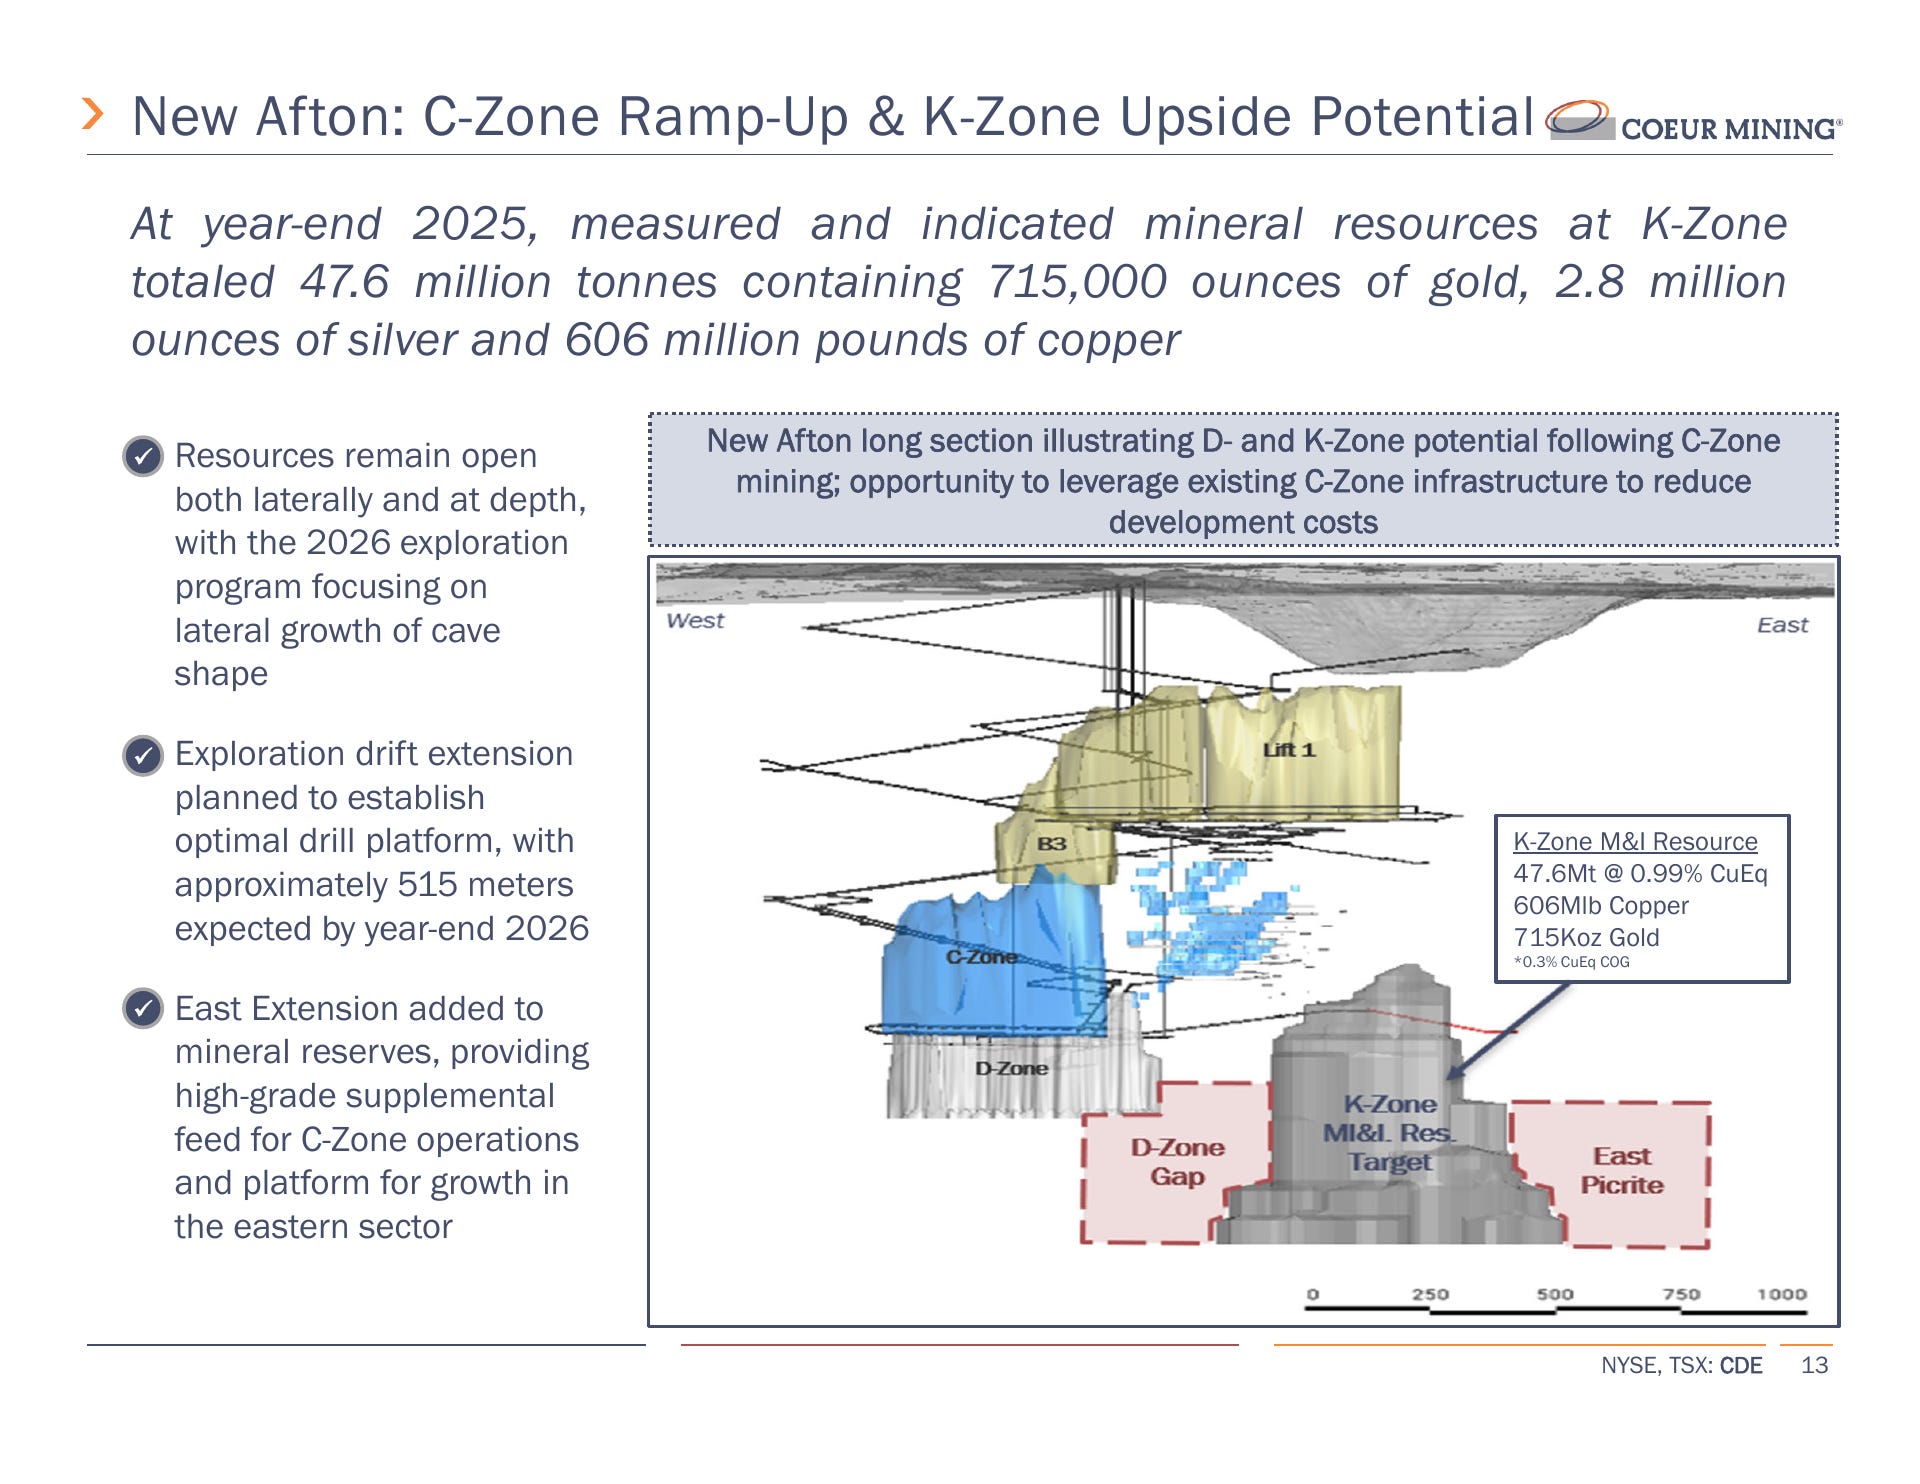
The K-Zone resource sits near existing infrastructure, creating the possibility of extending New Afton beyond the current C-Zone schedule.
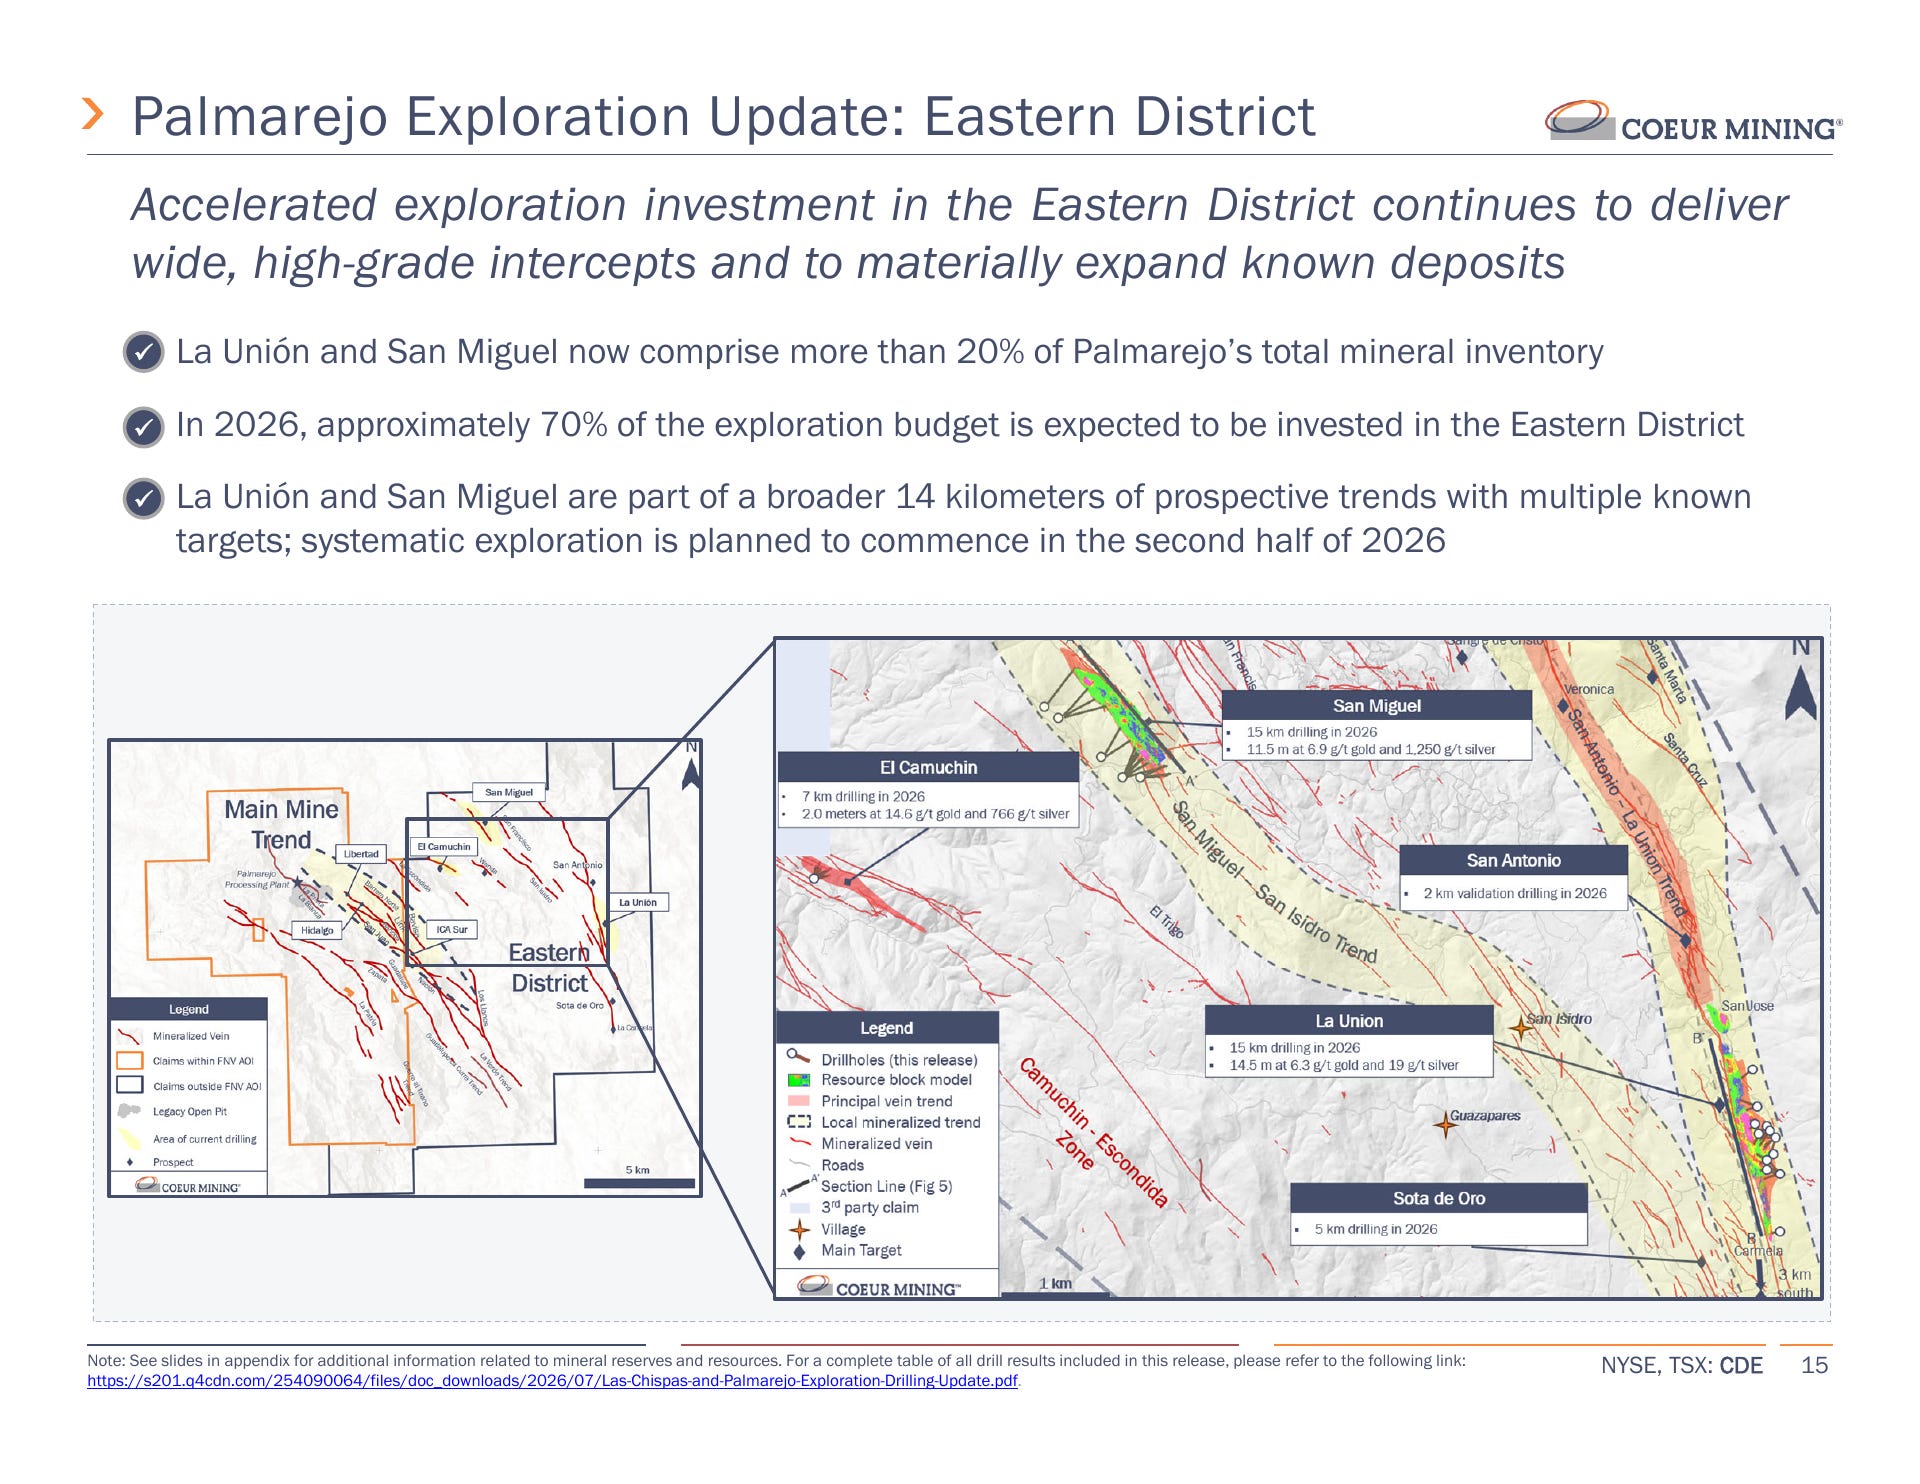
At Palmarejo, moving more production outside the Franco-Nevada stream could improve the cash retained from each ounce. Approximately half the mine’s Q2 gold sales went into the stream at $800 per ounce.
The nearer opportunity is at Independencia Sur, where management discussed a two-to-three-year development horizon. The more distant Eastern District targets require further drilling and decisions about processing and transport.
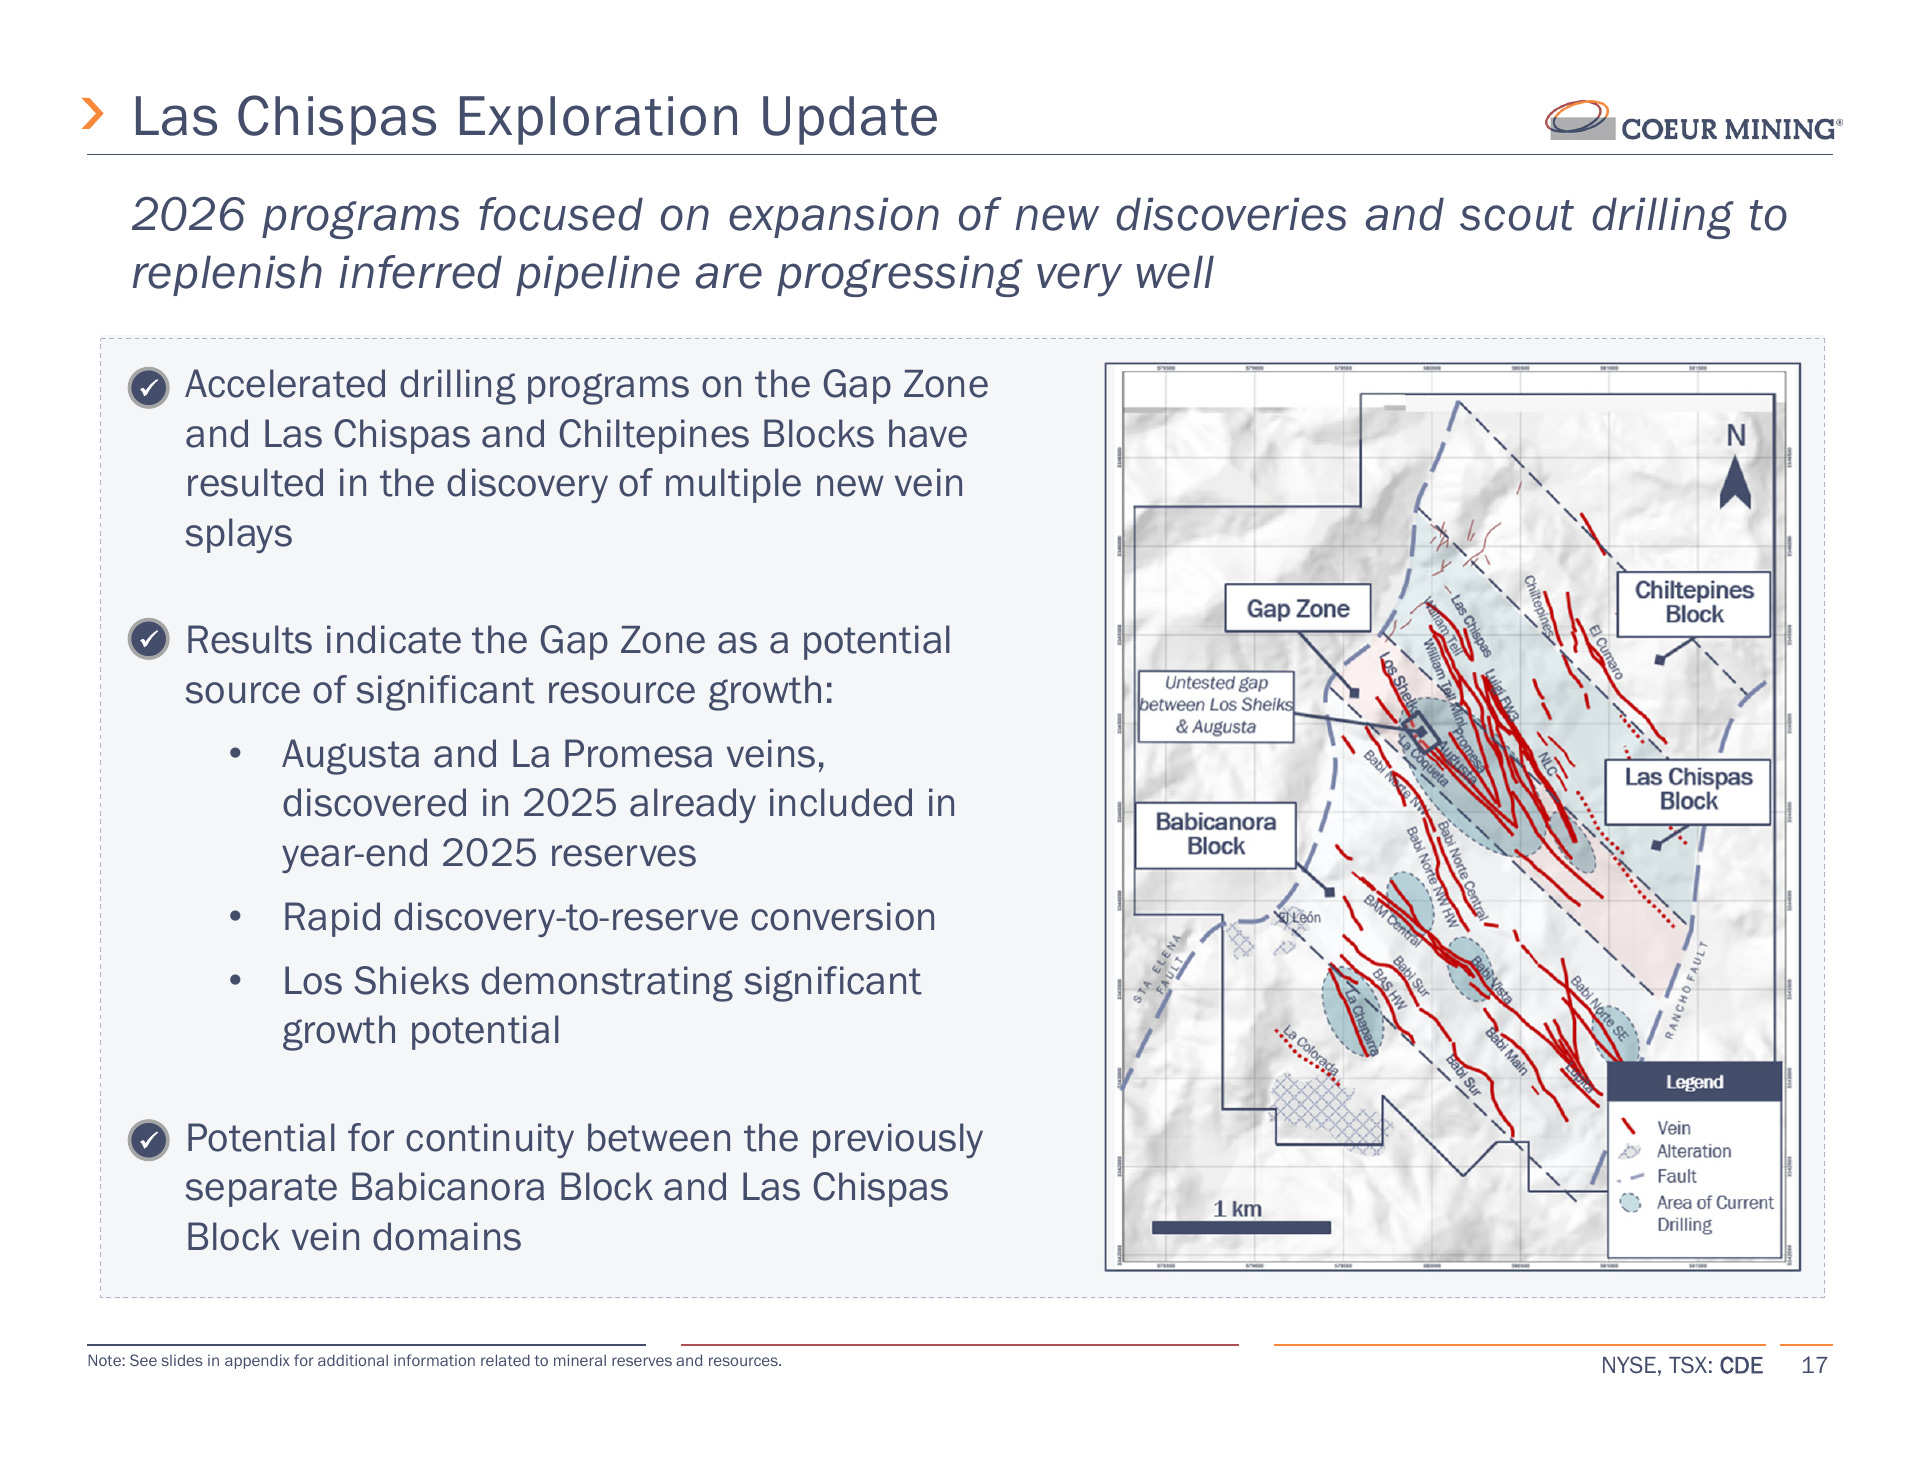
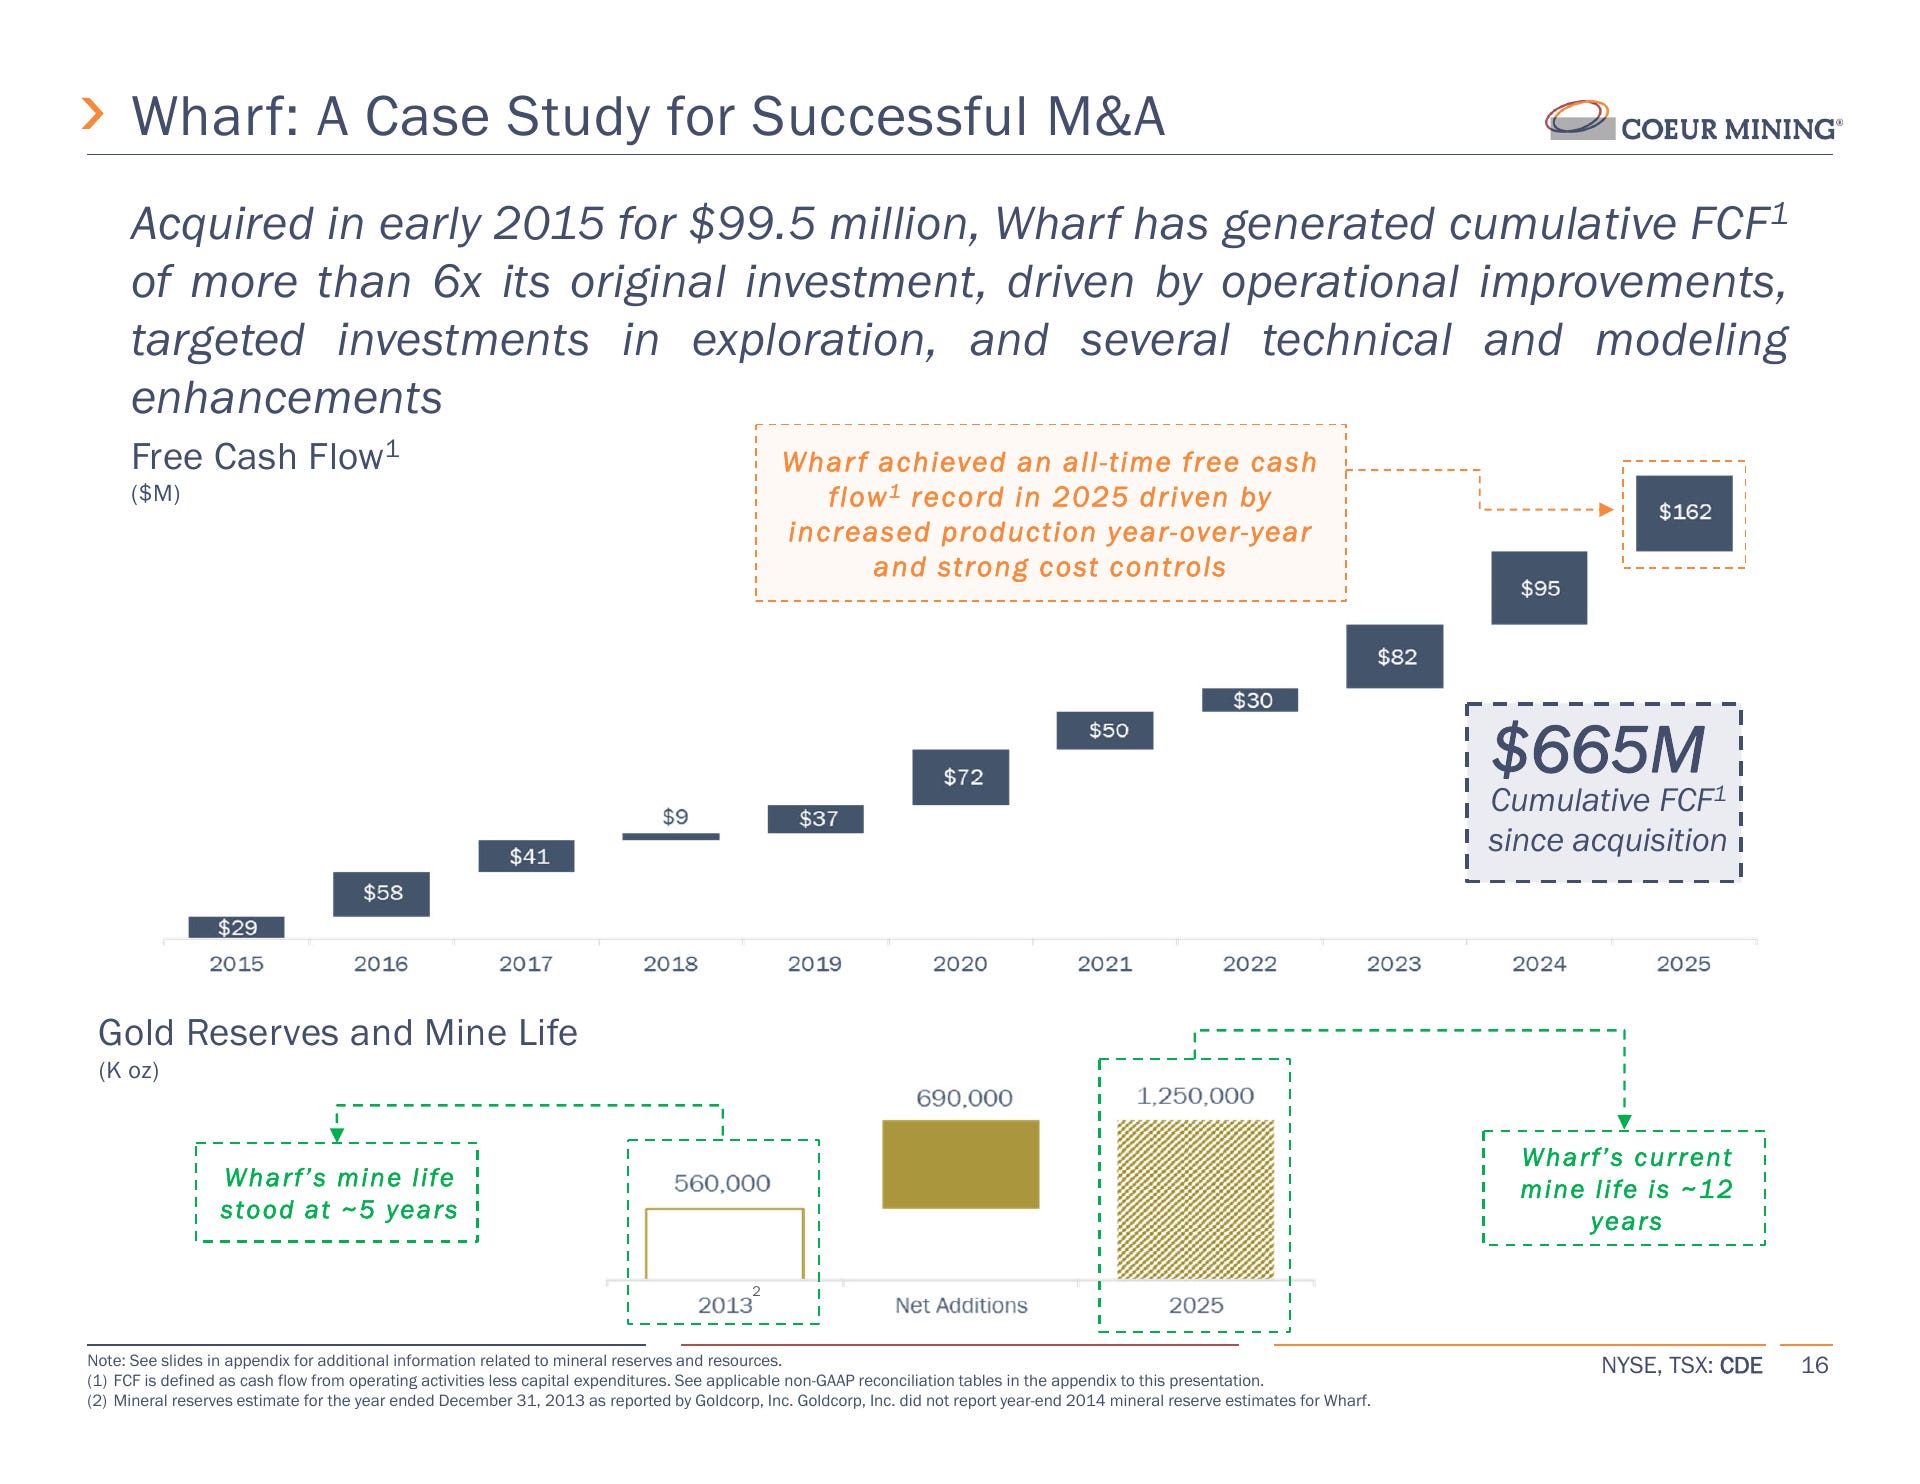
Las Chispas is also identifying new veins, while Wharf offers a historical example of exploration extending an acquired asset’s life. CDE’s exploration update identifies additional opportunities around Las Chispas and Palmarejo. These support the case for future reserve replacement, although the extensions already in today’s mine schedules are already counted in NAV.
This emphasis on existing districts is consistent with S&P Global’s 2026 gold exploration research. Gold exploration budgets increased 11% in 2025, while grassroots work fell to a record-low 19% share. Existing infrastructure can improve project economics, but the industry’s preference for nearby deposits does not make conversion automatic.
Silvertip advanced into a pre-feasibility study after the May board decision, with management aiming to complete the work in early 2027. I retain a discounted resource allowance, deduct the remaining FY2026 project-capital commitment, and include no operating production from it in the NAV.
Capital allocation is becoming a real part of the thesis
CDE repurchased $110M of shares during Q2, paid its $0.02 semiannual dividend and retired $39M of finance-lease debt. It still finished June with more than $1B of cash.
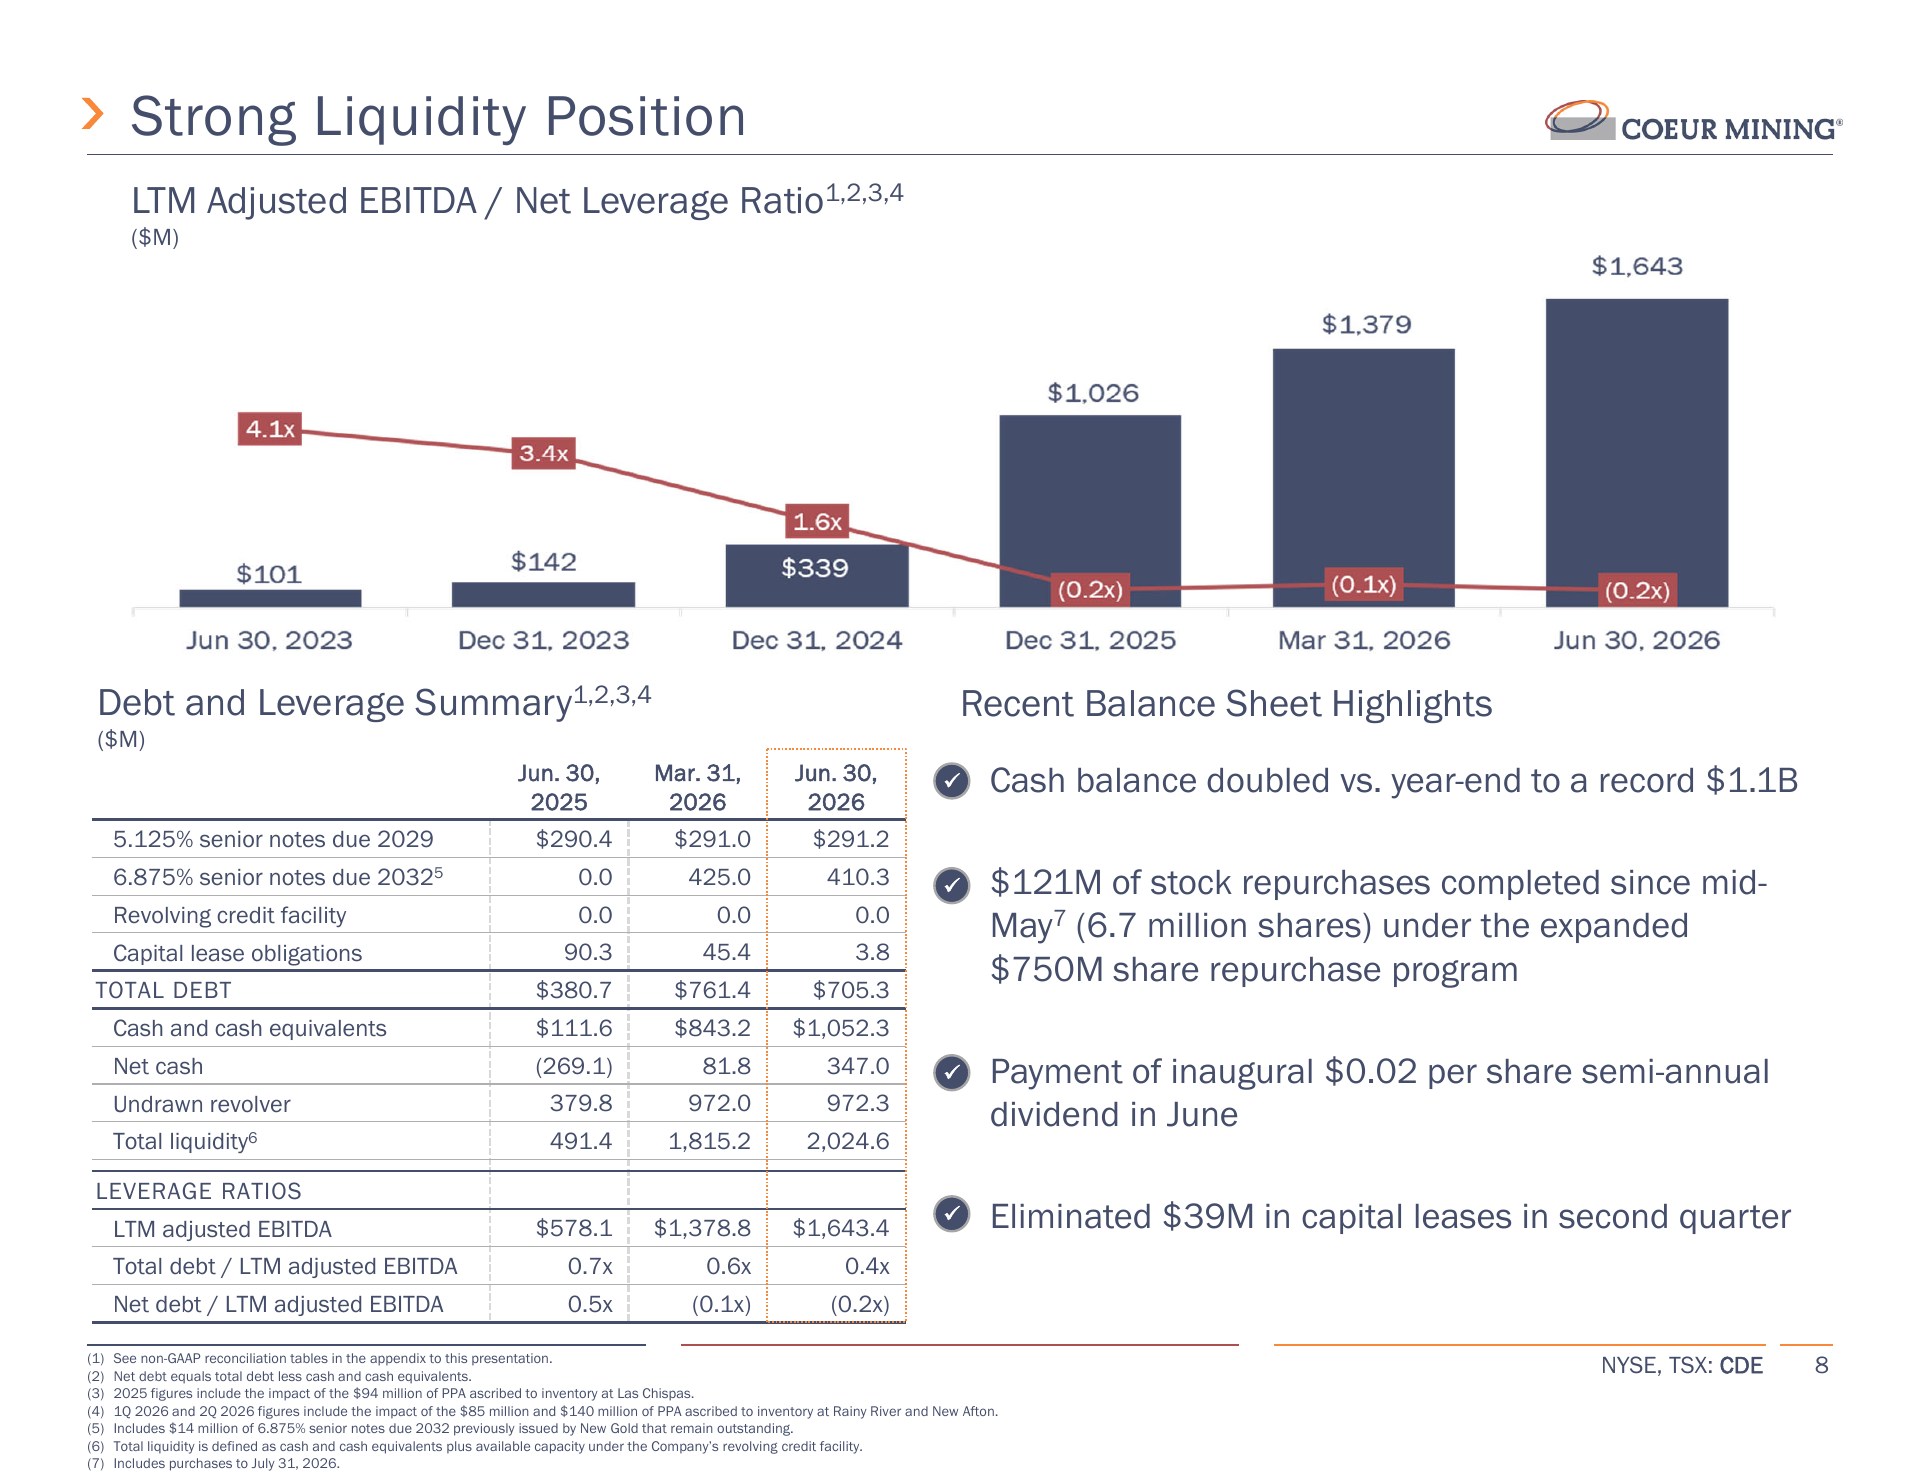
The $750M buyback authorization provides flexibility. Management said it would adjust purchases to valuation and was not under pressure to exhaust the programme by a particular date. That is the appropriate approach for a miner whose cash generation changes with commodity prices.
The competing demand for capital is substantial. Rainy River needs more investment, Rochester is developing additional leach-pad capacity, and the exploration projects require funding. I want management to preserve that flexibility rather than promise a fixed pace of repurchases.
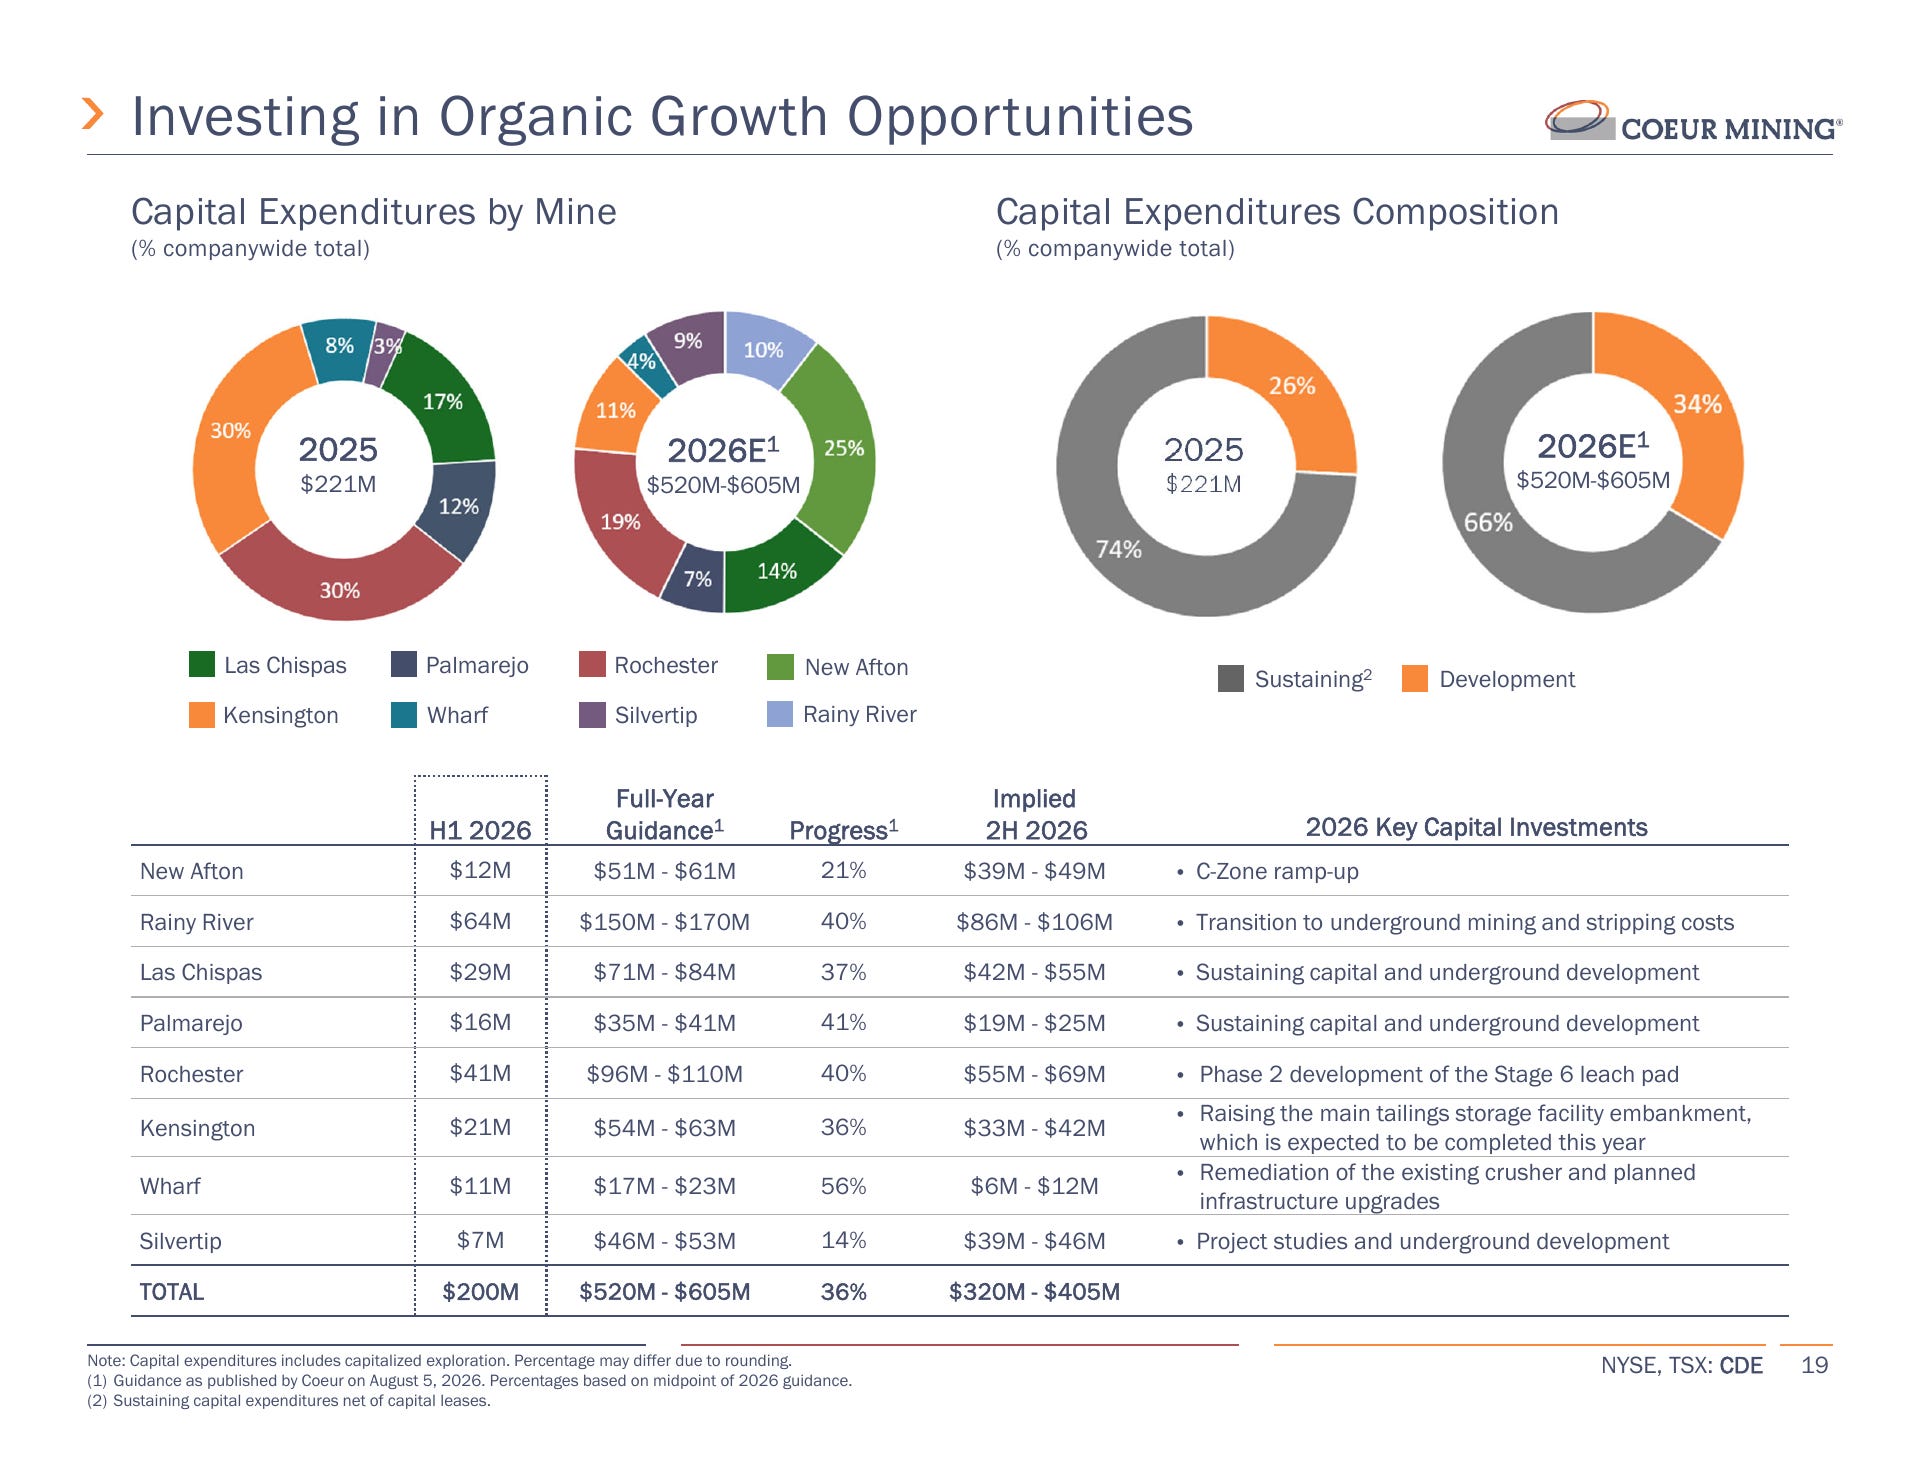
From the mine values to a $19.47 target
My updated mine-by-mine model produces $12.93 per share of equity NAV before a growth premium. The assumptions are $5,000 gold, $75 silver, $5 copper and a 5% discount rate for producing mines. I hold the metal prices flat in nominal dollars over the remaining schedules and deduct the contractual streams. Applying 1.5x to the producing-mine NAV after streams, with the other assets and deductions carried once, gives a $19.47 price target.
For context, the World Bank’s April 2026 Commodity Markets Outlook forecasts $4,300 gold and $65 silver for 2027. My assumptions sit roughly 16% and 15% above those levels. Copper remains close to its $11,000-per-tonne forecast, or $4.99 per pound. The gold and silver cases draw support from the demand and supply evidence discussed above.
The lower discount rate gives more weight to later cash flows. I use 5% for established producing assets with operating infrastructure, while the mine schedules retain slower Canadian ramps and ongoing cost inflation. This is a nominal valuation assumption. Holding everything else constant, using 7% instead reduces the premium-inclusive target to $18.17.
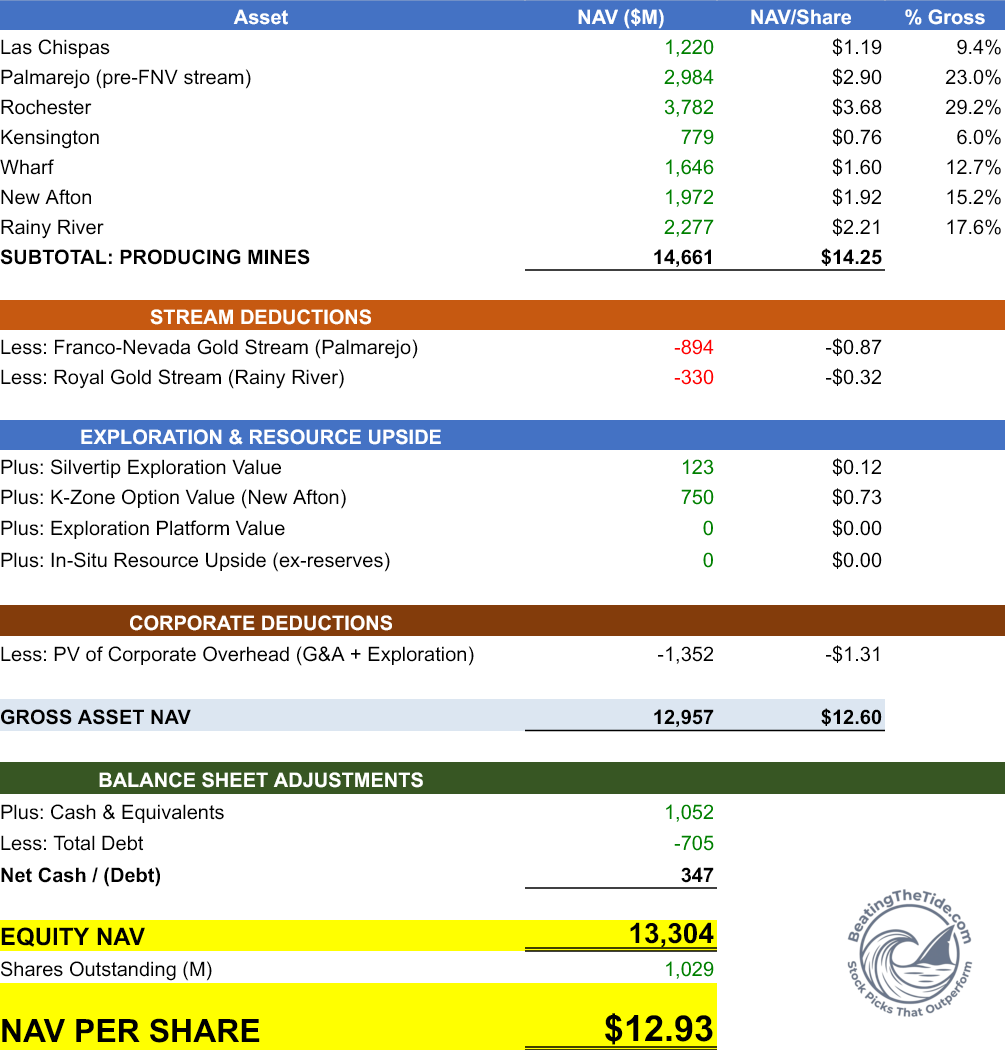
The model retains 3% annual cash-cost escalation and 1% capital escalation. Flat nominal metals therefore produce progressively tighter margins, rather than an inflation-free cost base. Cash, debt and the share count come from June 30. The forward schedules begin on July 1, so I do not add already-earned H1 cash flow or forecast year-end cash on top of the same future mine cash flows.
Mine lives are finite, with no perpetual-growth terminal value. Recurring corporate G&A is $93M annually, within management’s $90M-$100M guidance. At 5% over ten years, with the existing 25% tax shield, that deducts $539M, or $0.52 per share. I separately retain $140.5M a year for expensed exploration and project support, a further $814M present-value deduction, or $0.79 per share. Moving those costs out of the discussion would make exploration look free.
The stream deductions follow annual production. Palmarejo retains a conservative 50% gold-stream assumption at $800 per ounce. Rainy River includes both gold and silver streams; I conservatively omit the benefit of the contractual delivery-threshold reductions.
The premium pays for possible future reserve replacement and mine-life extensions beyond the production already scheduled. Palmarejo’s exploration outside the stream boundary, new veins at Las Chispas and further near-mine drilling give that possibility substance. Existing infrastructure may help make additional deposits economic. Successful conversion, development funding and permitting still have to follow.
I apply a 50% premium only to the $13.06 per share of producing-mine NAV after streams. I remove the old $1.00-per-share generic resource allowance, which covered much of the same growth, and leave the separate exploration-spending multiple at zero. Silvertip and K-Zone keep their standalone allowances of $0.12 and $0.73 per share and receive no premium. Their potential is excluded from the premium argument. The current Wharf extension and Canadian ramps are already in the mine schedules and receive no separate uplift for the same ounces.
The resulting bridge is $13.06 of producing-mine NAV, plus $6.53 of premium, $0.85 for the two named options and $0.34 of net cash, less $0.52 of G&A and $0.79 of exploration and support. Using the unrounded values gives $19.47 per share.
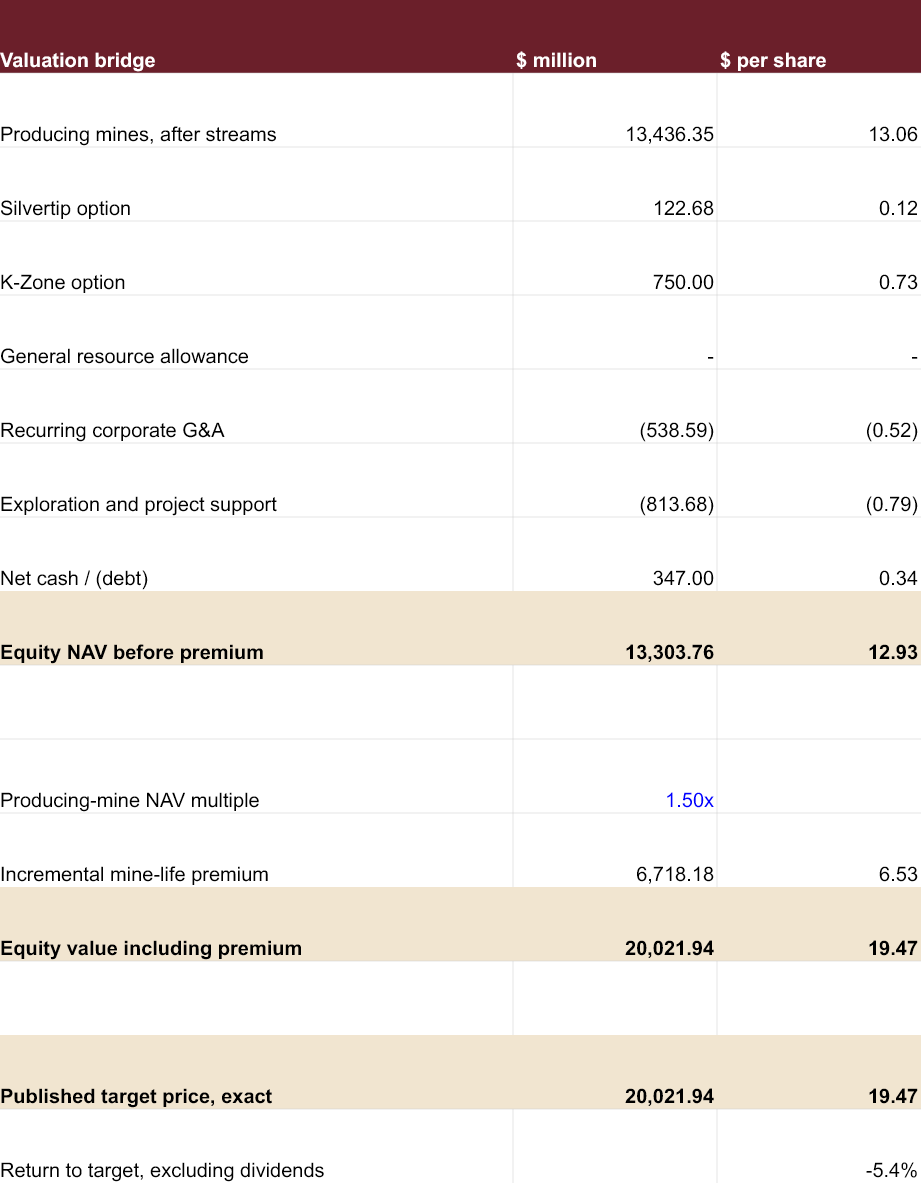
The size of that premium deserves scrutiny. It adds $6.72B of equity value, equivalent to roughly $870M of additional annual after-tax cash flow for ten years at 5%. That is a valuation hurdle, not a forecast of incremental earnings. Drilling results support the possibility of extensions, but they do not independently establish a 50% uplift. I treat 1.5x as a constructive judgment and show 1.4x alongside it, which gives $18.16. The target needs both supportive metals and successful future conversion.
Keeping the operating schedules, 5% discount rate and 1.5x producing-mine multiple fixed shows how much the price assumptions matter:
Lower metals: $3,500 gold, $45 silver and $4 copper give $4.89 NAV before premium and a $7.39 target.
World Bank-like prices: $4,300 gold, $65 silver and $5 copper give $9.72 NAV before premium and a $14.65 target.
Selected case: $5,000 gold, $75 silver and $5 copper give $12.93 NAV before premium and a $19.47 target.
Strong metals: $5,500 gold, $100 silver and $6 copper give $17.28 NAV before premium and a $25.98 target.
Each case holds nominal prices flat over the remaining schedules. The premium stays fixed at 1.5x producing-mine NAV so the comparison isolates the metal deck. In a weaker market, the market could also apply a lower multiple, compounding the downside.
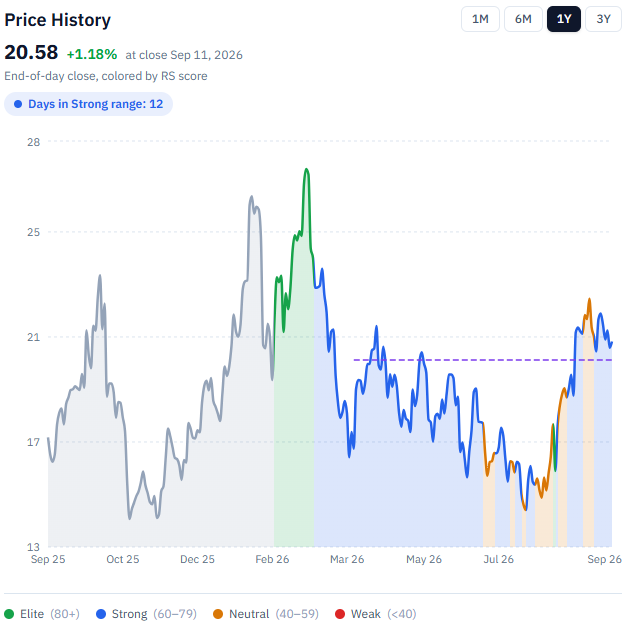
My March article used a $19.88 target. The new $19.47 target is about 2% lower, despite allowing a constructive metal deck and meaningful credit for future extensions. At the $20.58 reference price, downside to the target is approximately 5.4%, excluding dividends. The operating recovery can still create value, but the current price leaves little margin for disappointment.
Testing a wider range of outcomes
I reran 10,000 illustrative simulations around $5,000 gold, $75 silver and $5 copper. Metal prices moved together to varying degrees, while production, cash costs and the discount rate also varied. The chart separates NAV before the premium from the value obtained by holding the producing-mine multiple at 1.5x.
Median NAV before premium is $11.98, with the central 80% of results between $6.22 and $17.61. Including the fixed premium, the median value is $18.01 and the central 80% spans $9.38-$26.47. About 34% of premium-inclusive values exceed $20.58.
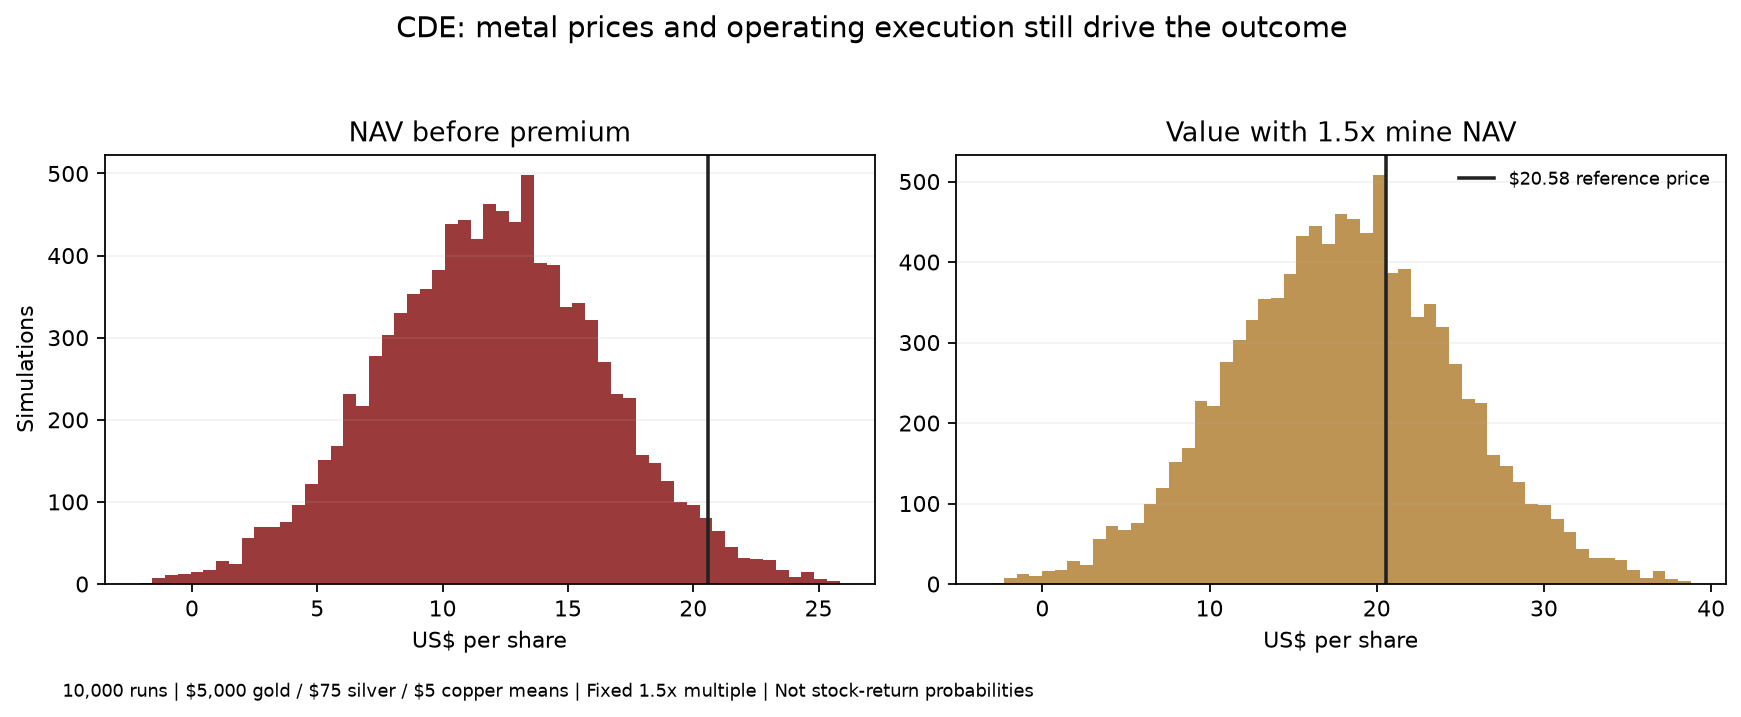
The exercise keeps the named option allowances fixed and production at or below the current scheduled volumes. Future extensions are represented only by the premium, with no extra ounces added to the operating schedules. A fixed 1.5x multiple does not capture the risk that disappointing exploration or weaker markets could also reduce the premium.
The risks that would change my view
Execution risk has materialized. Another delay at New Afton or Rainy River would weaken confidence in the inherited mine plans. The immediate tests are New Afton’s 16,000-tonne daily rate early in Q4 and Rainy River’s 5,000-tonne exit rate at year-end, followed by sustainable grades and cash costs.
Cost inflation remains active. Diesel, maintenance and labour can absorb some of the benefit from higher metal prices. At Rainy River, I also want to see whether the revised spending base persists into 2027.
Financing risk has faded. Net cash gives CDE more room to fund the work. It does not make every expansion worth pursuing.
Metal-price and reserve-conversion risks remain. A portfolio concentrated in North America still faces currency movements, permitting, taxes and operating disruption. The undeveloped projects must earn their place in the valuation through technical progress and credible economics.
My verdict
HOLD, with a $19.47 price target and $12.93 of equity NAV before the growth premium. CDE generates enough cash to fund the operating work and exploration, and the mine-life opportunities justify looking beyond the scheduled reserves. Even after allowing for that upside, the target remains about 5% below the reference price. CDE enters my trim list.
If I trim, I will most likely replace it with another gold position. I like to retain some exposure to gold, even if the position is small.
I may go back to IAG. I held it before rotating into NGD, which subsequently became our CDE holding. The comparison below puts IAG’s overall score at 76.7 and valuation at 72.4, against 62 and 42.2 for CDE.
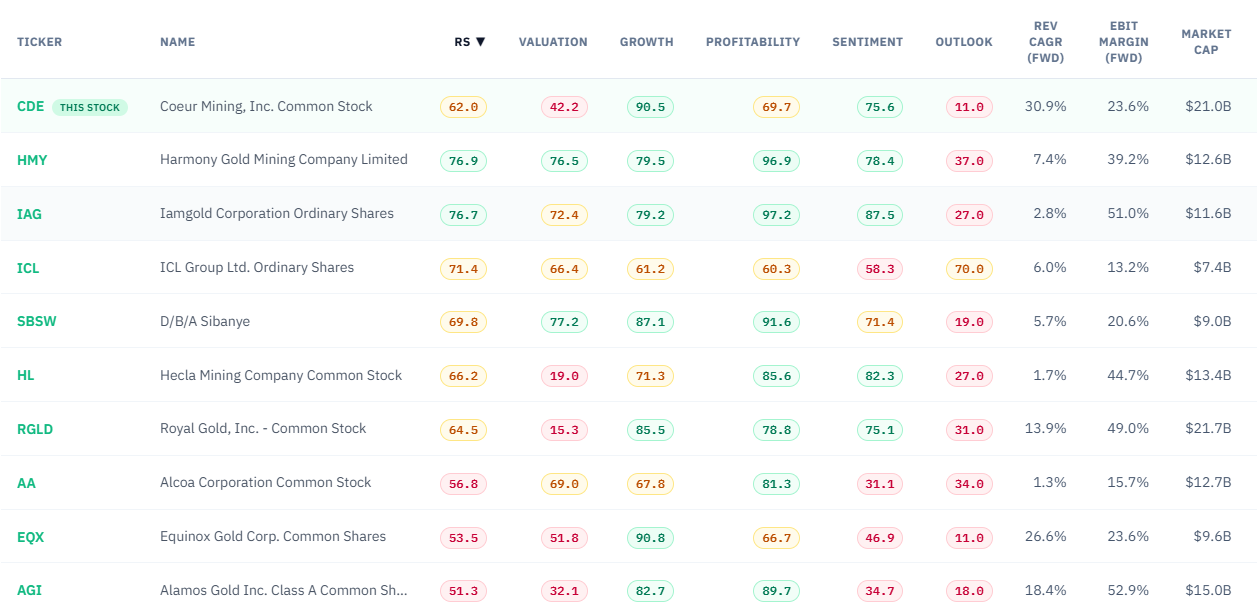
IAG’s Q2 results give that investigation a concrete starting point. Côté commissioned its second cone crusher, replaced a conveyor belt and ran near full capacity in June. Management expects a stronger second half, while a Q4 technical report should outline a path toward 40,000 tonnes per day. Côté and Gosselin contain 20.3M ounces of measured and indicated resources, which still need to be distinguished from mineable reserves. IAG also ended Q2 with $52M of net cash excluding leases.
The attraction is better Côté production and lower unit costs. The questions are execution, capital requirements, IAG’s 70% Côté ownership and the risks attached to Essakane in Burkina Faso. I need further analysis of the assets and valuation before deciding whether IAG deserves another place in the portfolio.
Gold keeps its place in the portfolio. CDE has to justify how much of that place it occupies.
Portfolio Update
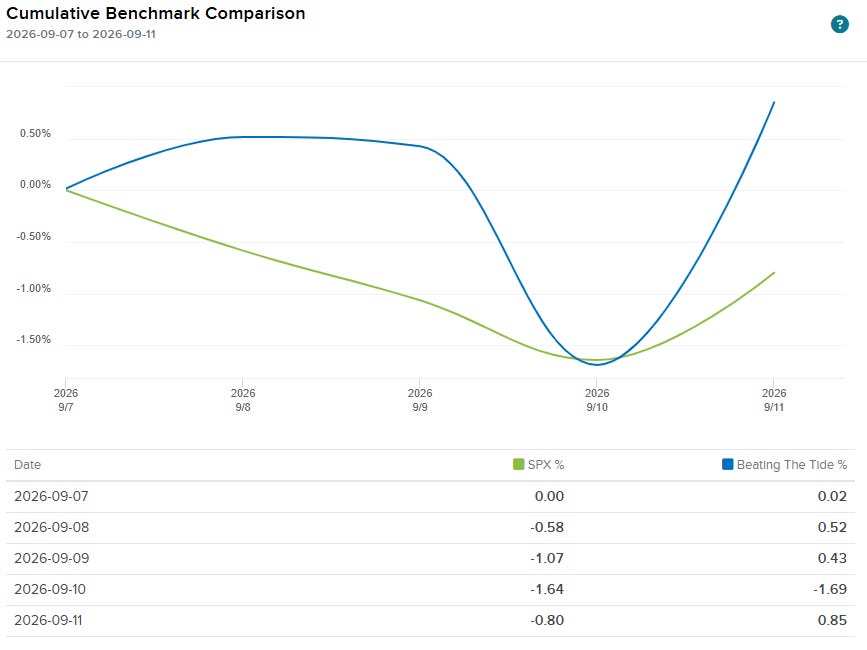
The portfolio gained 0.85% this week while the S&P 500 fell 0.80%, a lead of 165 basis points. By Thursday, both were down more than 1.6%. Friday’s rebound brought the portfolio back into positive territory, while the index finished the week in the red.
Portfolio Return
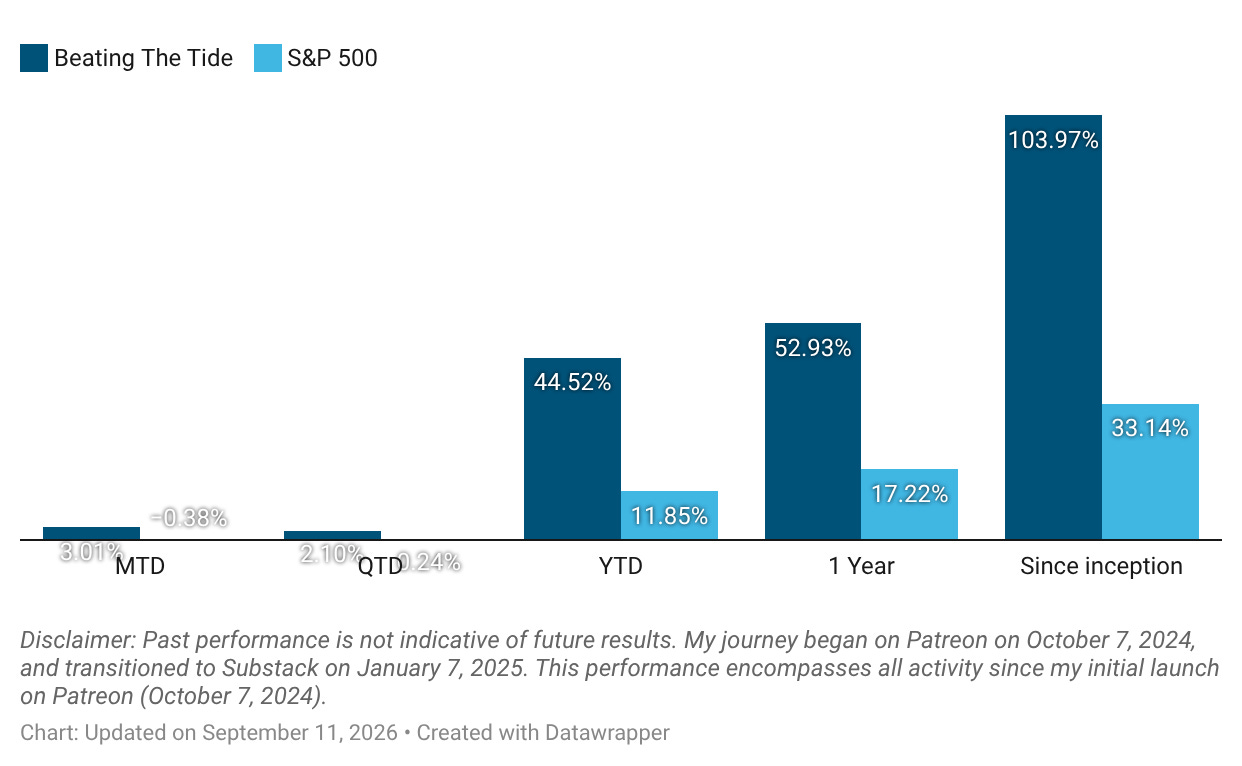
Month-to-date: +3.0% vs. the S&P 500’s -0.4%.
Year-to-date: +44.5% vs. the S&P 500’s +11.9%. That is a gap of 3,267 basis points.
Since inception: +104.0% vs. the S&P 500’s +33.1%. That’s 3.1x the market.
Contribution by Sector
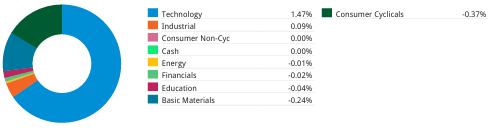
Technology carried the week, adding 147 basis points, with another 9 from industrials. Consumer cyclicals and basic materials were the main drags, subtracting 37 and 24 basis points. The remaining sectors were close to flat or slightly negative.
Contribution by Position
How to read the heat map? Click here.
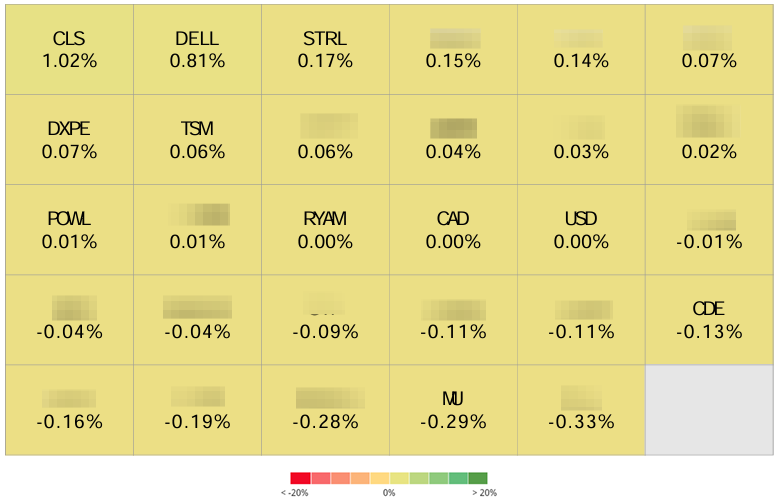
+102 bps CLS (TSX: CLS) (Thesis)
+81 bps DELL (Thesis)
+17 bps STRL (Thesis)
+7 bps DXPE (Thesis)
+6 bps TSM (Thesis)
+1 bps POWL (Thesis)
0 bps RYAM (Thesis)
-13 bps CDE (Thesis)
-29 bps MU (Thesis)
That’s it for this week.
Stay calm. Stay focused. And remember to stay sharp, fellow Sharks!