



Hello fellow Sharks,
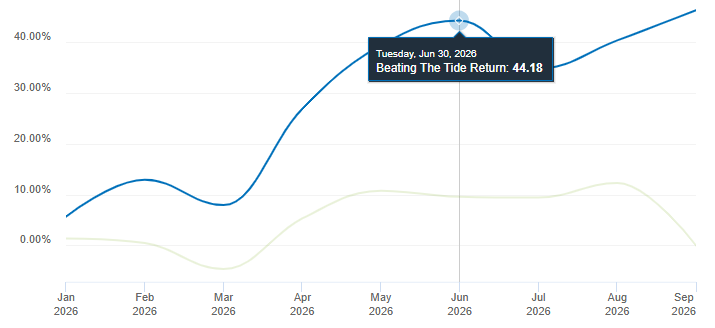
The portfolio is up 46.2% YTD, and this week I’m looking back at the Synchrony Financial [SYF 0.00%↑] investment: what worked, what I missed, and why I sold after a 56.6% total return. If you want to skip straight to the numbers, jump to the Portfolio Update.
This week we hit an all time high passing the record from June.
As some of you know, my son was born this week. He and his mother are healthy, and we’re all very happy! Very tired, but very happy. Luckily, I worked on the Thought of the Week beforehand. I hope to return to my usual rhythm next week 🙂

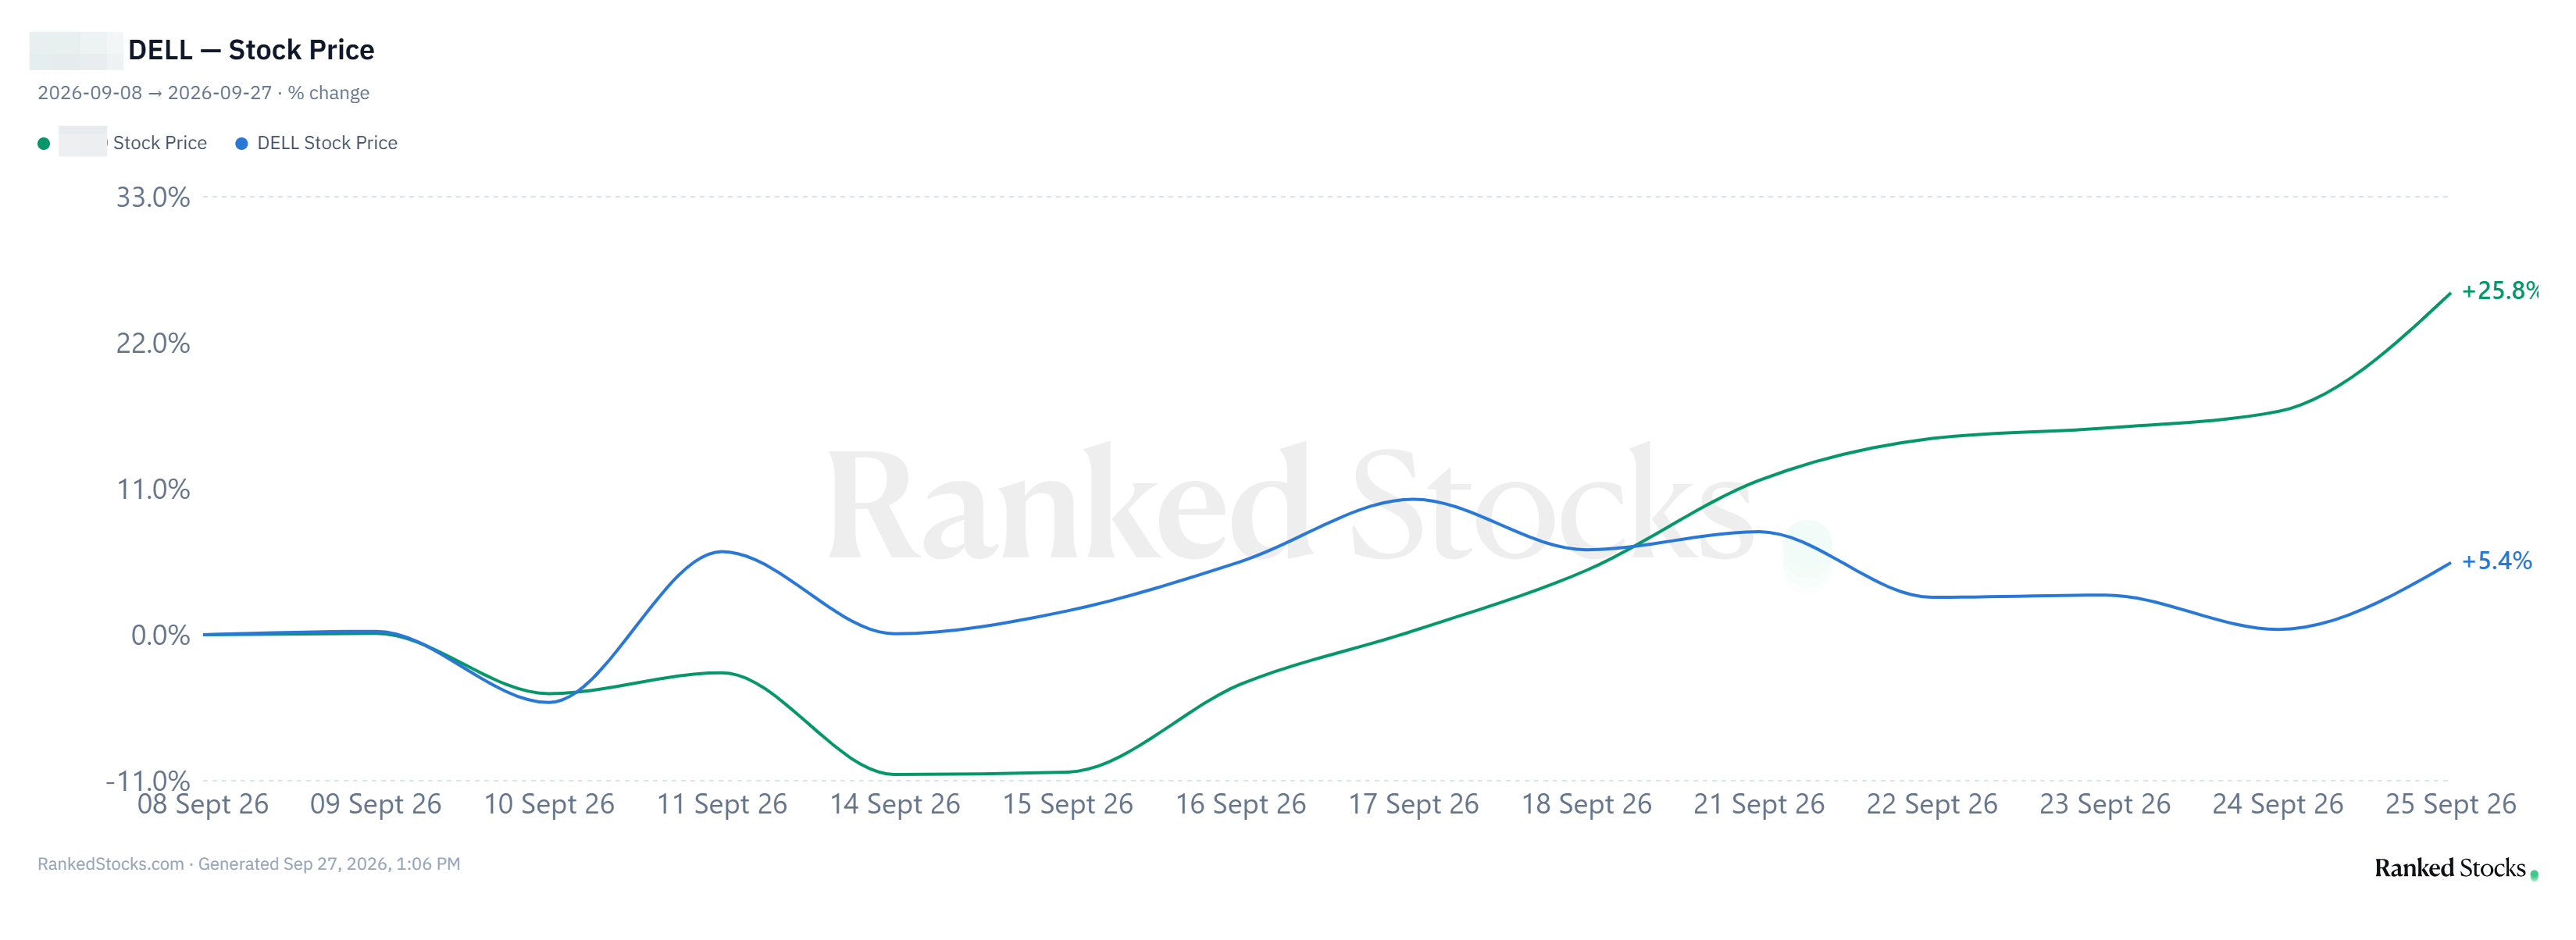
CRDO recovered some ground this week after its sharp earlier this month. Earlier this month, one of our positions hard post-earnings selloff. In my Q1 FY2027 update, I explained why I kept the BUY on that stock after a record quarter and a raised full-year guidance. I reallocated some capital from DELL to this position which increased from 4% to 6%.

So far, the rebalancing looks like a great choice.
Enjoy the read, and have a great Sunday.
~George
Table of Contents:
Thought Of The Week
Synchrony Financial: Why I Sold After +56.6%
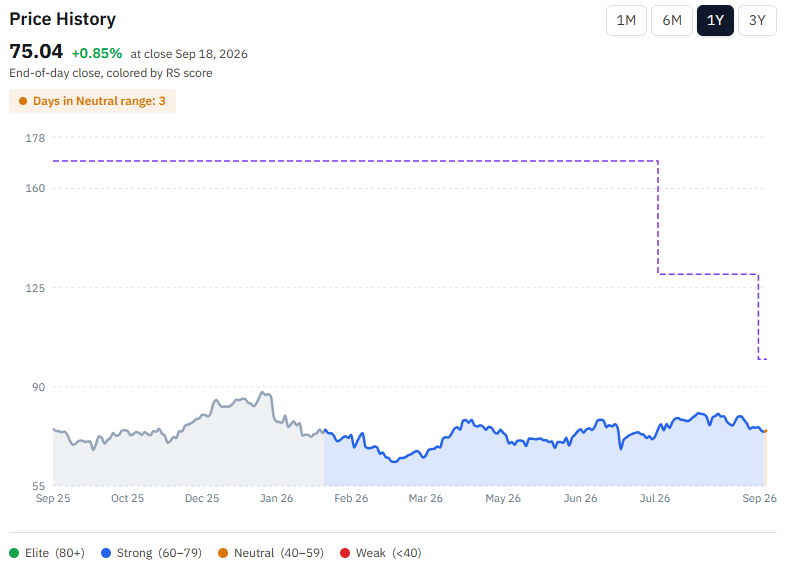
On Sep 15, 2026, I closed SYF at $75.55 per share. The position had entered the portfolio at a $49.75 cost, so I locked in a 52% capital gain. Including $2.34 per share of dividends collected during the holding period, the total return was 56.6%.
That is a good result. It is also a good point to separate the investment outcome from the stock rating.
I sold the position to help fund the September stock pick. As I explained in the September pick, the move was about where the next dollar could work hardest: SYF had already rerated, while the new bank offered a valuation gap I could trace to an overlooked cost-of-equity assumption.

I also trimmed DELL to finance the remaining gap. The sale was a portfolio allocation decision: SYF had delivered much of the rerating I expected, while the new idea offered a more attractive combination of upside, downside protection and visible catalysts.
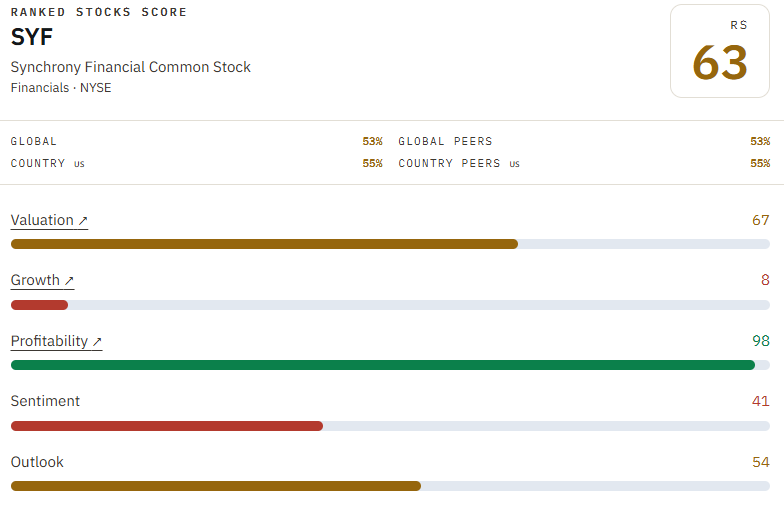
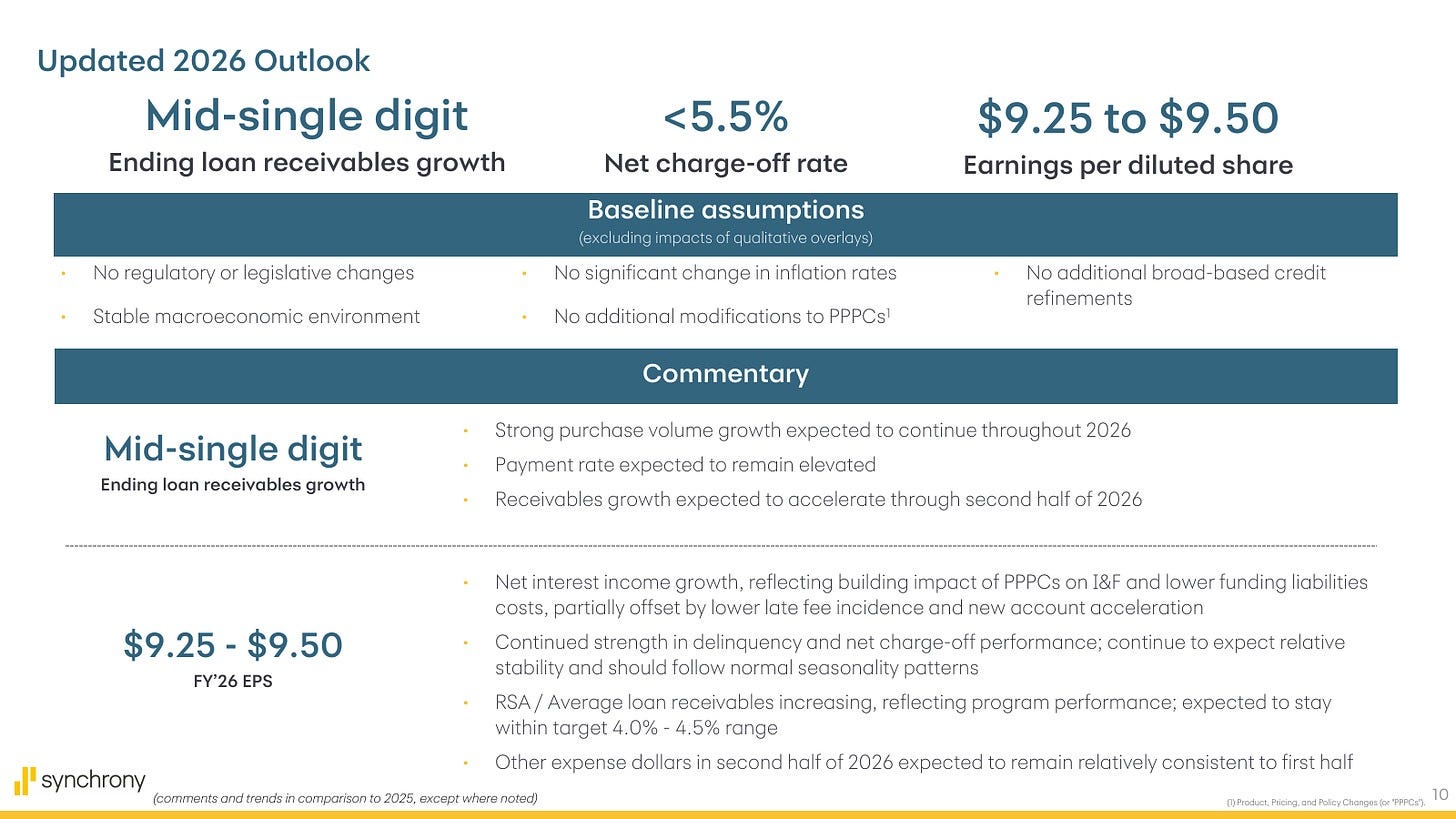
My rating on SYF remains HOLD. I expect the shares to move largely sideways because I don’t see a material catalyst that can force the market to close the remaining valuation gap. I am also reducing my target price from $130 to $100 and setting the downside scenario at $60.

Upgrade to paid to see the September stock pick that replaced it, including the company name, full thesis and valuation. The average return per pick has been +50%, more than paying for the annual subscription.
TLDR
Rating: HOLD. I expect the stock to be roughly sideways because there is no material catalyst in front of it.
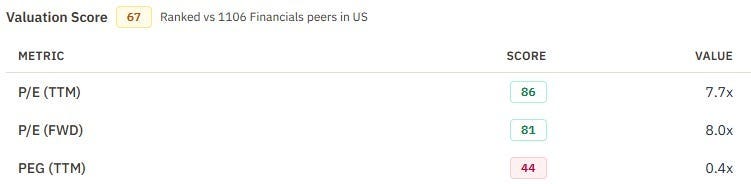
Target: $100, down from $130. The target comes from my updated DCF, which now assumes slower medium-term receivable and earnings growth, less benefit from buybacks as capital normalizes, and a higher return requirement for the remaining credit and funding risk. It translates to about 10.7x the midpoint of 2026 EPS guidance and 2.4x Q2 tangible book value per share.
Downside: $60. The downside DCF assumes weaker balance growth, higher credit costs and slower capital return. It translates to about 6.4x the midpoint of guidance and 1.4x tangible book value per share.
The investment worked. I closed the position on Sep 15, 2026 after a 52% capital gain. Dividends increased the total return to 56.6%.
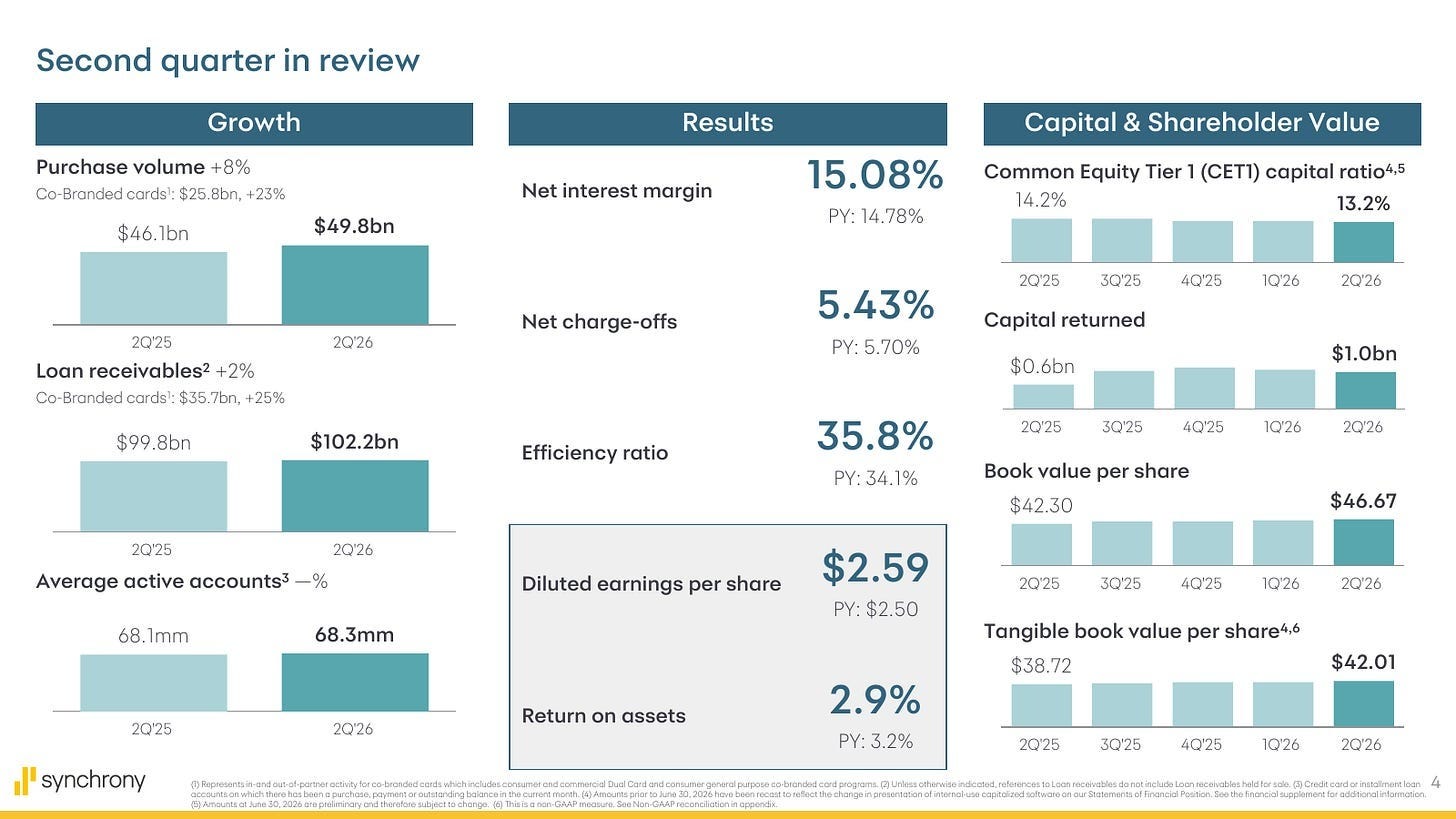
The remaining setup is less attractive. Q2 purchase volume grew 8% and credit improved, but loan receivables grew only 2%, net earnings fell 8%, expenses increased 7%, the efficiency ratio deteriorated to 35.8%, and CET1 fell 100 bps y/y to 13.2%.
Per-share growth is doing more work than operating growth. Diluted EPS rose to $2.59 because the diluted share count fell about 12% y/y. Buybacks are valuable at the right price, but they aren’t the same as a strengthening earnings engine.
What I believed
The original thesis wasn’t that SYF would suddenly become a high-growth company. It was that the market was pricing a normal credit-card cycle as if the earnings damage would be permanent.
The stock was cheap, the balance sheet could absorb credit normalization, and the retailer-share arrangement structure gave the company an unusual shock absorber. When program economics weaken, the amount shared with retail partners declines. When economics improve, partners participate in the recovery. That alignment doesn’t eliminate risk, but it prevents the full swing in credit costs from landing on shareholders.
I also believed management could use excess capital to buy back a large portion of the company while the valuation remained depressed. That mattered because a shrinking share count could turn modest earnings growth into much stronger per-share growth.
Finally, I expected credit to normalize rather than collapse. The 2022 and 2023 earnings calls showed delinquencies and losses moving back toward pre-pandemic behaviour as excess savings faded and payment rates moderated. Management tightened credit from mid-2023 through early 2024, accepting slower account and purchase-volume growth to improve the portfolio that would emerge on the other side.
Those beliefs were broadly right.
What worked
Belief #1. Credit normalization was manageable
Credit didn’t break and that was the most important part of the thesis.
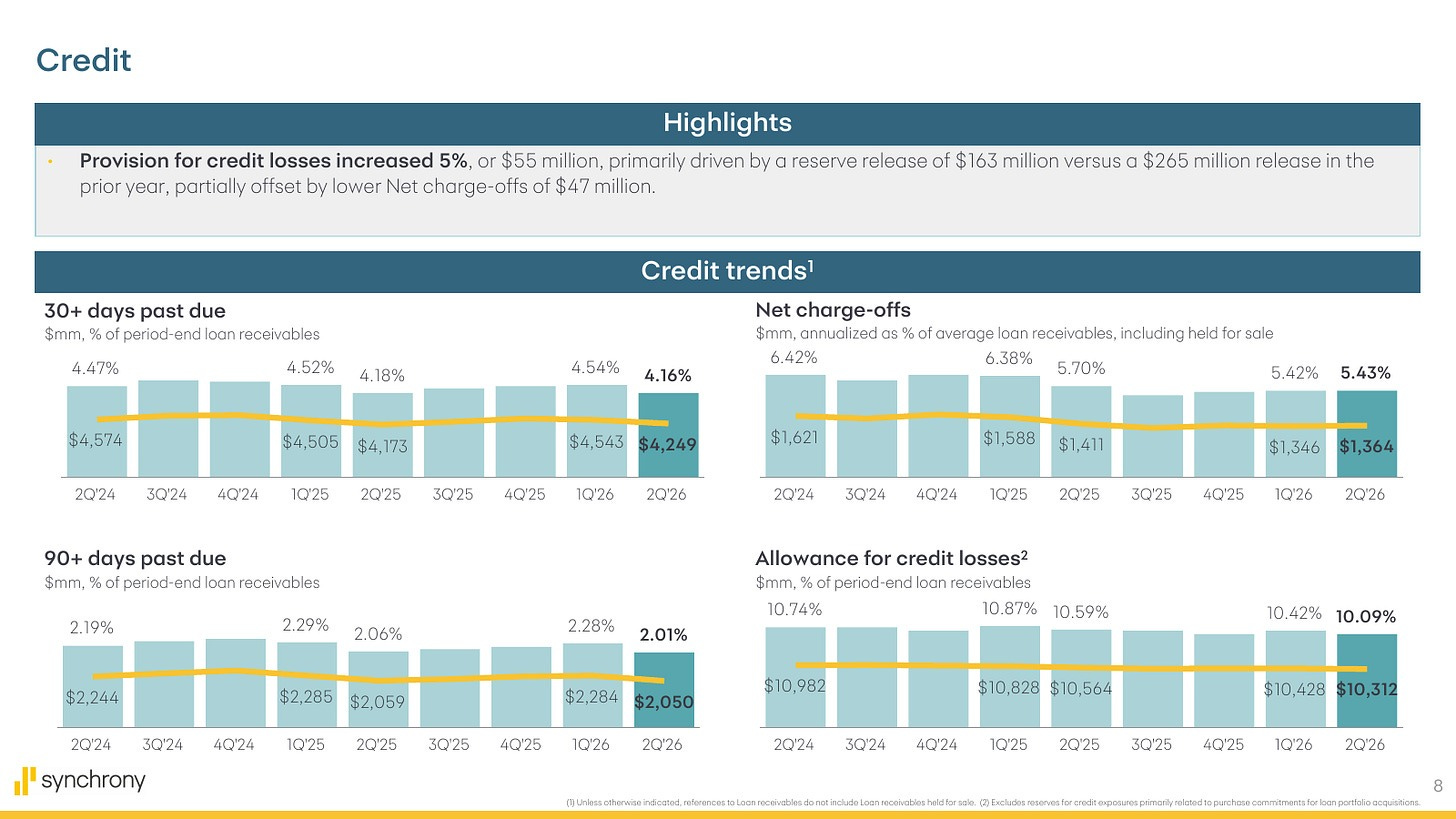
In Q2 2026, the net charge-off rate declined 27 bps y/y to 5.43%. The 30+ delinquency rate fell to 4.16%, the 90+ rate was 2.01%, and the allowance coverage ratio declined to 10.09%. Management still expects full-year net charge-offs below 5.5%, near the long-term range it has discussed for years.
The path matters. In 2022 and 2023, management described a K-shaped normalization, with lower-credit borrowers weakening first. In 2024, SYF deliberately restricted credit and accepted weaker volumes. In 2025, those actions began to show up in lower delinquencies, lower charge-offs and reserve releases. By 2026, the company could reopen the growth engine without losing control of credit.
Belief #2. Capital return would drive per-share value
This also worked, although more aggressively than I expected.
SYF returned $950M to shareholders in Q2 alone, including $850M of repurchases and $100M of common dividends. The diluted share count fell from 379.1M to 334.1M y/y, a 12% reduction. That decline helped diluted EPS rise 3.6% to $2.59 even though net earnings fell 8% to $885M.
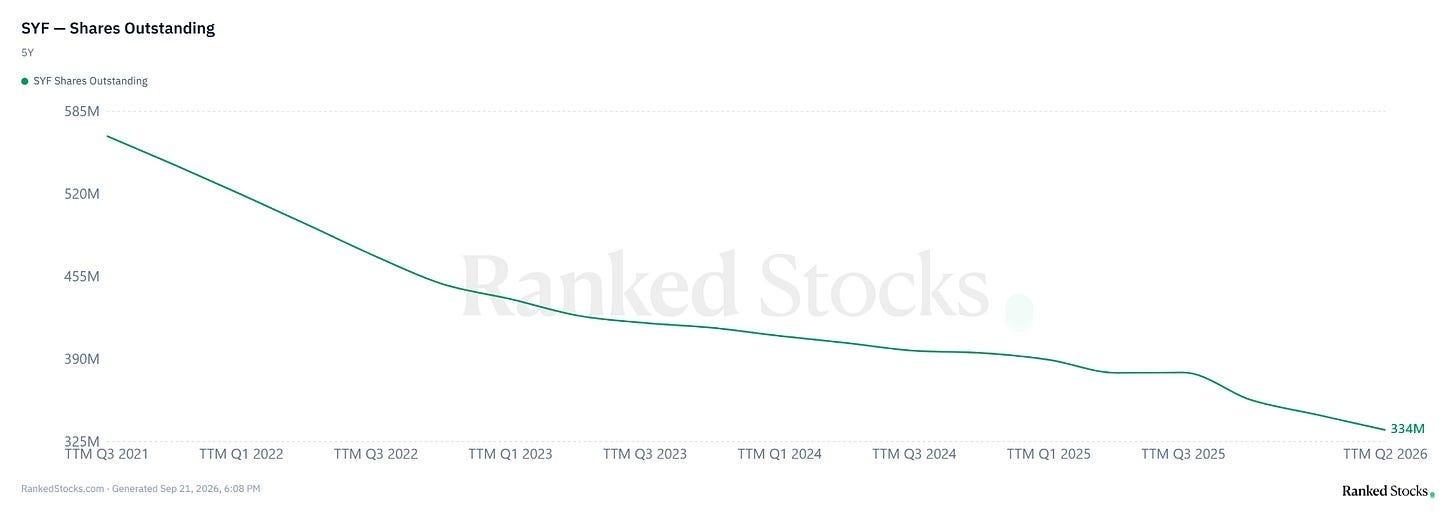
The company still had $5.7B of repurchase authorization at quarter-end. At the September exit price, that authorization equaled more than 20% of the market value. This remains the clearest support under the stock.
Belief #3. A cheap starting valuation left room for a rerating
The market didn’t need SYF to become a different company. It only needed the feared credit outcome not to arrive.
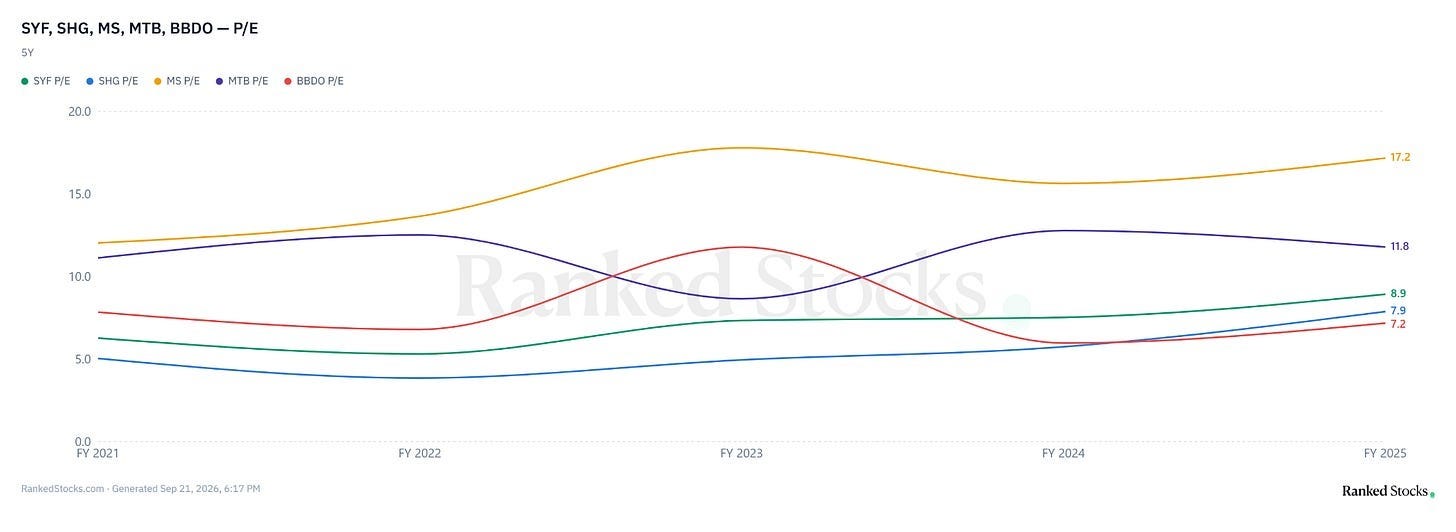
At my $49.75 cost, the shares were priced at a mid-single-digit earnings multiple. By the time I exited, credit had improved, the late-fee shock had been partly offset by product, pricing and policy changes, and management had proven willing to retire shares at scale. The stock could rerate while the business remained recognizably the same.
That is what happened. The position gained 52% before dividends even though receivable growth stayed modest and the market never awarded SYF a premium multiple.
What I missed
Miss #1. I gave too much credit to EPS growth
Q2 is the cleanest example. Diluted EPS increased from $2.50 to $2.59, but net earnings declined from $967M to $885M. The share count, not stronger aggregate profit, created the increase.
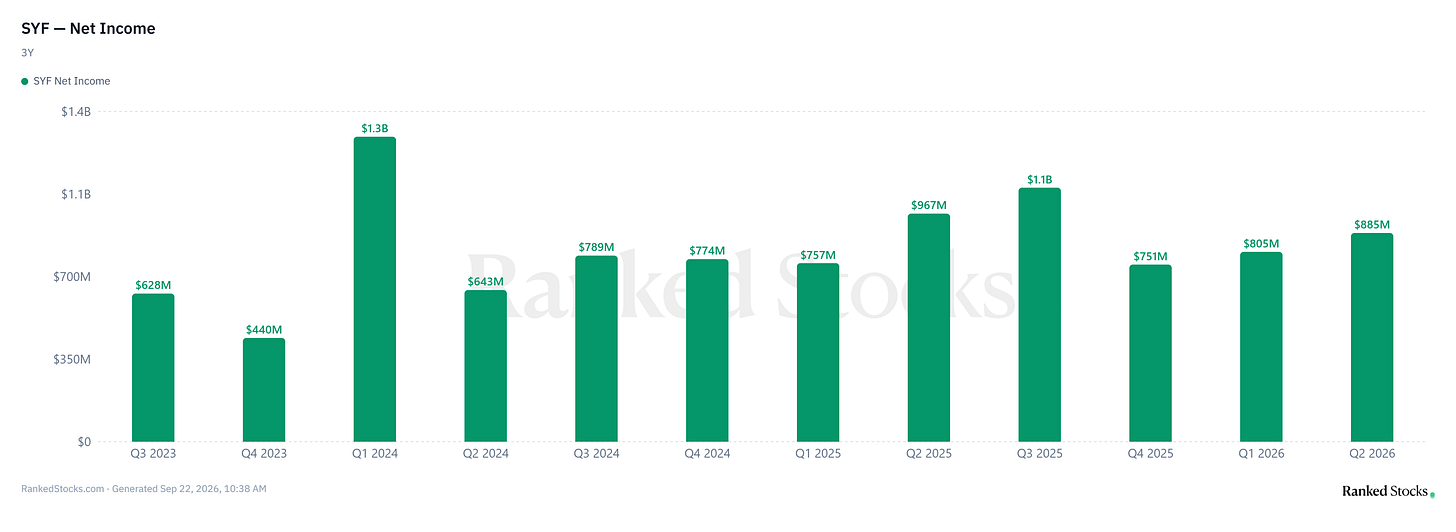
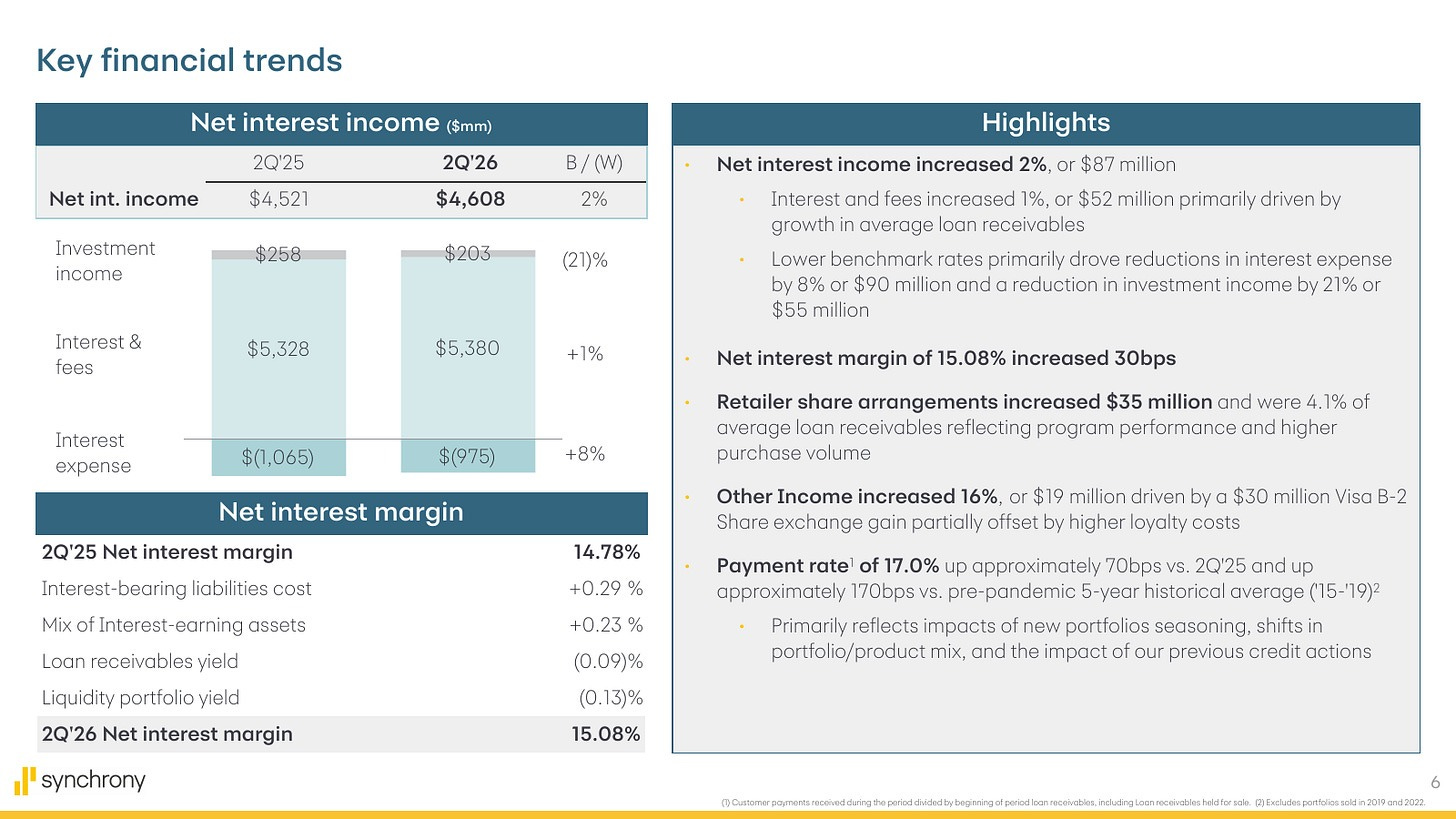
Buybacks at an attractive valuation create real value. Still, there is a limit to how long a company can use capital return as the main growth engine. Receivables grew only 2% despite purchase volume growing 8%. The payment rate was 17%, approximately 170 bps above the pre-pandemic Q2 average, which means customers are spending but paying balances down quickly. That is healthy for consumers and less helpful for a lender that earns on revolving balances.
Miss #2. The $130 target required a catalyst that wasn’t there
My July $130 target came from a DCF that gave SYF too much credit for sustained earnings growth and capital return. It assumed improving credit, lower funding costs and buybacks would compound into stronger shareholder cash flows for longer. Q2 showed that receivable growth, payment rates, expenses and capital constraints make that path less certain.
The business is improving, but several offsets keep the earnings story from becoming clean. Better credit reduces losses but also lowers late-fee income. Higher program profitability raises retailer-share arrangement expense. New accounts and promotional balances can lift volumes while initially carrying lower yields and higher payment rates. Technology spending continues, and operational losses have added noise. The result is a franchise that produces excellent returns without offering a simple path to faster aggregate profit growth.
The old target treated theoretical upside as if it were likely to be realized on a useful timetable. That was too optimistic.
What changed since the thesis
The company is safer than it was when I bought it, but the stock is also less mispriced.
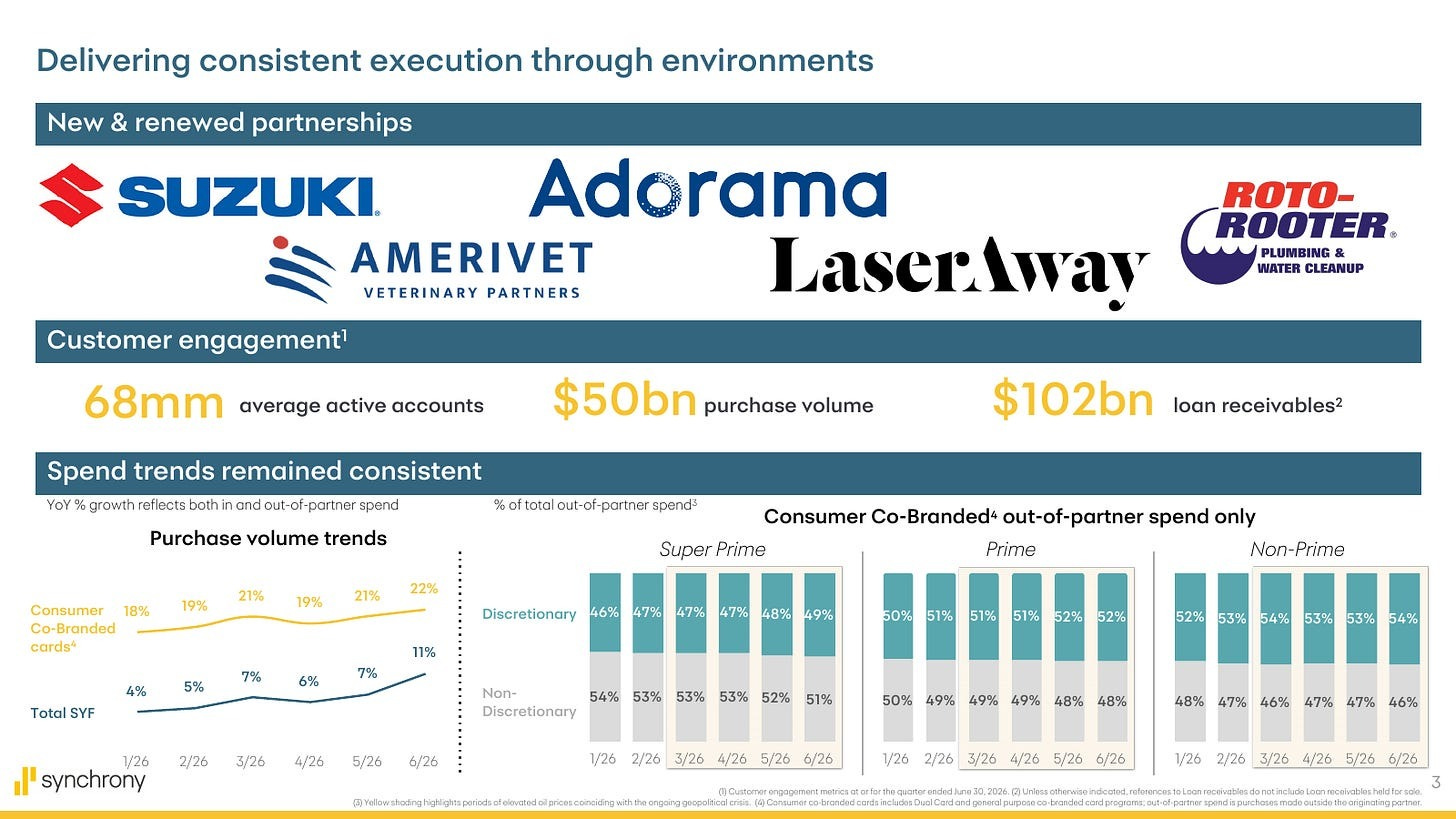
Growth has returned, but it isn’t converting cleanly into balances. Q2 purchase volume increased 8% to $49.8B, co-brand volume increased 23%, and average active accounts turned positive. Ending receivables increased only 2% because payment rates remained elevated. Management expects mid-single-digit receivable growth by year-end, which requires acceleration in the second half.
Margin has less room to surprise. NIM increased 30 bps y/y to 15.08% as funding costs fell and the mix of receivables improved. Sequentially, however, NIM fell 42 bps. Lower late fees reduced the margin by approximately 31 bps sequentially, and higher liquidity ahead of expected growth reduced it by another 16 bps through mix.
Expenses are absorbing more of the benefit. Other expense increased 7% y/y to $1.3B. The efficiency ratio rose 170 bps to 35.8%, reflecting technology investment, operational losses and higher retailer-share arrangements. Management expects second-half expenses to be roughly in line with the first half, so there is no near-term cost reset in the guidance.
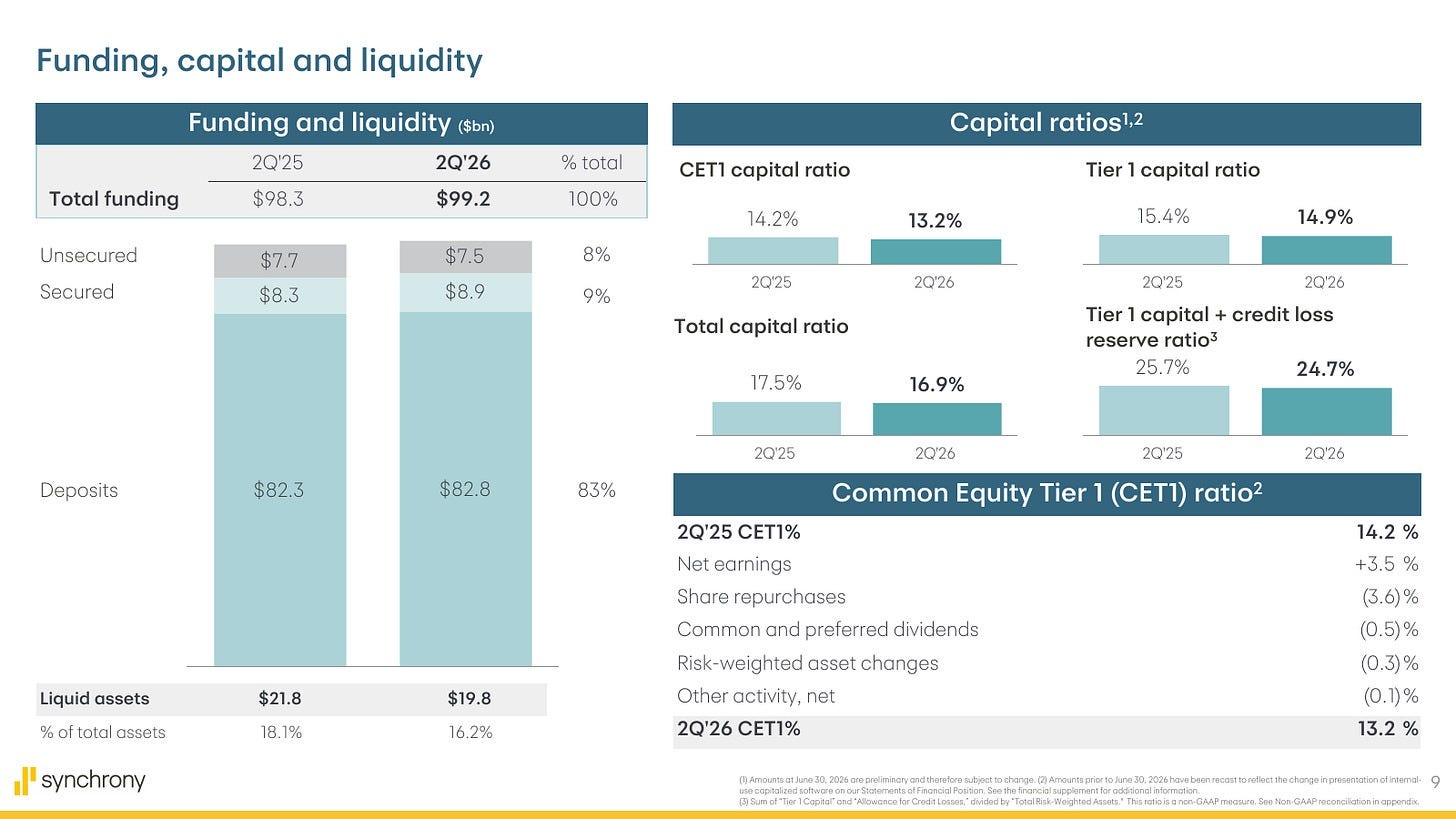
Capital return remains large, but it has a boundary. CET1 ended Q2 at 13.2%, down 100 bps y/y, after repurchases reduced the ratio by 360 bps and earnings rebuilt 350 bps. Management wants to move toward an 11% target, but loan growth, preferred dividends and regulatory capital all compete with buybacks for the same dollar.
Industry trends and outlook
The credit-card industry looks healthier than the bear case, but it doesn’t offer SYF an obvious rerating catalyst.
The New York Fed’s Q2 2026 Household Debt and Credit Report showed credit-card balances increasing $21B q/q to $1.26T. Credit-card transitions into early delinquency were largely steady, while aggregate delinquency across household debt improved slightly. Consumers are still using credit, but the data doesn’t point to a fresh wave of distress or a dramatic release of pent-up borrowing.
TransUnion’s Q2 2026 Credit Industry Insights Report tells a similar story. Bankcard balances increased 4.4% y/y to $1.14T and originations increased 11.8% to 20.6M. Borrower-level 90+ delinquency increased to 2.26% from 2.17%, driven largely by a larger subprime population, while balance-level delinquency was nearly flat at 1.98%. Lenders are reopening growth, but they are doing it with smaller lines and tighter risk controls.
The Federal Reserve’s July 2026 lending survey adds an important constraint. Banks tightened credit-card standards during Q2 while demand was basically unchanged. Standards also remained at the tighter end of their historical ranges, especially for subprime borrowers. That supports credit quality, but it limits how quickly the industry can convert stable demand into balance growth.
SYF’s own earnings calls show the same sequence:
2022-2023: payment rates normalized, receivables grew quickly and credit moved back toward pre-pandemic behavior.
2024: management tightened underwriting as charge-offs rose and the late-fee rule created uncertainty. Purchase volume and new-account growth slowed.
2025: credit actions worked. Delinquencies and charge-offs improved, reserve releases supported earnings, and retailer-share arrangements absorbed part of the benefit.
2026: account and purchase-volume growth reopened, but elevated payment rates, lower late-fee incidence, growth-related provisioning and technology investment muted the earnings conversion.
The industry outlook is therefore stable rather than exciting. Credit losses appear contained, funding costs are lower, and card balances are growing. At the same time, underwriting remains tight, payment rates are elevated, consumer demand isn’t accelerating, and issuers are competing for growth with rewards and higher acquisition costs.
For SYF, that mix probably produces decent earnings and ongoing buybacks. It doesn’t create the kind of surprise that forces investors to pay a much higher multiple.
Why the target is now $100
The updated DCF produces a $100 target, down from $130. The old valuation assumed a cleaner and longer compounding path than SYF’s current fundamentals support.
The biggest change is medium-term growth. I now assume receivables and aggregate earnings grow more slowly because payment rates remain elevated, underwriting stays tight and technology spending absorbs part of the credit and funding benefit.
I also assume less incremental value from buybacks as CET1 moves toward management’s 11% target and balance-sheet growth competes for capital. Together with a higher required return for the remaining credit, funding and execution risk, those changes reduce the DCF value to $100 per share.
A $100 target translates to about 10.7x the midpoint of management’s 2026 EPS guidance and 2.4x Q2 tangible book value per share. The $60 downside DCF assumes weaker loan growth, higher credit costs and slower capital return. It translates to about 6.4x guidance and 1.4x tangible book value.
At SYF’s September 25 closing price of $72.94, the $100 target implies about 37% upside and the $60 downside case implies about 18% downside. Those percentages look attractive in isolation. The problem is time and probability. Without a catalyst, the stock can remain cheap while the target drifts closer through book-value growth rather than price appreciation.
What would change my HOLD
I would reconsider if receivables grew at least mid-single digits without weaker credit, aggregate net earnings grew without relying primarily on buybacks, and CET1 stayed comfortably above the target.
I would turn cautious if charge-offs exceeded 6%, 30+ delinquencies accelerated beyond normal seasonality, reserve coverage rebuilt materially, or capital needs slowed repurchases.
Until one of those paths becomes visible, I expect the stock to trade around earnings reports and macro data without establishing a durable direction.
Verdict
SYF is an okay company. The stock is a HOLD.
The credit cycle stabilized, buybacks created value and the investment returned approximately 56.6% including dividends. From here, however, I expect the shares to move sideways because I don’t see a material catalyst.
I sold SYF to finance another financial company, the September stock pick, where I see a better combination of upside, downside protection and visible catalysts.
Portfolio Update
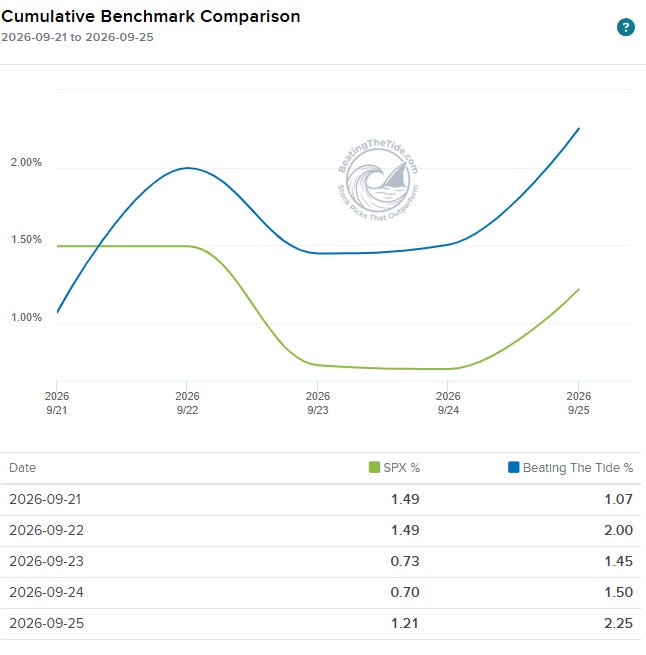
The portfolio finished the week ahead of the S&P 500. It gained about 2.2% for the week versus roughly 1.2% for the index. The YTD lead widened.
Portfolio Return
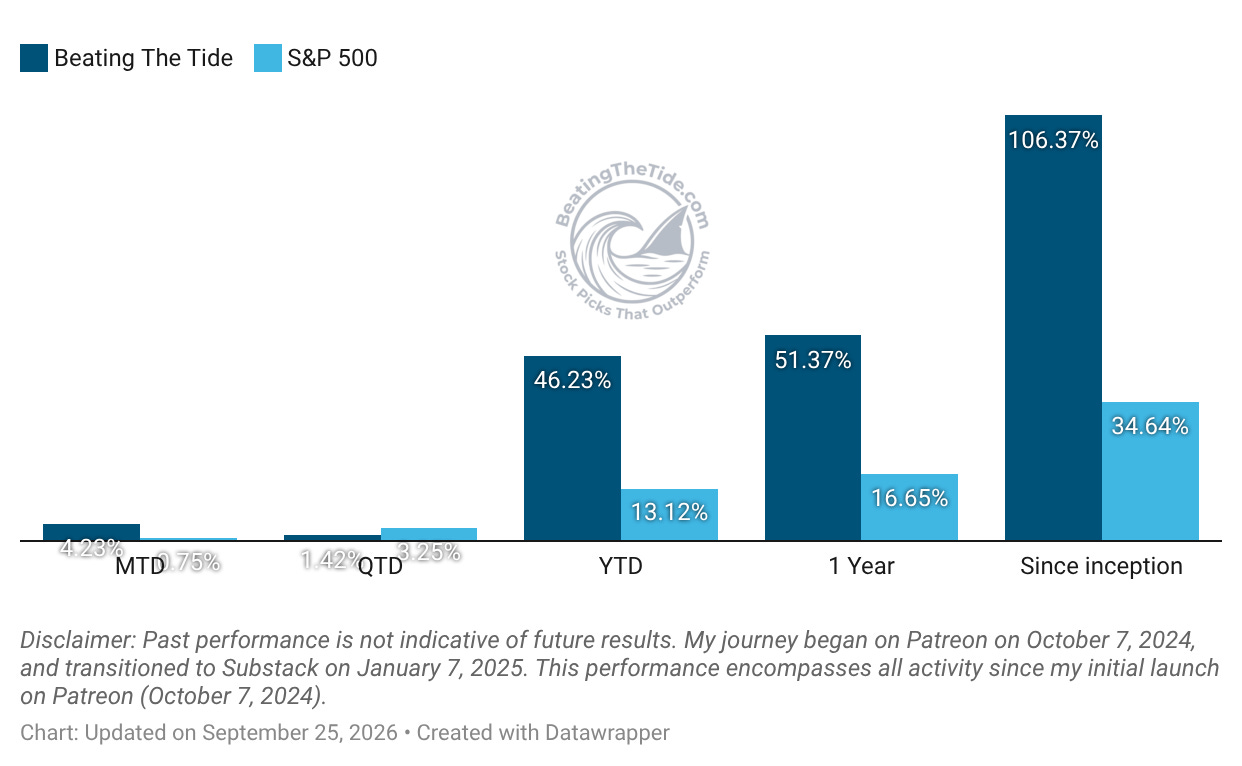
Month-to-date: +4.3% vs. the S&P 500’s +0.8%.
Year-to-date: +46.2% vs. the S&P 500’s +13.1%. That is a gap of 3,311 basis points.
Since inception: +106.4% vs. the S&P 500’s +34.6%. That’s 3.1x the market.
Contribution by Sector
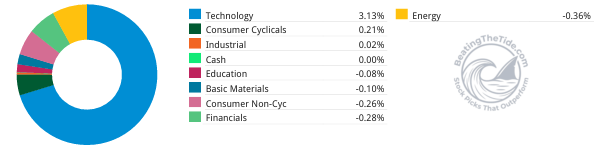
Technology did the heavy lifting. Energy and financials were the largest offsets. Across the market, AI hardware shares rebounded late in the week.
Contribution by Position
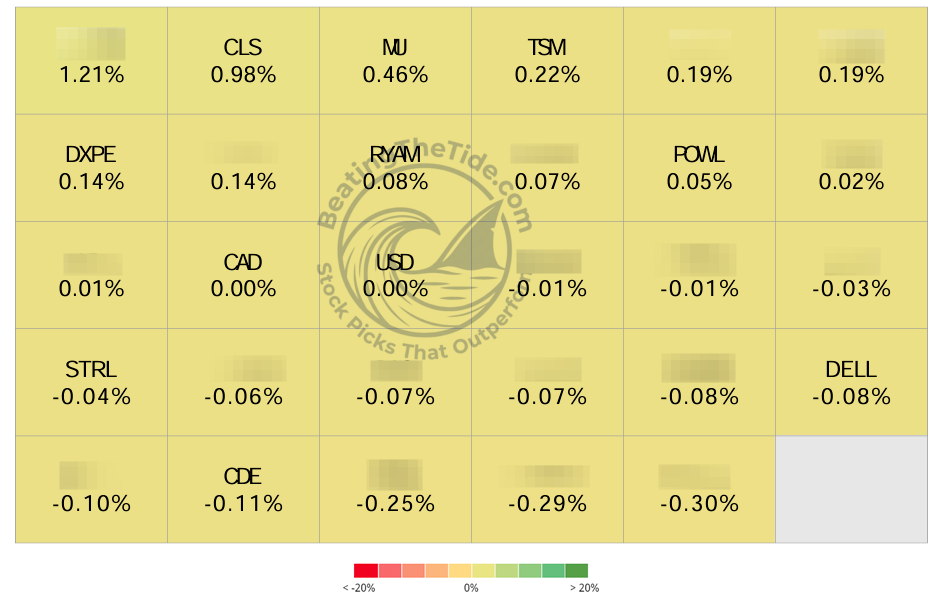
+98 bps CLS (TSX: CLS) (Thesis)
+46 bps MU (Thesis)
+22 bps TSM (Thesis)
+14 bps DXPE (Thesis)
+8 bps RYAM (Thesis)
+5 bps POWL (Thesis)
-4 bps STRL (Thesis)
-8 bps DELL (Thesis)
-11 bps CDE (Thesis)
That’s it for this week.
Stay calm. Stay focused. And remember to stay sharp, fellow Sharks!