



Hello fellow Sharks,
Last week was a strong one for the portfolio, and we finished ahead of the S&P 500. DXPE was one of the biggest contributors, and it is also the subject of this week’s Thought of the Week. If you want to skip straight to the numbers, jump to the Portfolio Update.
The publication crossed a milestone. We are now a community of more than 2,000 members. 🥳
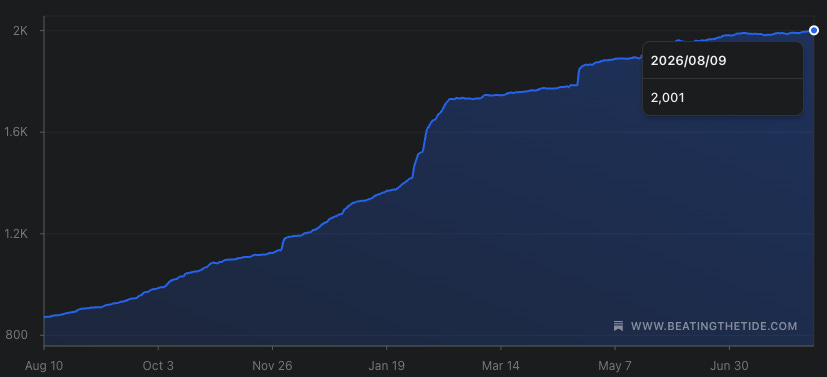
2,001 of you. That number was under 900 last August. To mark it I am opening 25 spots at 25% off the paid subscription, locked in for as long as you stay. The offer closes when the 25 spots go or on Saturday, August 15, whichever comes first.
Last week I asked whether you have access to non-US stock exchanges. Half of you have already traded outside the US, and only 18% have no interest in doing so.
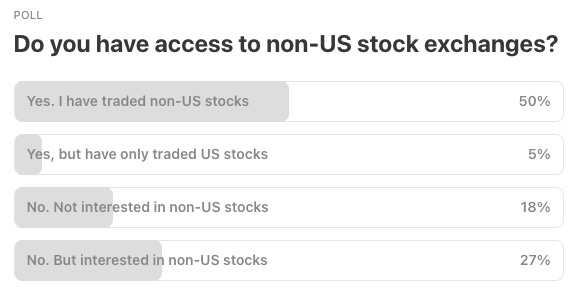
So I will start covering international names too. The August pick stays US-listed. I think I have found it, or at least narrowed it down to three candidates.
For the 27% that want access to non-US exchanges and are interested in Interactive Brokers, use my code and I will get a referral from IBKR 🙂.
Last week was also busy for earnings. 12 companies on my watchlist reported, ten beat on revenue and nine beat on EPS.
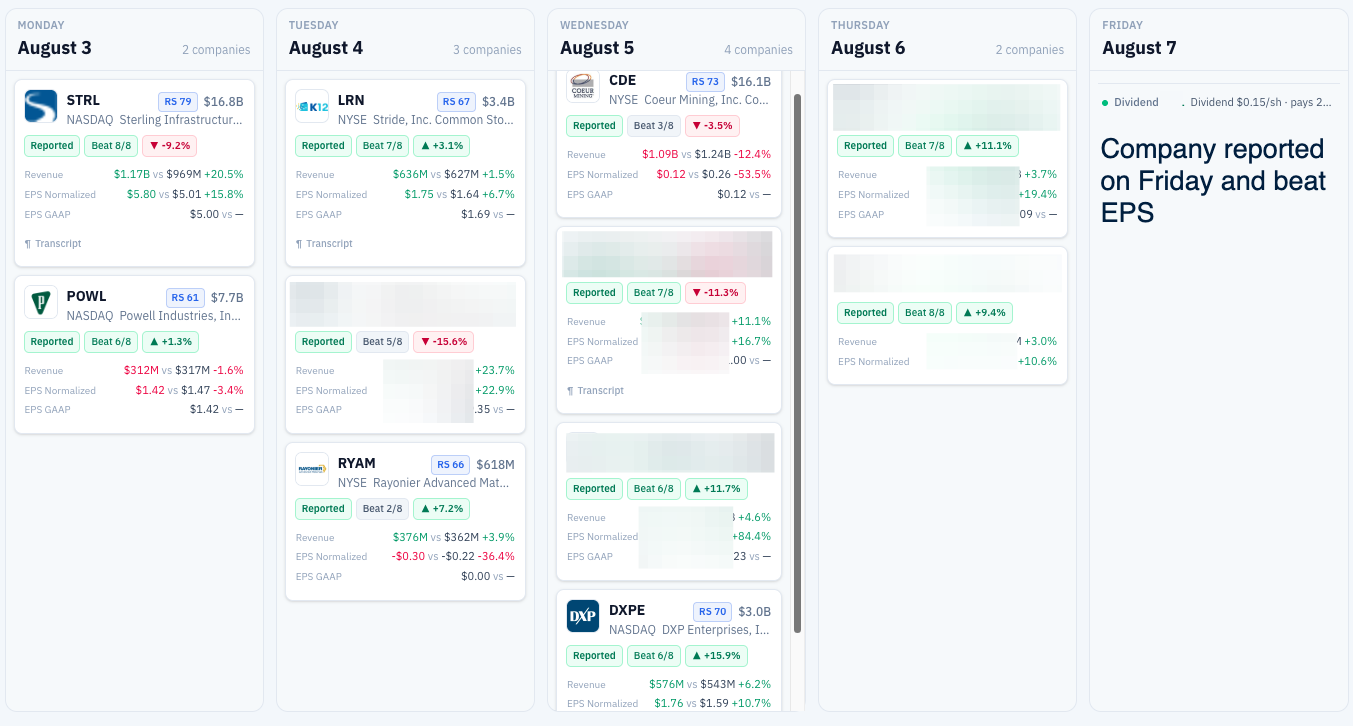
In case you missed it, I covered the STRL earnings on August 5th.

STRL printed the best quarter in its history, beat on both lines, raised full-year guidance for the second time this year, and the stock fell anyway. Mr. Market fixed on the E-Infrastructure operating margin dropping to 24.1% from 28.3% and read decay, when it is mix.
The acquired electrical business earns 11.4% compared to the upper 20s margin for site development. Every component margin improved and the consolidated adjusted EBITDA margin expanded 150bp, so my model goes to $1,030 against a $400 bear, risk reward of 1 to 3.5, and I upgraded STRL from HOLD to BUY.
This week’s Thought of the Week covers DXPE’s Q2 results.
This week I will keep working on the August pick and publish my view on the earnings results for a portfolio company. The company beat on both the top and bottom line, and the stock fell 8% on the print.
This coming week, three companies will be reporting earnings.

Enjoy the read, and have a great Sunday.
~George
Thought Of The Week
DXP Enterprises (DXPE) Q2 2026: Record Margins, Now A Trim
Table of contents
Since adding DXPE to the portfolio, it is up 105.6%.
![DXP Enterprises [DXPE] portfolio position tracker showing a HOLD rating, 4.2% portfolio weight, $93.54 cost basis, $192.36 share price and a 105.6% total return since inclusion. Source: Beating The Tide portfolio tracker, August 9, 2026.](https://substackcdn.com/image/fetch/$s_!UjOt!,f_auto,q_auto:good,fl_progressive:steep/https%3A%2F%2Fsubstack-post-media.s3.amazonaws.com%2Fpublic%2Fimages%2F24a53e4e-8e59-4e2e-ad4c-62f954f63e83_631x94.png "DXP Enterprises [DXPE] portfolio position tracker showing a HOLD rating, 4.2% portfolio weight, $93.54 cost basis, $192.36 share price and a 105.6% total return since inclusion. Source: Beating The Tide portfolio tracker, August 9, 2026.")
Last November I called the 20% post-earnings selloff an overreaction and told you the cost problems looked temporary. Four months later the Q4 print backed that up, and in Weekly #71 I raised fair value from $156 to $210.

I left one thread hanging in that piece. The energy-related backlog inside Innovative Pumping Solutions had fallen for two consecutive quarters, and I wrote that the next reading would be the data point to watch.
That thread is now tied off. Energy backlog rose in Q1 and rose again in Q2, up 7.3% sequentially. Strip out the large engineered projects DXPE has been converting into revenue and backlog sits 10% above where it ended Q1. The bucket refilled.
![DXP Enterprises [DXPE] three-year end-of-day share price history colored by RankedStocks RS score, showing the move from under $70 in 2024 to above $180 by August 2026, with 107 days spent in the Strong range. Source: RankedStocks.com / DXPE price history.](https://substackcdn.com/image/fetch/$s_!y_gL!,f_auto,q_auto:good,fl_progressive:steep/https%3A%2F%2Fsubstack-post-media.s3.amazonaws.com%2Fpublic%2Fimages%2F8cb20de1-39cd-4aea-8a6a-8a83c387fa8c_636x533.png "DXP Enterprises [DXPE] three-year end-of-day share price history colored by RankedStocks RS score, showing the move from under $70 in 2024 to above $180 by August 2026, with 107 days spent in the Strong range. Source: RankedStocks.com / DXPE price history.")
So the operating story is settled, and it is better than I modeled. Q2 was the first quarter in DXPE’s history above a 12% adjusted EBITDA margin, on the largest revenue base the company has ever reported.
Being right about a business and continuing to get paid for it are two different things. DXPE has doubled from my entry and is now 4.2% of the portfolio. My updated model says the shares are worth $225.
TLDR
Revenue grew 15.6% y/y with organic growth of 11.1%, beating consensus by 6.2%. Diluted EPS grew 23% and beat by 10.7%. Adjusted EBITDA grew 22.8% and the margin reached 12.2%, a level DXPE has never printed before.
Innovative Pumping Solutions grew 52.6% y/y and is now the profit story. DXP Water alone nearly doubled and now runs at close to 70% of the segment. Water and wastewater has stopped being a diversification talking point and started being the earnings engine.
The energy backlog question I left open in March is answered. Two quarters of sequential growth, and management is converting large engineered projects into revenue while still adding bookings.
I am raising fair value from $210 to $225 and keeping the rating at HOLD. The earnings base went up in all three segments. Offsetting that, I lifted the tax rate in the model from 21% to the 26% DXPE actually pays.
The shares already discount a good outcome. To justify today’s price on my own framework, IPS has to grow at just under 3.5% in perpetuity rather than the 4.5% I carry. That is a narrow gap to argue over.
DXPE joins my trim list. The upside and the downside are now the same size.
How DXPE ranks
DXPE scores 70 on RankedStocks, which puts it inside the top third of US-listed names and of its industrial peer group.
![DXP Enterprises [DXPE] RankedStocks composite score of 70 with factor scores for Valuation, Growth, Profitability, Sentiment and Outlook, plus global and country percentile rankings. Source: RankedStocks.com / DXPE stock scorecard.](https://substackcdn.com/image/fetch/$s_!E6Kt!,f_auto,q_auto:good,fl_progressive:steep/https%3A%2F%2Fsubstack-post-media.s3.amazonaws.com%2Fpublic%2Fimages%2Fdebbdf98-ca6d-4ff3-8c0a-ebef34328574_640x532.png "DXP Enterprises [DXPE] RankedStocks composite score of 70 with factor scores for Valuation, Growth, Profitability, Sentiment and Outlook, plus global and country percentile rankings. Source: RankedStocks.com / DXPE stock scorecard.")
Sentiment 95. It reflects a share price that has run hard and a quant screen that likes momentum.
Profitability 72. Capital intensity is close to nothing, asset turnover is high against its industrial peer group, and returns on capital sit well above the cost of the capital funding them. DXPE earns its returns from working capital discipline and pricing, rather than from a plant.
![DXP Enterprises [DXPE] RankedStocks profitability factor breakdown ranked against 803 US industrials peers, covering gross margin, EBIT and EBITDA margins, ROE, return on total capital, ROIC, capex intensity and asset turnover. Source: RankedStocks.com / DXPE profitability sub-scores.](https://substackcdn.com/image/fetch/$s_!Kgpf!,f_auto,q_auto:good,fl_progressive:steep/https%3A%2F%2Fsubstack-post-media.s3.amazonaws.com%2Fpublic%2Fimages%2F7cadd855-90b7-457e-bdb6-a651fe1b8af5_612x605.png "DXP Enterprises [DXPE] RankedStocks profitability factor breakdown ranked against 803 US industrials peers, covering gross margin, EBIT and EBITDA margins, ROE, return on total capital, ROIC, capex intensity and asset turnover. Source: RankedStocks.com / DXPE profitability sub-scores.")
Valuation 24. The screen is looking at two different companies. Trailing price to book and EV/IC score in the bottom quartile and PEG sits near the floor, while forward EV/EBIT and forward EV/EBITDA both score in the upper half. Trailing earnings still carry a Q1 that was DXPE’s weakest quarter in a year. The further out the screen looks, the better DXPE gets.
![DXP Enterprises [DXPE] RankedStocks valuation factor breakdown showing trailing and forward P/E, PEG, EV/Sales, EV/EBITDA, EV/EBIT, price to book and EV to invested capital against 803 US industrials peers. Source: RankedStocks.com / DXPE valuation sub-scores.](https://substackcdn.com/image/fetch/$s_!ep-h!,f_auto,q_auto:good,fl_progressive:steep/https%3A%2F%2Fsubstack-post-media.s3.amazonaws.com%2Fpublic%2Fimages%2F89a7644f-c26e-4df8-a5f4-f97367387b17_609x573.png "DXP Enterprises [DXPE] RankedStocks valuation factor breakdown showing trailing and forward P/E, PEG, EV/Sales, EV/EBITDA, EV/EBIT, price to book and EV to invested capital against 803 US industrials peers. Source: RankedStocks.com / DXPE valuation sub-scores.")
Outlook 32. The forward revenue line inside the screen sits below 2%. DXPE just grew organic sales 11.1% and total sales 15.6%, and it has beaten the revenue estimate in two thirds of its reported quarters.
![DXP Enterprises [DXPE] RankedStocks growth factor breakdown ranked against 803 US industrials peers, showing trailing and forward revenue, EBITDA, EBIT and EPS growth, long-term EPS growth, ROIC growth and capex growth. Source: RankedStocks.com / DXPE growth sub-scores.](https://substackcdn.com/image/fetch/$s_!_aXa!,f_auto,q_auto:good,fl_progressive:steep/https%3A%2F%2Fsubstack-post-media.s3.amazonaws.com%2Fpublic%2Fimages%2F0032f52d-d0e4-4cb4-913e-9c80433f1872_493x679.png "DXP Enterprises [DXPE] RankedStocks growth factor breakdown ranked against 803 US industrials peers, showing trailing and forward revenue, EBITDA, EBIT and EPS growth, long-term EPS growth, ROIC growth and capex growth. Source: RankedStocks.com / DXPE growth sub-scores.")
Against the peer set, DXPE screens with the highest sentiment score and one of the lowest valuation scores. That is what a stock looks like after it doubles.
![DXP Enterprises [DXPE] compared with its closest RankedStocks industrial peers on RS score, valuation, growth, profitability, sentiment, outlook, forward revenue CAGR, forward EBIT margin and market cap. Source: RankedStocks.com / DXPE peer comparison.](https://substackcdn.com/image/fetch/$s_!cbSf!,f_auto,q_auto:good,fl_progressive:steep/https%3A%2F%2Fsubstack-post-media.s3.amazonaws.com%2Fpublic%2Fimages%2Fa25fc971-31fc-4a77-9394-601b7aa4f262_1272x596.png "DXP Enterprises [DXPE] compared with its closest RankedStocks industrial peers on RS score, valuation, growth, profitability, sentiment, outlook, forward revenue CAGR, forward EBIT margin and market cap. Source: RankedStocks.com / DXPE peer comparison.")
The quarter that broke the ceiling
Revenue grew 15.6% y/y and beat consensus by 6.2%. Diluted EPS beat by 10.7%. The two came from opposite ends of the income statement: volume at the top, operating leverage in the middle.
![DXP Enterprises [DXPE] quarterly revenue actual vs consensus estimate since Q4 2022, showing the latest print of $576.46M against a $543.00M estimate, a 6.2% beat, and a revenue beat rate of 56 out of 84 quarters. Source: RankedStocks.com / DXPE earnings actual vs estimates.](https://substackcdn.com/image/fetch/$s_!vkTx!,f_auto,q_auto:good,fl_progressive:steep/https%3A%2F%2Fsubstack-post-media.s3.amazonaws.com%2Fpublic%2Fimages%2Fb1ec4870-d0b1-42f1-ad4b-e67450526a7f_1319x437.png "DXP Enterprises [DXPE] quarterly revenue actual vs consensus estimate since Q4 2022, showing the latest print of $576.46M against a $543.00M estimate, a 6.2% beat, and a revenue beat rate of 56 out of 84 quarters. Source: RankedStocks.com / DXPE earnings actual vs estimates.")
![DXP Enterprises [DXPE] quarterly EPS actual vs consensus estimate since Q4 2022, showing the latest print of $1.76 against a $1.59 estimate, a 10.7% beat, and an EPS beat rate of 64 out of 84 quarters. Source: RankedStocks.com / DXPE earnings actual vs estimates.](https://substackcdn.com/image/fetch/$s_!by9S!,f_auto,q_auto:good,fl_progressive:steep/https%3A%2F%2Fsubstack-post-media.s3.amazonaws.com%2Fpublic%2Fimages%2F4d115aeb-50a1-4776-ae02-6d1737fe2169_1319x436.png "DXP Enterprises [DXPE] quarterly EPS actual vs consensus estimate since Q4 2022, showing the latest print of $1.76 against a $1.59 estimate, a 10.7% beat, and an EPS beat rate of 64 out of 84 quarters. Source: RankedStocks.com / DXPE earnings actual vs estimates.")
The margin ceiling finally broke. For eight straight quarters DXPE ran adjusted EBITDA margin inside a one-point band around 11%, and I had come to treat 11% as the structural number. Q2 cleared 12% for the first time.
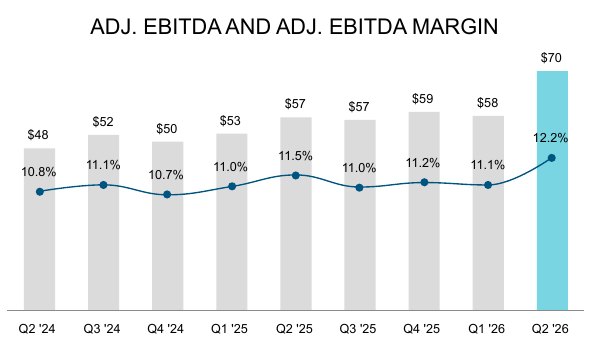
The CFO was careful, saying he would not promise a repeat while adding that the business can get to 12% on a sustainable basis as mix shifts. I believe the second half of that sentence more than the first, because the mix shift causing it is not reversible in any short timeframe.
Diluted EPS also hit a new high.
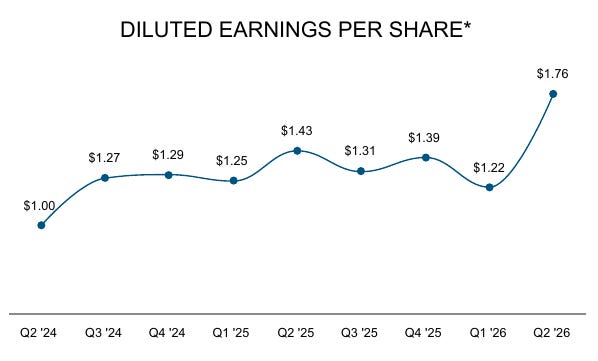
Operating leverage is now measurable rather than promised. SG&A rose in absolute dollars and fell as a share of sales. That combination is the entire bull case for a distributor of this size, and it is what I was waiting on after the Q3 2025 cost spike. Adjusted EBITDA grew 22.8% on 15.6% revenue growth, which the CFO framed as 1.5x operating leverage. Operating income did much the same, growing 20.7%. Two years ago DXPE grew costs faster than sales for three quarters running. It no longer does.
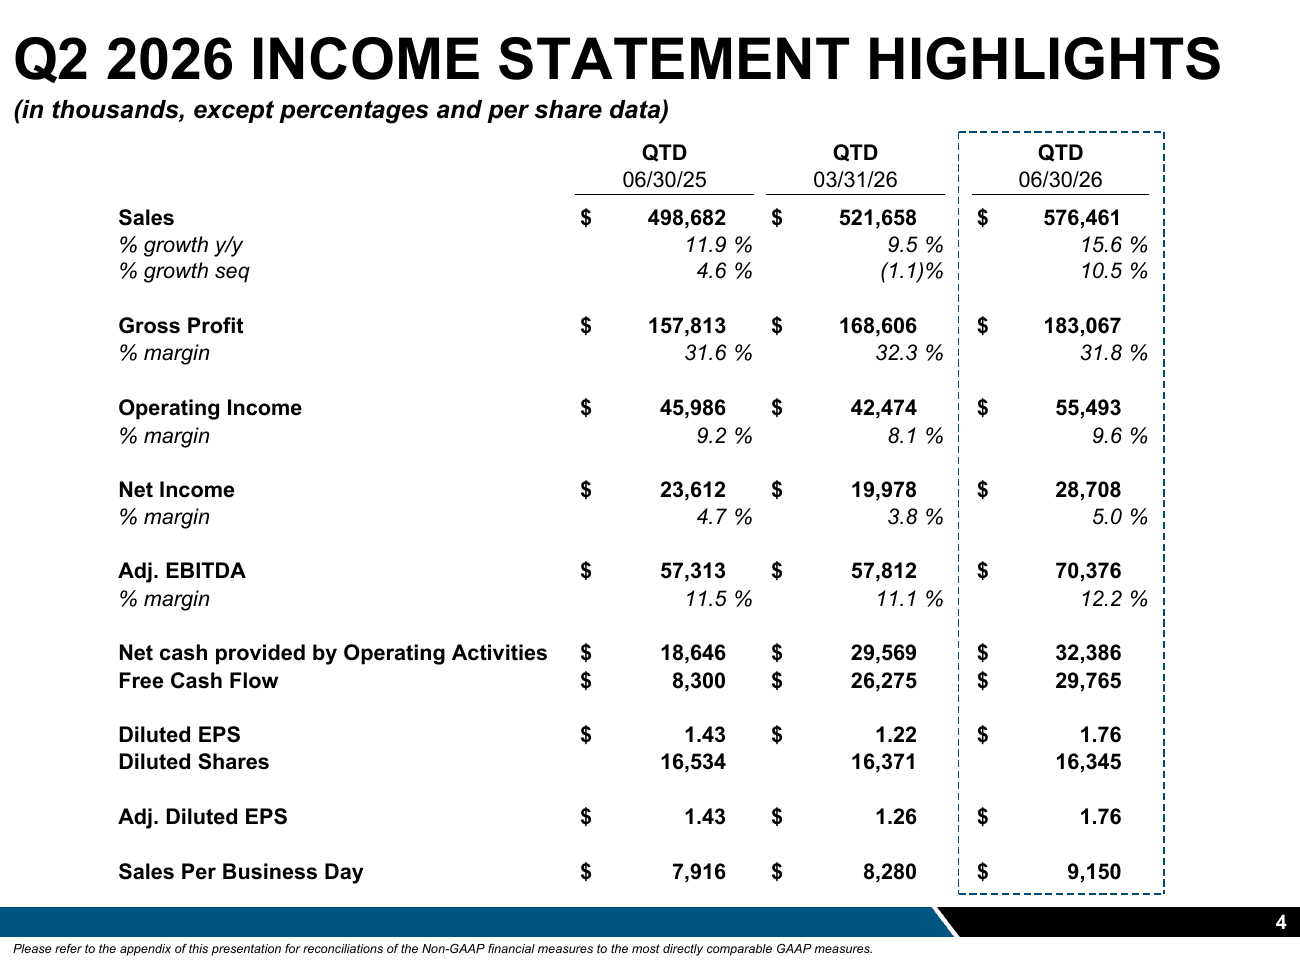
IPS is no longer the small high-margin segment. Its share of segment profit now runs well ahead of its share of revenue, and it carries the highest margin of the three. Service Centers remains the larger business and the steadier one, and it did its job with growth across California, the Gulf Coast, the Southeast, North Texas, South Central and the South Rockies. But the incremental dollar of DXPE profit now comes disproportionately from pumps rather than from parts on a shelf.
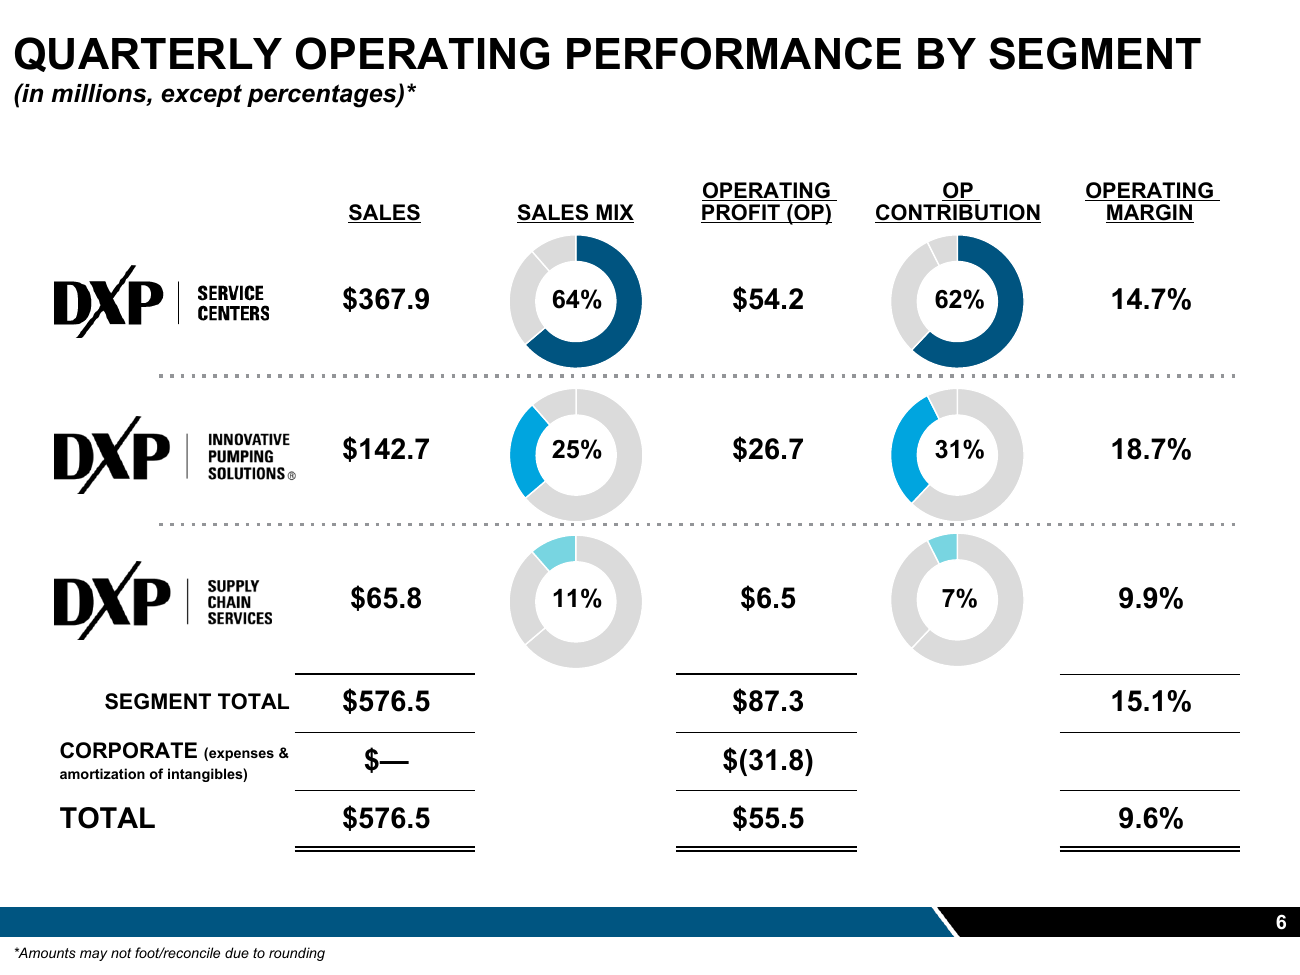
The organic number is the one to watch, and it held up. Acquisitions contributed $49.8M of the revenue. Organic sales still grew 11.1%, and organic sales per business day grew at the same rate. Inside IPS, organic growth ran at 13.3% while the acquired businesses were adding revenue on top. DXPE is buying growth and generating it at the same time.
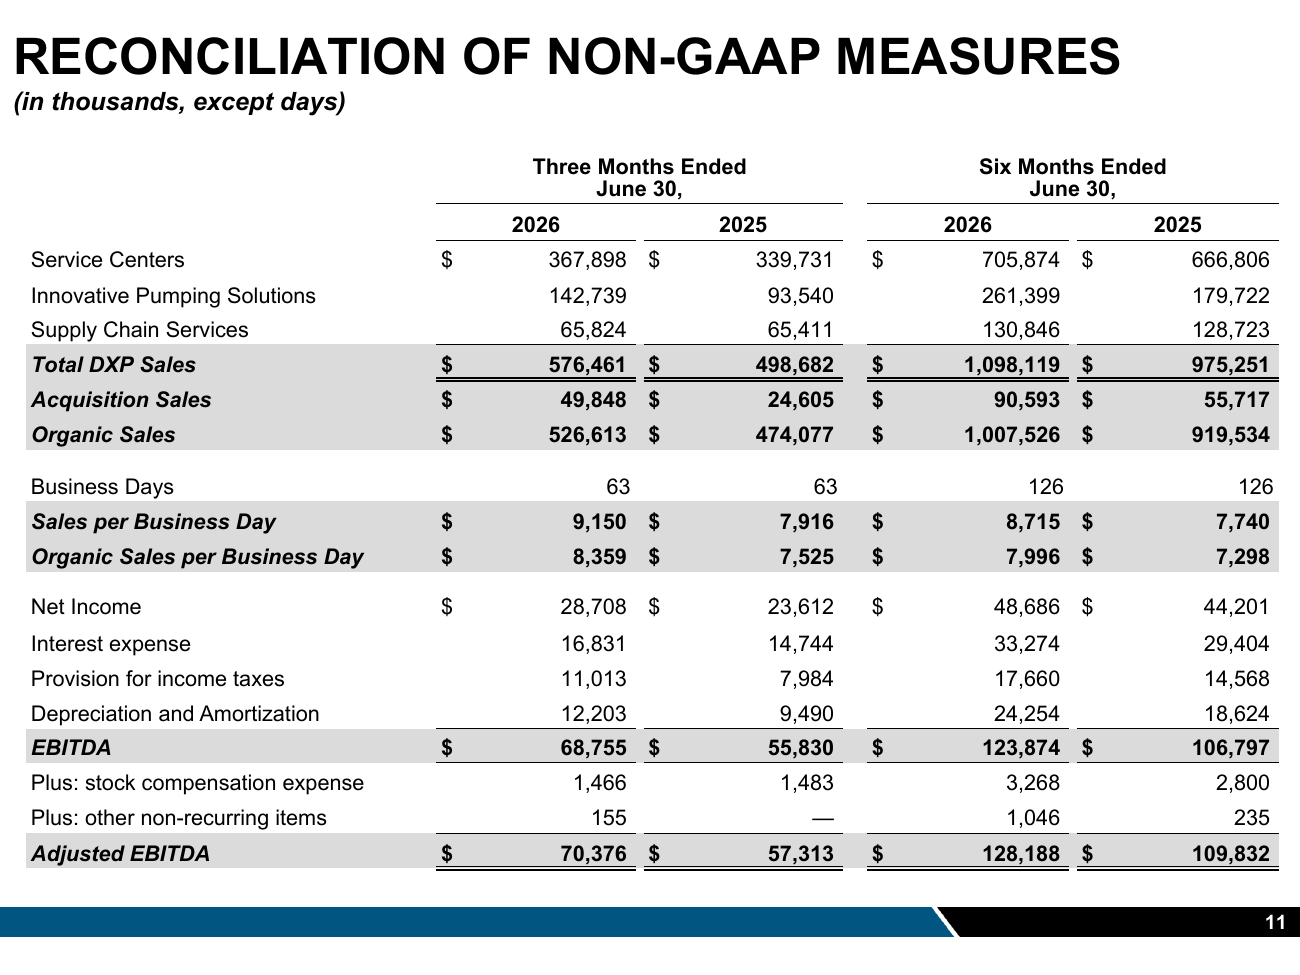
Cash conversion is the quietly transformed part of this business. H1 2026 FCF of $56M compares with negative $8.6M in H1 2025. Over the last four quarters DXPE has produced $118.7M of FCF and averaged $29M a quarter while still growing.
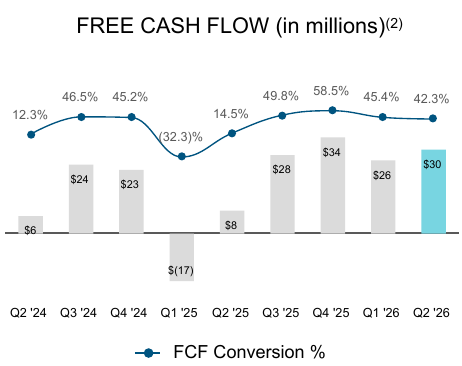
Two things drove it: profitability, and a capex line that fell back to normal after last year’s spending on software, facilities and the tooling DXPE uses to make its own private-label pumps. The CFO said maintenance capex is minimal, and the numbers support him.
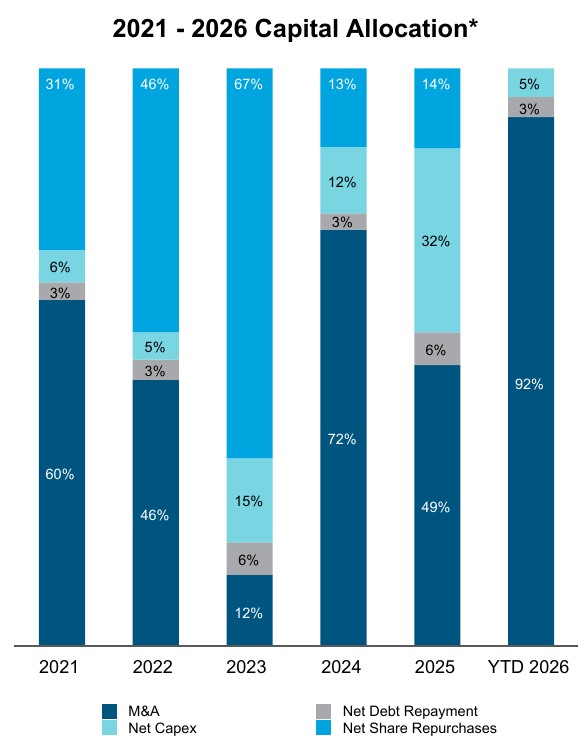
Capital allocation stayed on script. Four acquisitions closed in H1 for $135.6M, three of them in water, and Mequipco closed on August 1 to give DXPE a Western Canada beachhead for the water platform. The ABL was upsized to $225M and extended to July 2031, and S&P lifted the issuer and first-lien ratings to B+ from B with a stable outlook on July 20. Secured leverage fell to 2.3x from 2.6x at the end of Q1, comfortably inside DXPE’s net leverage target.
Thesis scorecard after Q2 2026
Pillar #1. The acquisition engine compounds without straining the balance sheet: Confirmed
Original thesis: DXPE has been buying small, accretive, culturally similar businesses for close to four decades and can keep doing it without a step change in risk.
What happened since last update: Four deals in H1 2026 for $135.6M, and Mequipco on August 1 funded with cash and DXPE stock. Secured leverage fell over the period. The credit rating went up. Total liquidity stands at $374.5M.
Assessment: The engine is running faster than at any point I have covered the company, and it is doing so while the lenders and the rating agency get more comfortable rather than less. The risk in a serial acquirer is that the pace outruns the integration capacity, and I see no evidence of that yet. The number I would want to see break before I worried is organic growth, and organic growth accelerated.
Pillar #2. Water turns DXPE from an oil and gas proxy into an infrastructure business: Confirmed and strengthening
Original thesis: DXPE’s pump expertise transfers to municipal water and wastewater, a market with long-cycle demand driven by regulation and infrastructure spending rather than by the oil price.
What happened since last update: DXP Water booked $97.3M in Q2 and $175.5M in H1, up 85.6% y/y, and posted its fifteenth consecutive quarter of sequential sales growth. Water moved from 66% of IPS sales in Q1 to close to 70% in Q2, up from 46% for full-year 2024.
Assessment: In February 2025 I described water as one of three sector opportunities alongside oil and gas and food and beverage. It is now the primary driver of the company’s fastest-growing and highest-margin segment, and it is the reason the EBITDA ceiling broke.
Pillar #3. Scale converts into operating leverage: Confirmed
Original thesis: As acquisitions scale and SG&A normalizes, DXPE’s operating margin should expand faster than revenue.
What happened since last update: SG&A fell to 22.1% of sales from 22.4%. Adjusted EBITDA grew 22.8% against 15.6% revenue growth. ROIC has recovered from its Q3 2025 trough.
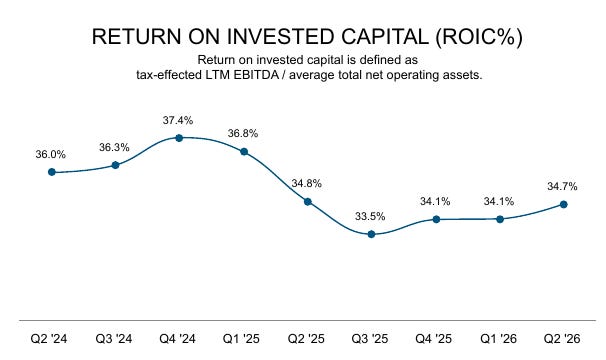
Assessment: In November 2025 I set a condition: if SG&A kept rising faster than sales for more than a couple of quarters, I would revisit the assumptions. It did rise faster in Q1, on seasonal payroll and insurance costs plus a handful of one-off legal, healthcare and fleet items. Q2 reversed it, and the reversal arrived with the best margin in the company’s history. Against that, ROIC is still below its Q4 2024 peak, because DXPE keeps adding invested capital through acquisitions faster than EBITDA.
Pillar #4. Supply Chain Services is a manageable drag rather than a structural break: Evolving
Original thesis: SCS is a small, low-margin, steady contributor whose weakness would not matter much.
What happened since last update: Sales grew 0.6% y/y after 2.7% in Q1, with new customer onboarding offset by lower activity at existing sites. Segment operating income improved on essentially flat sales, lifting the margin close to 10%.
Assessment: The margin improvement is genuine and the segment is growing again, which is progress. But two quarters of sub-3% growth after three years of drift falls short of a turn, and management has now told me for four consecutive updates that new customers will fix it. SCS is the smallest of the three segments on both revenue and profit, so being wrong here costs little. I keep it at Evolving rather than Confirmed, and I still carry 1.0% terminal growth for it.
Pillar #5. The market underpays for DXPE’s earnings power: Challenged
Original thesis: A misclassified oil and gas distributor trading at a discount to what its segments are individually worth.
What happened since last update: The share price has more than doubled from my cost basis and gained 48% between the original thesis and March 2026 alone. Sentiment now scores 95 on RankedStocks and valuation scores 24.
Assessment: This is the pillar that has broken, and it broke because it worked. The misclassification argument I made in February 2025 is gone: Mr. Market has repriced DXPE as an infrastructure compounder rather than an energy distributor, and it has done so with enthusiasm. The gap between price and my fair value is now 17%, against a bear case of similar size.
Valuation: from $210 to $225
I value DXPE the same way I have since the original thesis, by valuing each segment on its own economics and adding them up. Three inputs moved.
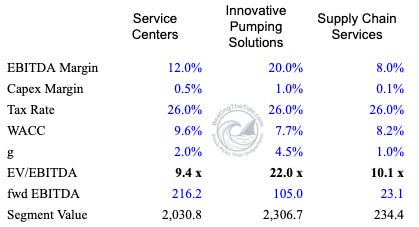
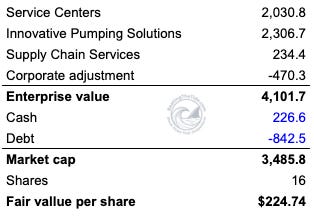
The earnings base went up in every segment. Q2 forced my 2026 forecasts higher across the board. Service Centers goes to 6.5% from 4.5%, which still implies a second half slower than the 8.3% Q2 delivered. IPS goes to 38% from 13.5%, which implies a second half at 32% and deliberately sits below the 45.4% H1 pace, because the comparatives get harder from here. Supply Chain Services goes to 1.5% for 2026 from 1.0%, while its terminal rate stays at 1.0%. On segment operating margins I took Service Centers to 14.6%, IPS to 18.8% and Supply Chain Services to 9.0%, and all three fade back towards today’s levels by the end of the forecast. The IPS figure sits a shade above what the segment earned in Q2, because water keeps taking share inside the segment and water carries the better margin of the two halves. Segment EBITDA for 2026 lands at $344.3M against $317.7M before.
The tax rate went up. The model carried 21%. The effective rate was 25.6% in FY2025 and 26.6% in H1 2026, and the CFO named a higher effective rate as one of the two things holding EPS growth back this quarter. Moving to 26% compresses every segment multiple and costs $18 per share.
Cash and debt are marked to June 30. DXPE put $112.9M of cash into acquisitions over the half against total consideration of $135.6M, with the balance in stock. Net debt rose by $73M across the six months, which is what buying four businesses looks like.
Net of all three, fair value is $225 against $210 in March. That is 17% above the current share price.
What the price already assumes. Run the model backwards. Hold everything else where it sits and ask what terminal growth rate for IPS makes the sum of parts equal today’s share price. The answer is just under 3.5%. My model carries 4.5%. So Mr. Market and I are not arguing about whether water is a good business, whether the acquisitions work, or whether the margins are real. We are arguing about one percentage point on a perpetuity, applied to the segment that carries a quarter of the revenue.
And the edge cuts both ways. Take IPS terminal growth to 4.0%, which is defensible given how much of the water growth was bought rather than grown, and fair value drops to $207. Take it to 3.0% and assume the second half fades back to the old run rate, and I get $159.
Steel-manning the bear case
First, the growth is bought and the price of buying it is rising. DXPE put $135.6M into four businesses in H1, and 92% of the capital it deployed this year went to acquisitions. A roll-up funded at 2.3x leverage, in a market where water assets have become the thing industrial distributors compete for, will eventually pay more for less. DXPE has bought well for a long time. Buying into a crowded market is how good acquirers overpay. The tell would be organic growth slowing while acquisition spend rises, and right now the opposite is happening.
Second, IPS revenue is lumpy in a way the multiple does not reflect. Management has said repeatedly that large engineered projects are being converted into revenue, and that excluding them backlog is up 10% from Q1. Read that in reverse and part of Q2’s record revenue was the drawdown of a backlog built in earlier periods. Long-cycle project businesses do not deliver smooth quarters, and a 22x multiple on IPS assumes something close to smooth. Consensus already has the next quarter’s revenue landing below Q2.
Third, the tariff risk I flagged in February 2025 has still not been tested. DXPE imports pumps, valves and bearings. Management describes tariffs, inflation and interest rates as background volatility rather than a live problem, and gross margin has held up. But a distributor’s defense against input cost inflation is pass-through, and pass-through works until a customer stops accepting it.
Fourth, Supply Chain Services could still be a slow leak. Three years of drift, and a Q2 improvement that came from margin rather than volume. If SCS is structurally shrinking rather than cyclically flat, DXPE loses the steadiest cash contributor it has, and the mix becomes more project-driven at exactly the point the multiple assumes stability.
The overhang I keep coming back to is a valuation one rather than an operational one. The same quarter that proves the business also removes the discount that made it an investment. DXPE has done nothing wrong. The reward for it being right is that the odds are now even.
Verdict
HOLD, fair value $225.
DXPE moves onto my trim list today. It keeps its place in the portfolio and it keeps the HOLD. What changes is where it ranks against everything else I could own. The risk and the reward are the same size now, and the upside that is left has stopped being attractive enough to defend a 4.2% weight against a fresh idea.
The thing I keep turning over is that DXPE has been a better business every single quarter I have owned it, and a worse investment with each one. Those two facts sit together comfortably, because compounding and repricing pull against each other once the discount closes. The hardest positions to manage are the ones that go right, quietly, until one day the only edge left is an argument about a decimal point in a perpetuity.
Portfolio Update
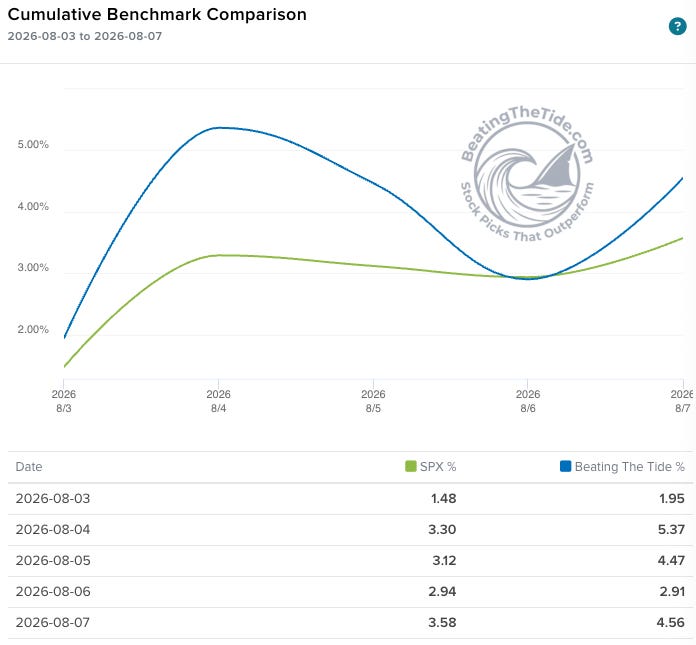
The portfolio beat the S&P 500 by 98bps last week. The gap opened on Tuesday, closed on Thursday when the portfolio briefly gave up the lead, and reopened on Friday.
Portfolio Return
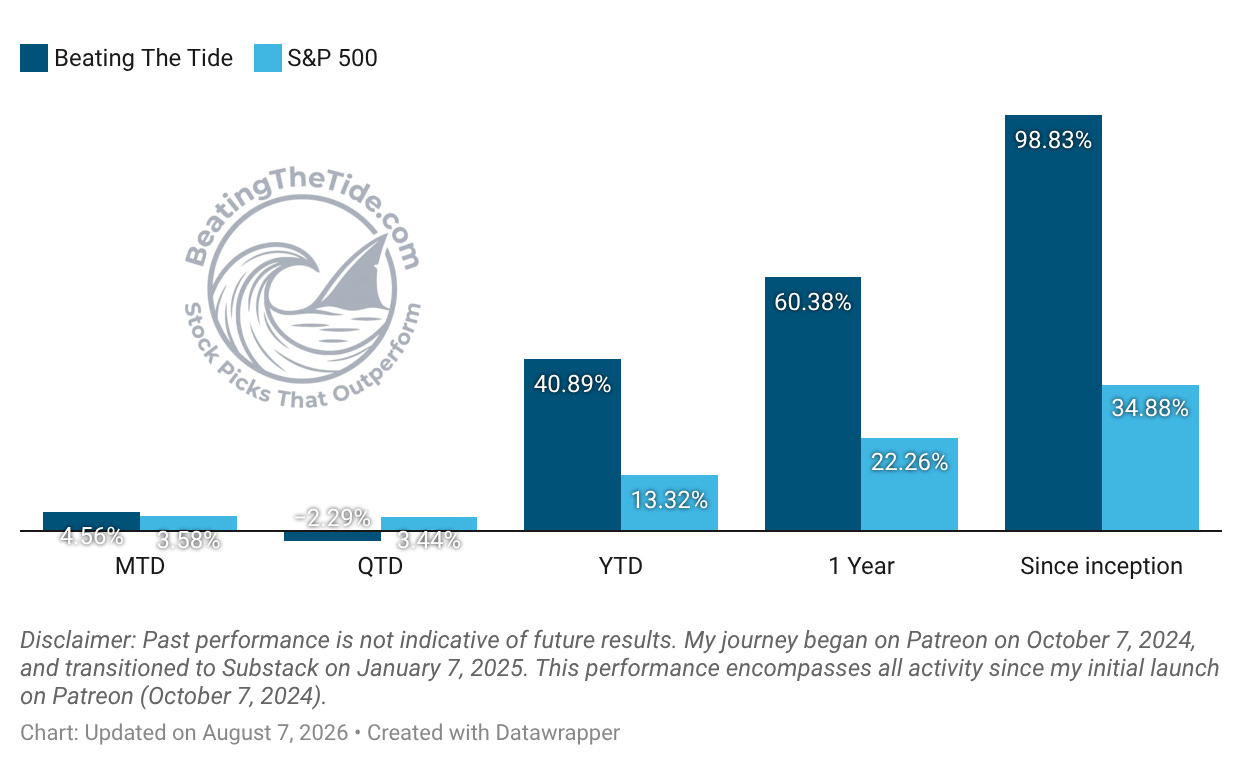
Month-to-date: +4.6% vs. the S&P 500’s +3.6%.
Year-to-date: +40.9% vs. the S&P 500’s +13.3%. That is a gap of 2,757 basis points.
Since inception: +98.8% vs. the S&P 500’s +34.9%. That’s 2.8x the market.
Contribution by Sector
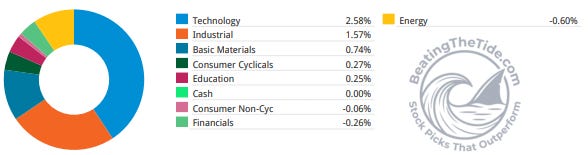
Technology and industrials produced nearly all of the week’s gain, with basic materials adding the rest. Energy was the only meaningful drag, and financials the only other sector in the red.
Contribution by Position
How to read the heat map? Click here.
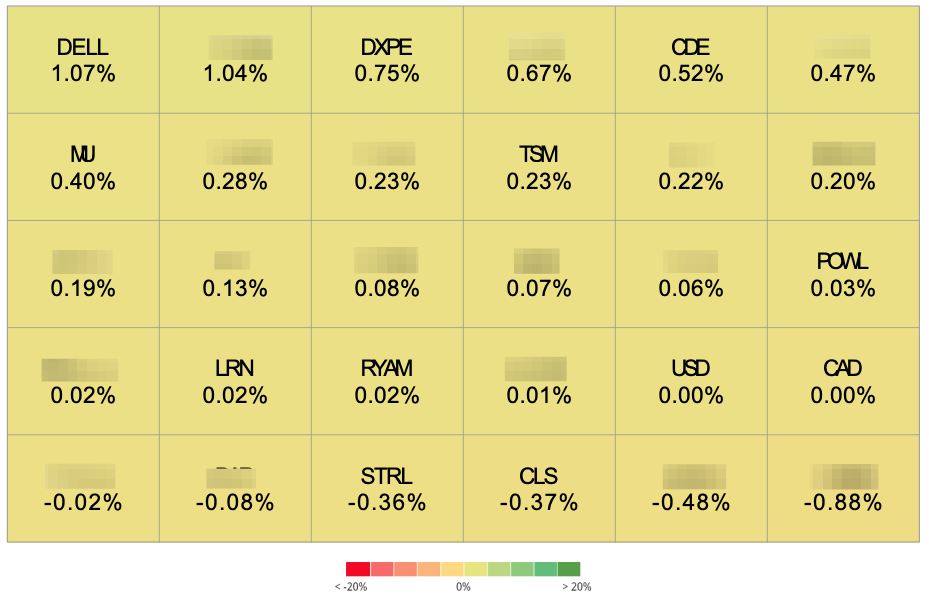
+107 bps DELL 3.90%↑ (Thesis)
+75 bps DXPE 2.42%↑ (Thesis)
+52 bps CDE 0.74%↑ (Thesis)
+23 bps TSM 1.99%↑ (Thesis)
+3 bps POWL 1.10%↑ (Thesis)
+2 bps LRN 0.14%↑ (Thesis)
+2 bps RYAM -3.71%↓ (Thesis)
-36 bps STRL 4.60%↑ (Thesis)
-37 bps CLS 3.09%↑ (TSX: CLS) (Thesis)
That’s it for this week.
Stay calm. Stay focused. And remember to stay sharp, fellow Sharks!
Very principled approach at capital preservation. you usually trim by 50% when a position doubles? Essentially gambling with house money afterwards?
Hi George thanks for the great write up! I saw you mentioned “92% of the capital it deployed this year went to acquisitions” and I was wondering if you think there are specific return thresholds or post-acquisition metrics investors should watch to determine whether DXPE is still creating value through these deals, particularly as competition for water assets increases?