

STRL Q1 2026 Update: Tsunami Confirmed, Asymmetry Spent
Sterling Infrastructure’s second beat-and-raise pushes my DCF to $1,010. Bear at $700. R/R 1 to 1.05 at +1,010% gain.


Since I added STRL to the portfolio at $76.68, the position has compounded to $851.35 today, a return of +1,010% at an 8.9% portfolio weight.

It is the position that anchored Weekly #81’s discussion of when not to sell a winner.

We are now three price targets and two earnings prints into my coverage, starting with the original deep dive in December 2025 at a $455 target.

This update walks through the Q1 2026 print, my new $1,010 DCF, and the uncomfortable fact that even with the model lifted twice, it now reads HOLD: the upside has compressed to +19% against a bear case at $700, with the model’s own R/R essentially symmetric at 1 to 1.0.
Table of Contents
TLDR
Q1 2026 was a record print: revenue $825.7M (+92% y/y), GAAP EPS $3.09 (+141%), adjusted EBITDA $166.6M (+107%), all of it well above consensus.
Total visibility pool stepped up to roughly $6.5B, a $2B jump from year-end 2025, driven by $1.2B of CEC awards plus a new semiconductor fabrication campus initial-phase win.
Of my five original thesis pillars, four are confirmed and strengthening, one (valuation) is evolving as the stock has run faster than the operating story.
Updated DCF target: $1,010 (was $600 at the Q4 2025 update). Upside to target from $851.35 is +18.6%; bear case raised to $700 (was $330). Dollar risk/reward is essentially symmetric (1 to 1.05), the model now reads HOLD, not BUY.
Conviction in the business is unchanged.
How Does STRL Rank?
The Ranked Stocks composite sits at 79/100 for STRL, placing it in the 80th percentile in the United States and the 80th percentile in its sector. That headline number reads top quintile, but it is the spread between the factor scores that tells the story.

Sentiment 99 and Outlook 100 are essentially as high as the framework prints. Analyst revisions are still rising into the Q1 beat, the Street is materially behind management’s raised guide, and the forward-looking narrative on hyperscaler capex is firmly tailwind. These two factors carry the composite.
Growth 78 lands where the operating story would lead: Q1 revenue +92% y/y, FY26 guide implying +51%, and the multi-year backlog ramp gives STRL one of the strongest growth profiles in industrials.
Valuation 4 and Profitability 9 are both red flags. Valuation 4 reflects the trailing P/E of 76x and EV/EBITDA of 45x, which are by any standard expensive. Profitability 9 is the noisier signal: STRL’s ROIC ran 25.9% in 2025 and I forecast to expand into the low-30s in 2026 as the asset base scales, so a 9 score does not match the operating reality.

The most likely explanation is the CEC acquisition’s intangible amortization ($22M in 2025, forecast to grow with the deal’s earn-out periods), dragging GAAP margins below where the cash economics sit. The factor reads on accounting profitability, not economic profitability, and on that basis the score is misleading.
The combination of Valuation 4 and Profitability 9 is what the model’s HOLD output is also telling you: the business is excellent on growth, sentiment, and outlook, but the entry multiple at $851 leaves little room.
Thesis scorecard after Q1 2026
Pillar #1. AI and hyperscaler capex supercycle: Confirmed and strengthening
Original thesis: STRL is the picks-and-shovels play on a multi-year hyperscaler buildout, with McKinsey and BCG framing $1.8T to $6.7T of data center capex globally through 2030.
Evolution: At Q4 2025 the case got stronger as top-5 hyperscaler 2026 capex was framed at $602B (+40% y/y), of which roughly 75% is AI-related (per the Q4 2025 earnings call).
What happened since last update: The Q1 print confirmed the demand picture has not slowed. Mission-critical projects (data centres, manufacturing, semiconductor) now represent over 90% of E-Infrastructure backlog at quarter end, up from 84% at year-end 2025 (per the Q1 2026 press release). STRL also disclosed an initial-phase award on a “large, multi-year semiconductor fabrication campus,” opening a new end-market that runs parallel to data centres rather than substituting for them.
Assessment: The shift toward +90% mission-critical work means STRL is winning the longest-duration, highest-quality contracts in the pipeline, not the leftover scraps. The semiconductor win matters because it diversifies STRL’s secular demand vector beyond hyperscalers, addressing one of my original concentration concerns at the margin. Pillar stronger than at Q4.
. RHB backlog (grey) was deconsolidated at year-end 2024, so figures from Q4 2024 forward are not directly comparable to prior periods. Source: Q1 2026 investor presentation, Backlog slide.")
Pillar #2. Mix shift to E-Infrastructure: Confirmed and accelerating
Original thesis: Selling the low-margin highway business and reinvesting into E-Infrastructure compounds consolidated margins because E-Infra carries roughly 2x the EBITDA margin of Transportation.
Evolution: At Q4 2025, E-Infra ended the year at 47% of FY revenue, up from 35% the year before, with Q4 alone hitting 69%.
What happened since last update: In Q1 2026, E-Infra was 72% of revenue, up from 51% in the prior-year quarter, with segment revenue +174% y/y. Stripping out CEC, the legacy E-Infra business grew +102% organically, and CEC standalone grew +78% versus the pre-acquisition Q1. E-Infra adjusted operating margin held at 23.5%, slightly above last year’s 23.2%, even as the segment more than doubled.
Assessment: Two things matter here. First, the mix is moving faster than I had pencilled in, my last update. It now has E-Infra reaching 89% of revenue by 2035, vs the original deep dive’s path that took longer to get there.

Second, margins held flat while doubling, that is the textbook signature of a business where unit economics are durable and scaling does not destroy them.

Pillar stronger than at Q4.
Pillar #3. CEC cross-sell unlocks the integrated bid: Confirmed
Original thesis: Buying CEC Facilities Group in 2025 lets STRL bid site development and mission-critical electrical as one integrated package, displacing two separate subcontractor bids and moving STRL “up the value chain.”
Evolution: The Q4 update flagged early integration but had limited disclosure on actual cross-sell wins.
What happened since last update: The Q1 call disclosed STRL is now “in active construction on two data center campuses where we are delivering site and electrical services in an integrated capacity” (per the Q1 2026 earnings call). CEC alone added $1.2B to combined backlog in the quarter, about 60% of the total backlog step-up from year-end. CEC standalone revenue grew +78% y/y versus the pre-acquisition Q1.
Assessment: The cross-sell theory has moved from slide-deck logic to two active projects. The fact that CEC is generating $1.2B of incremental backlog while STRL is integrating it is the strongest evidence yet that the acquisition is delivering the strategic value, not just the financial accretion. Pillar confirmed; I’m watching for the next datapoint, what percent of new E-Infra wins are integrated vs single-service.
Pillar #4. Backlog visibility deepens and diversifies: Confirmed and strengthening
Original thesis: STRL’s backlog gives multi-year revenue visibility that materially de-risks the forward model, with combined backlog (signed plus unsigned) growing faster than burn.
Evolution: Q4 2025 backlog was $3.01B (+78% y/y), combined backlog $3.31B (+81%), with a total visibility pool of $4.5B.
What happened since last update: Q1 signed backlog $3.80B (+78% y/y), combined backlog $5.15B (+131% y/y), and the future-phase pipeline now exceeds $1.3B. Total pool: roughly $6.5B, a $2B step-up from year-end 2025. Book-to-burn was 2.1x for signed backlog and 3.5x for combined, best quarter on record on the order intake side. The semiconductor fab win adds a new end-market.
Assessment: A 2x burn ratio on signed backlog and 3.5x on combined means STRL is filling 2026 capacity faster than it is consuming it, even at 92% revenue growth. The diversification into semis is the cleanest tell that the model’s outer-year revenue path is not single-customer or single-end-market dependent.
Pillar stronger than at Q4.
Pillar #5. Underpriced compounder: Evolving
Original thesis: The original deep dive ran the DCF to $455 against a market price near $334. The thesis was that mix shift plus backlog growth would re-rate the multiple as the market caught on.
Evolution: $455 was crossed in February 2026. At Q4 2025 I lifted to $600. Stock crossed $600 in late March. Through Q1, the model output stepped to $1,010 against a current price of $851.
What happened since last update: Two things moved the target. First, the outer-year revenue path in the model lifted as I extended the E-Infra growth runway, 80% in 2026, 35% in 2027, 30% in 2028, before tapering, which pushed 2030 revenue to roughly $8.2B. Second, the WACC dropped to 6.90% (unlevered beta 1.12 for the construction sector, long-term debt rate 4.50%, optimal debt-to-capital 45%, up from 40%), reflecting STRL’s deeper net-cash position that supports more debt capacity in the optimal capital structure.
Assessment: Conviction in the business is unchanged. Conviction in the position has spent its asymmetry: at $425, the implied upside to the prior $600 target was +41% with a bear at $330 so the R:R was 1 to 1.8; at $851 today against $1,010, it is +18.6% upside with a bear at $700, so downside of -17.8%. R:R is essentially symmetric at 1 to 1.05. The recommendation is HOLD, not BUY.
Pillar evolving, same business, the margin of safety is gone.
The Q1 2026 print
Revenue of $825.7M came in +92% y/y, a $216M beat versus consensus of $609.7M (+35.4% surprise). GAAP diluted EPS of $3.09 was +141% y/y and beat by $0.81. Adjusted diluted EPS of $3.59 was +120% y/y. Both lines crushed the Street.
, EPS GAAP Actual $3.09 (Beat by $1.32), Revenue Actual $825.68M, and Revenue Surprise Beat by $233.70M. Source: seekingalpha.com/symbol/STRL/earnings.")
Adjusted EBITDA of $166.6M was +107% y/y at a 20.2% margin, slightly below FY25’s 20.1% on a like-for-like basis but well above the consolidated trajectory implied by the model. Operating cash flow was $165.6M for the quarter, STRL converted close to 100% of EBITDA to cash, which is rare for a construction services business and a function of the contract liabilities build ($695.6M of contract liabilities at quarter-end). The cash balance grew to $511.9M from $390.7M at year-end, a $121M build in 90 days, while debt sat flat at $287.5M (net cash $224M).
Segment performance was the story of the print. E-Infra revenue $597.7M (+174% y/y, 72% of total) with adjusted operating margin 23.5%; Transportation revenue $132.9M (+10%, 16% of total) with adjusted operating margin 12.9%, up 160 bps; Building revenue $95.1M (+3%, 12% of total) with adjusted operating margin 8.7%, down 680 bps from 15.5%. The Building margin collapse is the one negative datapoint and confirms the affordability-driven softness management flagged at Q4.
, Transportation Solutions (revenue +10% to $132.9M, op income +31% to $14.8M, adj op income +26% to $17.1M), and Building Solutions (revenue +3% to $95.1M, op income -50% to $6.2M, adj op income -42% to $8.3M). Source: Q1 2026 presentation, First Quarter 2026 Segment Results slide.")
Backlog was the second story. Combined backlog stepped from $5.15B (+131% y/y), with $1.88B contributed by CEC. Stripping CEC out, organic combined backlog still grew +46% y/y, which on a base that was already up sharply at year-end is uncommon. Future-phase work crossed $1.3B for the first time. Book-to-burn was 2.1x signed / 3.5x combined.
Buybacks were modest in the quarter at $12.3M (40,400 shares at an average price of $305.14), but I would note that the average buyback price for Q1 is now far below the May 12 close of $851.35, STRL repurchased shares at roughly 36% of today’s price during the quarter.
Guidance comparison: the second beat-and-raise in a row
.")
E-Infrastructure segment guidance was lifted in tone if not in a specific dollar number: the team now expects E-Infra to grow “80% or higher” including CEC’s full-year contribution, with legacy site-development “approaching 60% or higher”, both up from the high-50s/60s range implied at Q4. Adjusted operating margins for E-Infra are guided in the “mid-20% range,” consistent with Q1’s 23.5% print.
Management credibility check: Both of the last two prints have been blowouts, Q4 beat consensus on revenue by $54M and EPS by $0.63, and Q1 just beat by $216M on revenue and $1.31 on adjusted EPS. The team has guided conservatively two quarters in a row and beaten by a wide margin on operations driven by hyperscaler intake. I would treat the new $3.70B-$3.80B revenue range as a floor, not a ceiling. The next plausible raise comes at Q2 (early August), and given the $5.15B combined backlog already in hand, a $4B+ revenue run rate is the realistic ceiling for the year.
Valuation update: from $600 to $1,010
The model target moved from $600 at Q4 to $1,010 through Q1. Three assumption changes did the work.
 and other $100M (investment in unconsolidated sub), less debt $350M and minority interest $2M, bridging to market cap $30,944M and fair share price $1,009.90. Source: STRL v25 Story tab, DCF Valuation section.")
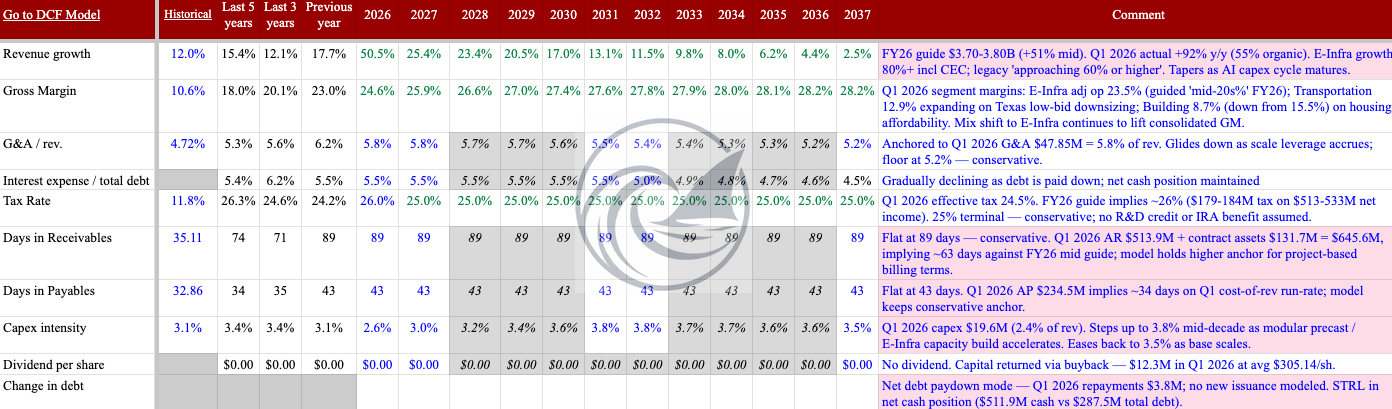
First, the outer-year revenue path was lifted. Q1’s mission-critical backlog of +90% and the $1.3B future-phase pipeline supports a higher trajectory than the Q4 model carried. The model now has 2026 revenue at $3.75B (in line with the raised guide midpoint), growing to $4.70B in 2027, $5.80B in 2028, and reaching $10.32B by 2032. E-Infra alone grows from $1.47B in FY25 to $11.6B by 2035, a path that requires the AI capex cycle to continue at scale, but the Q1 data does not contradict it.
Second, the EBITDA margin path was steepened. The consolidated EBITDA margin runs from 18.8% in 2026 to 22.4% by 2032 in the model, anchored by E-Infra segment EBITDA holding at 28.5% as it scales to ~89% of consolidated revenue by 2035. Q1’s 23.5% E-Infra adjusted operating margin (which corresponds to ~28-29% segment EBITDA after D&A add-back) supports that anchor. Implied 2026 EBITDA of $705M sits in the upper half of the $843M-$873M adjusted EBITDA guide range, and 2032 EBITDA reaches $2,042M.
Third, the cash bridge is richer. Net cash at Q1 quarter-end is $224M, plus a $121M investment in the unconsolidated RHB subsidiary that the model now picks up explicitly in the EV-to-equity bridge. Year-end 2025 cash of $390.7M flows to $511.9M at Q1, and the Q1 OCF of $165.6M implies the cash build accelerates through the year, the model’s discounted FCF stack reflects this.
Fourth, the WACC dropped from 7.20% to 6.90%. The optimal debt-to-capital lifted from 40% to 45% (with the long-term debt rate held at 4.50%, the unlevered beta held at 1.12), reflecting STRL’s net cash position of $224M giving the balance sheet room to carry more debt before the marginal cost of debt steps up. A 30 bp WACC compression adds roughly $90/share to the target on its own.
Bear case $700. The new bear at $700 is a multiple-compression case: 2026 and 2027 land roughly in line with the current model, but the market re-rates STRL to 14x EV/EBITDA on a 2027 base (versus the implicit 20x in the $1,010 target). The bear does not require a hyperscaler capex pullback; it only requires the market to pay 14-15x for 2027 EBITDA rather than 20x.
Risk register: what is live, what faded, what is new
Customer concentration (Original / Unchanged). The Dec 2025 deep dive flagged that four customers represented 35% of E-Infra revenue in 2022. STRL has not disclosed updated concentration figures in either the Q4 or Q1 prints; with CEC layered in and the customer base of mission-critical electrical now bolted on, the concentration may be lower, but I have no data to confirm. Still a live risk.
Project execution (Original / Faded). Q1 delivered clean execution across two integrated data-center campuses plus the broader portfolio. Operating margins expanded in Transportation, held in E-Infra, and the cash conversion ratio of close to 100% says the team is running the operations cleanly. Risk faded.
Macro/rates on Building (Original / Materialized). Building adjusted operating margin collapsed to 8.7% in Q1 from 15.5% in Q1 2025. Revenue was up 3% but profit fell 42%. Management explicitly flagged “affordability constraints” and said conditions “will remain challenging through 2026.” This risk has shown up in the numbers. The good news: Building is now only 12% of revenue and falling toward 8% in the model by 2030, so the segment’s drag on consolidated EBITDA is fading even as its margin compresses.
Hyperscaler capex pullback (Q4 added / Unchanged). The bear case still hinges on whether top-5 hyperscaler capex breaks downward in 2027 or 2028. Q1 data did not provide a catalyst, capex commentary from Microsoft, Meta, Google, Amazon at their April-May 2026 prints all held or raised. Still a live risk for outer years.
AI capex digestion (New). The market is increasingly debating whether 2025-2026 hyperscaler builds will be matched by AI revenue and usage in 2027-2028. If hyperscalers slow growth in 2027 to digest, STRL’s outer-year backlog flow could compress. STRL has insulation here via the semiconductor fab work and the geographic build-out.
Valuation/multiple compression (New, central). STRL trades at 76x trailing P/E and 45x EV/EBITDA, well above where the market was paying at the Q4 update.

Performance vs peers since the Dec 2025 deep dive

STRL is up +165% since the original deep dive in early December 2025, outpacing every comparable name in the construction services peer set. MTZ ran +98% in the same window on the same hyperscaler infrastructure theme, AGX +87% on the data-center-power adjacency, URI +19% reflecting broader equipment rental cyclicality, and PRIM -8% as project margin compression weighed on the name. The spread tells you the market has priced STRL as the cleanest E-Infrastructure exposure in the group, and it has. From here, the call is on operating execution, not relative re-rating.
Verdict
Conviction in the business is unchanged, Q1 confirmed every pillar I underwrote in the original deep dive and strengthened most. Conviction in the price is HOLD: target $1,010, bear $700.
Similar to POWL, I am holding here but STRL is a candidate for trimming (after POWL) if I need the capital for a new position).