Weekly #24: When the VIX Hits 45: What Actually Happens Next
Forget the safe asset myths. I dug into the data—see what really performs when volatility spikes, and why gold isn’t the answer.
Happy Sunday, my fellow Sharks!
Thank you to all who answered the short survey in Weekly #23. I will be making some changes to make the newsletter more valuable to you while keeping my initial mission. One of the most common pieces of feedback is that 82% of you found the ‘Thought of the Week’ very valuable. So, I will start the section at the top of the Weekly while moving the portfolio performance to the bottom.
As I’ve preached in several Weeklies, now’s not the time to panic-sell everything—historically, markets bounce back, and trying to time them perfectly is usually a losing game. I am not going to explain why; if you need a recap, here is some literature from the previous Weeklies:
With that out of the way, let’s start!
Thought of the Week - A Tariff Tsunami Just Hit. Now What?
Alright, let's break down what went down this week in the stock market.
Spoiler alert: It wasn't pretty.
Imagine your buddy deciding to suddenly hike up the rent by 25% overnight because your roommate buys your cheap beer but you don’t buy his tampons—because, well, you're a guy and don't need them. That’s basically the vibe President Trump threw down with his "Liberation Day" tariffs.
In case you missed it, Trump announced aggressive tariffs—a baseline of 10% on all imports from countries where the US has a trade surplus, escalating sharply for countries with a trade deficit with the US, like China, which got slapped with a staggering 34% tariff.
What Trump calls a tariff is basically the trade gap with a country, divided by how much the US imports from it—then cut in half. Take China. The US buys way more stuff from China than it sells to them, creating a $295 billion gap. We bring in about $440 billion worth of goods from China. Divide 295 by 440, and you get 67%. Cut that in half and round up, and you land at 34%—that’s the tariff the US charges. Now that I think about it, I am glad Trump became a failed businessman rather than a doctor. Can you imagine?
If you want to watch the circus show, here it is, enjoy!
Naturally, China didn’t sit quietly—it threw an equally heavy 34% tariff back at the US, matching Trump’s rate exactly. Tit-for-tat, right?
Wall Street reacted exactly how you’d expect—panic selling and a whole lot of red on trading screens. The Nasdaq nosedived about 10%, marking its worst performance since 2022, and the S&P 500 joined the pity party by sinking 9.1% this week alone.
In total, we’re looking at roughly a $3 trillion wipeout—yes, trillion with a “T”—across the S&P 500’s market cap. 🤔
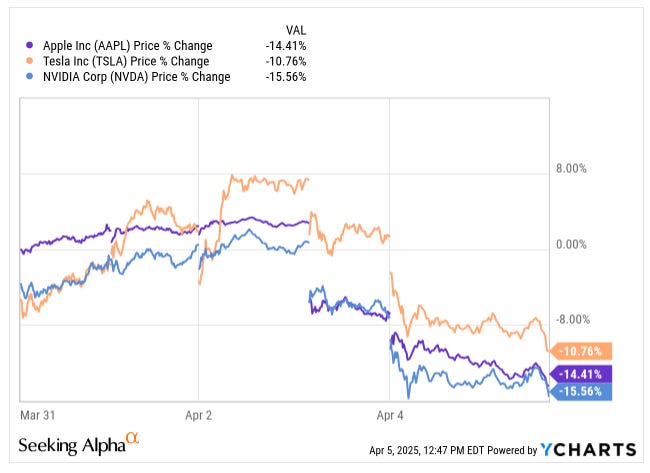
Tech giants like Apple ( AAPL 0.00%↑ ), Tesla ( TSLA 0.00%↑ ), and Nvidia ( NVDA 0.00%↑ ) didn't stand a chance and got hammered.
But wait, there’s more drama. Canada’s response was pretty much expected. While we avoided the baseline tariffs, Prime Minister Mark Carney hit back with 25% tariffs on American vehicles, slapping nearly $95 billion worth of duties overall. Stellantis promptly shut down its Windsor plant for two weeks, leaving about 3,200 workers wondering whether their jobs would still exist afterward.
Even Jerome Powell, usually the cool-headed Fed guy, couldn't keep a straight face this time. He warned that tariffs would boost inflation more than initially thought and hinted the Fed might need to step in sooner rather than later if things get uglier.
Meanwhile, oil prices tanked too—hitting their lowest levels since 2021 and dropping below $63 per barrel.

That’s good news if you're filling your car—but terrible news if you're invested in energy stocks.
Quick poll:
Volatility is back in a big way
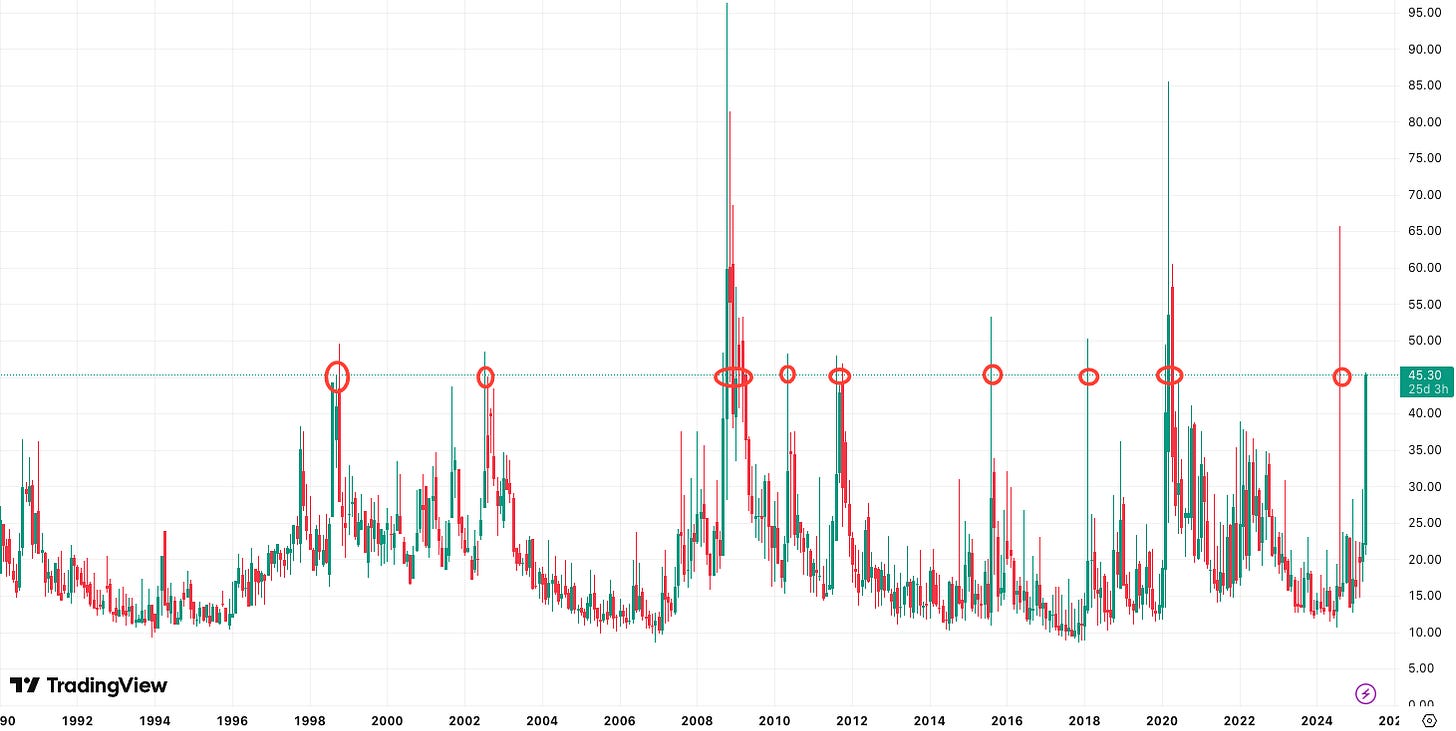
Volatility hit 45 as of Friday. Since the ‘90s, the VIX has crossed 45 only nine times. The common myth in moments like this is that you should flee to safer assets—bonds, gold, consumer staples, utilities. Let’s review what actually happened the last times the VIX crossed 45.
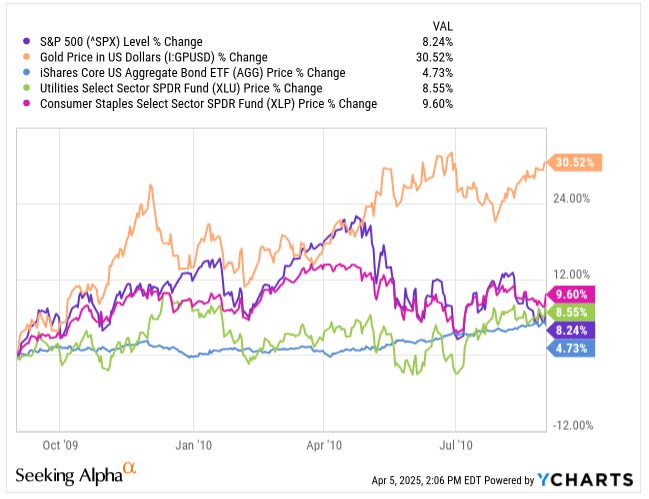
October 2009 could be the poster child for that myth—except bonds, which still outperformed stocks.
When COVID hit and the VIX crossed 45, the myth got busted—stocks far outpaced all the so-called “safe” assets.
So what is right?
I pulled together a table showing how each asset performed one year after the VIX crossed 45 (excluding August 2024, since it hasn’t been a year yet). The findings might surprise you.
And here’s something I didn’t expect—but loved seeing:
In most cases, when the VIX spikes past 45, the following weeks and months tend to have positive returns. Not years—weeks.
It’s like the market throws a tantrum, screams into a pillow, and then slowly walks back into the room like, “My bad, I overreacted.”
Of course, that doesn’t mean every bounce is smooth or immediate, but it does mean that panic selling right after a volatility spike is historically a terrible move. Markets tend to bounce back faster than people do.
Bonds had the worst 1-year performance of all the assets. While the downside was minimal, returns barely covered inflation—so you’re just preserving purchasing power, not really investing.
Defensible sectors like utilities and consumer staples not only lagged the S&P 500—they also had a lower chance of posting a positive return.
As for gold, it held to the myth—it was the most likely asset to post a positive return a year later. Returns were higher, and the worst-case was just -1.7%.
So clearly, the conclusion is: let’s put everything in gold, right?
Wrong.
Sure, we should have some gold—and maybe even more now—but we still need to stay invested in riskier assets. The S&P 500 only had negative returns in two of those years.
Why?
Because over the long haul, stocks beat gold. Every time.
Also, stock picking can help you beat the index—if you know what you’re doing.
This coming week, I’ll be sharing a new position for our portfolio that offers short-term protection and solid long-term upside—so stay tuned. So if you’re not a paid subscriber—or have been on the fence—now’s the time to join. Stock picking matters more than ever right now if you want to take advantage of this downturn.
Don’t be on the fence.
Beating the Tide delivers stock picks backed by deep fundamental research that have outperformed the S&P 500 since 2012. The subscription is less than one bad trade and way more likely to pay off.
Portfolio Update
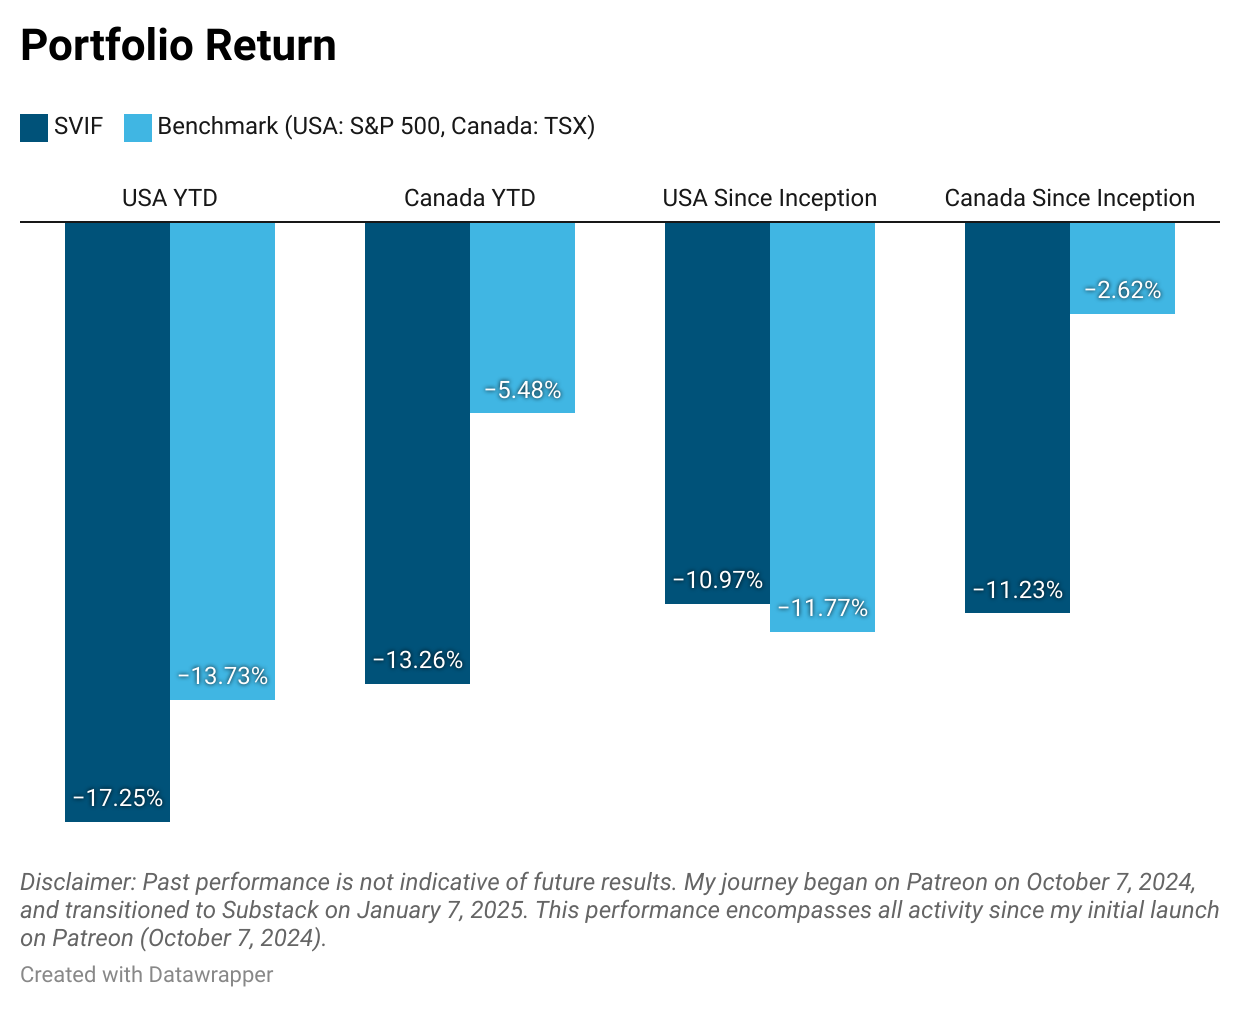
This week, our portfolios kept sliding with the broader market. Portfolio USA’s performance versus the S&P 500 widened from -257 bps to -352 bps YTD. Portfolio Canada lagged a bit more too, with the gap increasing from -770 bps to -778 bps YTD.
Technology and financials were the worst-performing sectors in both portfolios.
Contribution by Sector - Portfolio USA
Contribution by Sector - Portfolio Canada
Here is the weekly performance of each stock in our portfolios: Weekly Stock Performance Tracker


