


Update:
Sep6’26: Q2 2027 Earnings & Revised target price ($639 → $601)
Jun7’26: Q1 2027 Earnings & Revised target price ($486 → $639)
May24’26: Revised target price (from $206 → $486)

A few years ago, I bought DAQO Energy [DQ]. Polysilicon, DQ’s output, as every commodity lives in the land of supply and demand. Even though the company was not a tech company and it simply relied on mining a commodity, it turned out to be my best investment, multiplying my capital by 17x in a couple of years.

That investment taught me a simple rule that still guides me: when the product starts to look like a commodity, the best operator wins.
In commodity-like industries, the edge rarely comes from a secret product. It comes from boring things done at a high level: buying well, building well, shipping on time, managing inventory like it is cash, and squeezing waste out of a messy system.
That operator lens shapes how I look at companies with no apparent “moat”. The February Stock Pick falls into this category. It is in a part of the supply chain that has no bargaining power. However, this company has been able to have +20% ROIC lately.
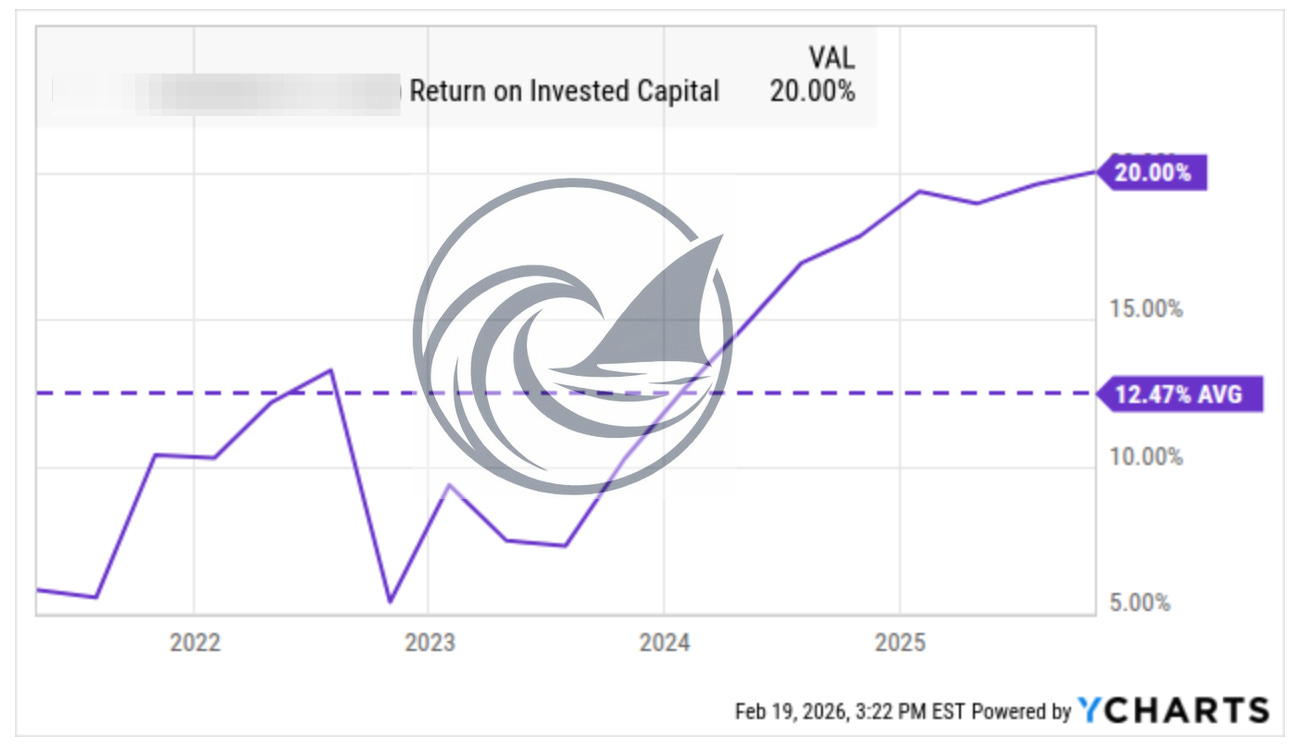
The company is already +20% since I sent the trade alert on February 23rd.
Paid member? Click here to access the stock picks.
Note: I wrote this deep dive before its latest earnings release, so the figures and valuation do not include the new results. I’ll publish a full earnings breakdown on Sunday. The key point is that Dell’s FY2027 guidance came in stronger than what I assumed in my model, which suggests my $206 per share fair value is likely conservative.
TLDR
One of the most common mistakes I see people make is evaluating the hardware industry through a single lens (revenue growth, or multiple, or market share). That is a recipe for missing the plot. I have watched this industry reinvent itself every few years while keeping the same underlying physics: hardware gets commoditized, distribution wins cycles, and services make the economics durable.
What actually matters is the operating architecture: how each company makes money, what portion of that money they keep, how capital-efficient the model is, and whether the strategy is built for the world that is coming or the one that already existed.
On Feb 24, I sent a trade alert where I bought Dell Technologies [DELL]. My base-case fair value is $206 per share, implying about +73% upside before dividends. I added DELL to the portfolio because I see three compounding engines working at the same time:
A demand wave: enterprise infrastructure spending is shifting toward AI clusters and dense compute, and Dell sits right where those orders land. Q3 2026 shows record AI server orders of $12.3B, $30B YTD orders, and $18.4B backlog.
An operator edge: Dell’s direct model and supply chain discipline show up in the numbers, especially in how it manages costs, pricing, and working capital through volatile cycles.
A shareholder flywheel: Dell explicitly targets returning over 80% of adjusted FCF through repurchases and dividends, and management has already pointed to $14.5B returned since FY23.
What the market gets wrong
The market often treats Dell as two fragile businesses: selling commodity PCs and low-moat servers.
That view sounds reasonable. It also ignores that Dell’s “moat” comes from process, not patents: distribution, integration, financing, and global delivery at scale. Dell even spells out those operational advantages in its business description, including an extensive direct sales force, a global channel network, a global services footprint, and a large-scale supply chain.
Three KPIs I watch first
AI server orders, backlog, and conversion to shipments.
ISG operating income.
FCF and capital returned (buybacks plus dividends).
The market view vs reality (the bear case)
The bear case is based on:
Dell sells hardware in competitive markets where buyers bargain hard, and suppliers hold leverage.
OEM boxes look similar. So price becomes the main weapon.
AI servers can grow revenue while diluting margins because they carry heavy component content and intense competition.
I agree with the commodity diagnosis. I disagree with the implied conclusion.
Commodity economics do not mean “no edge.” They mean the edge shifts from product to operations.
Table of Contents:
How does Dell rank
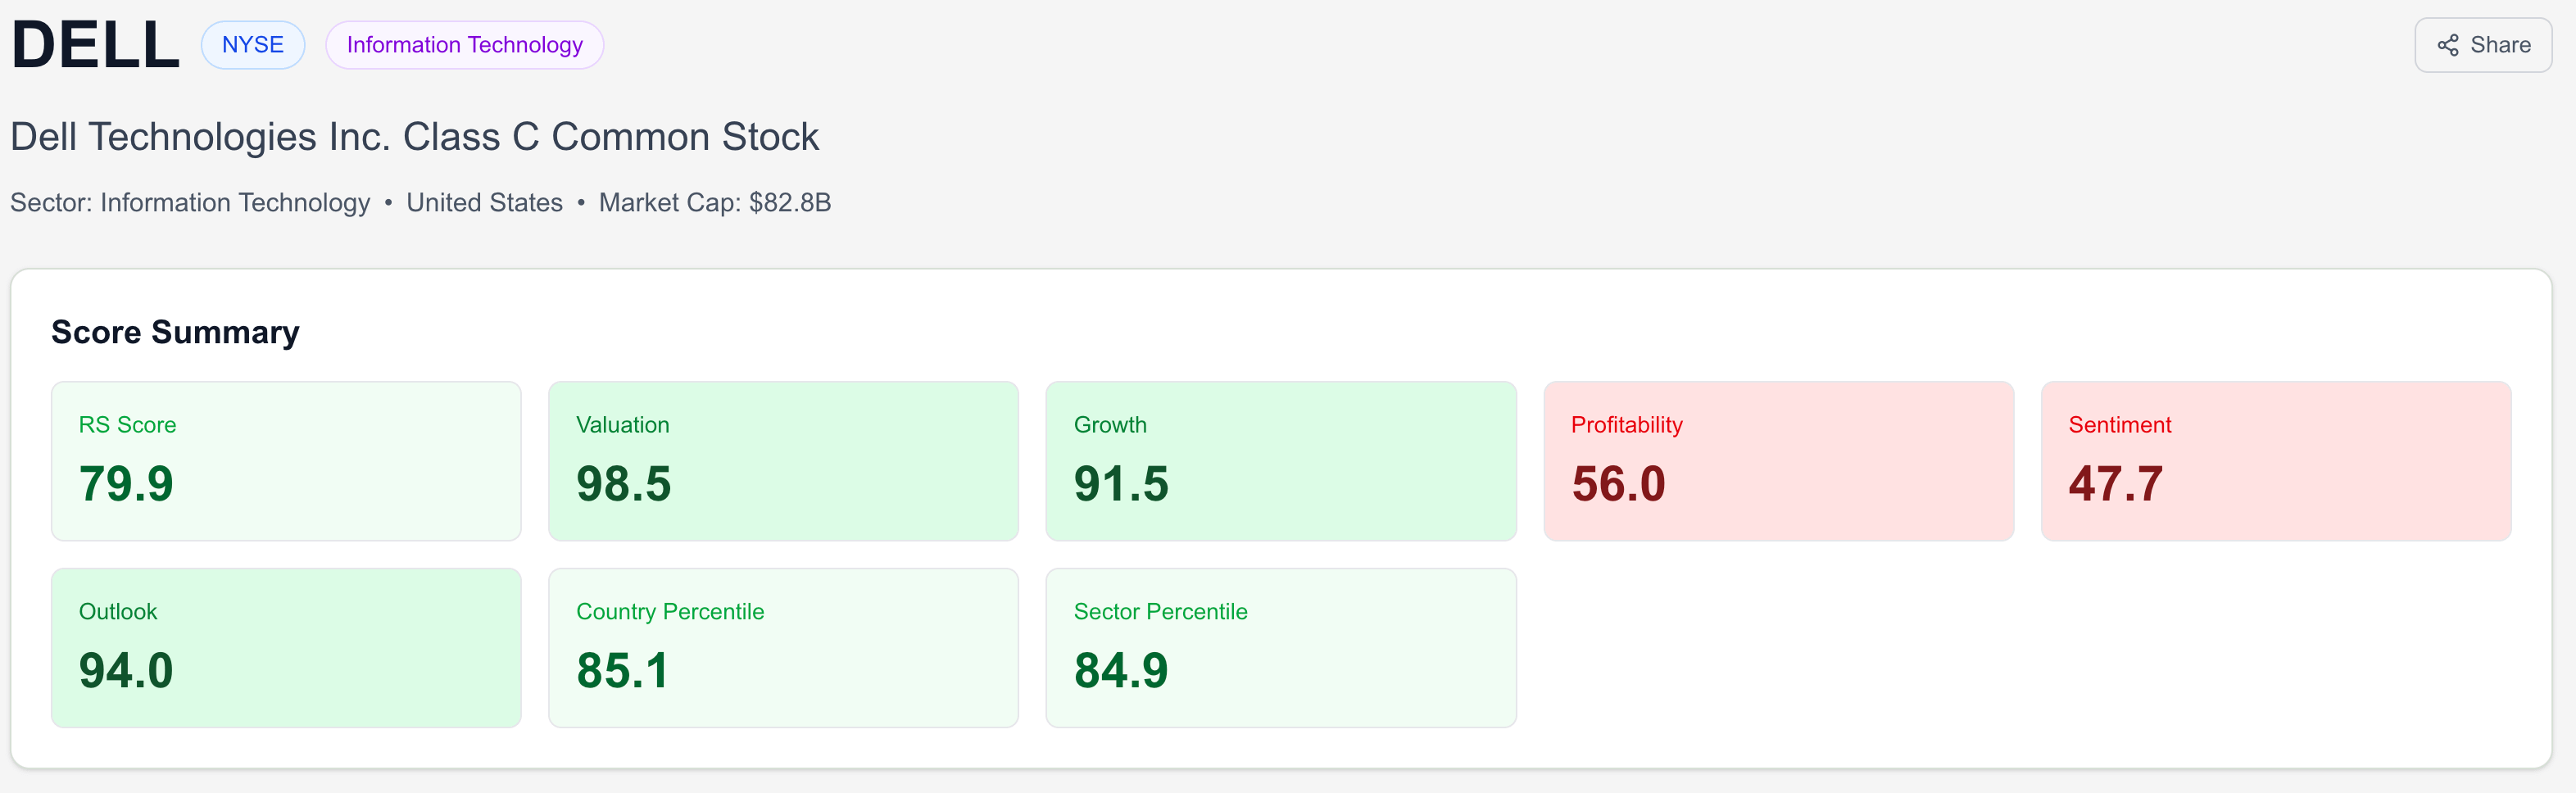
Before I go deep on the fundamentals, I like to start with a quick “numbers-first” snapshot from RankedStocks.com. It’s the temperature check.
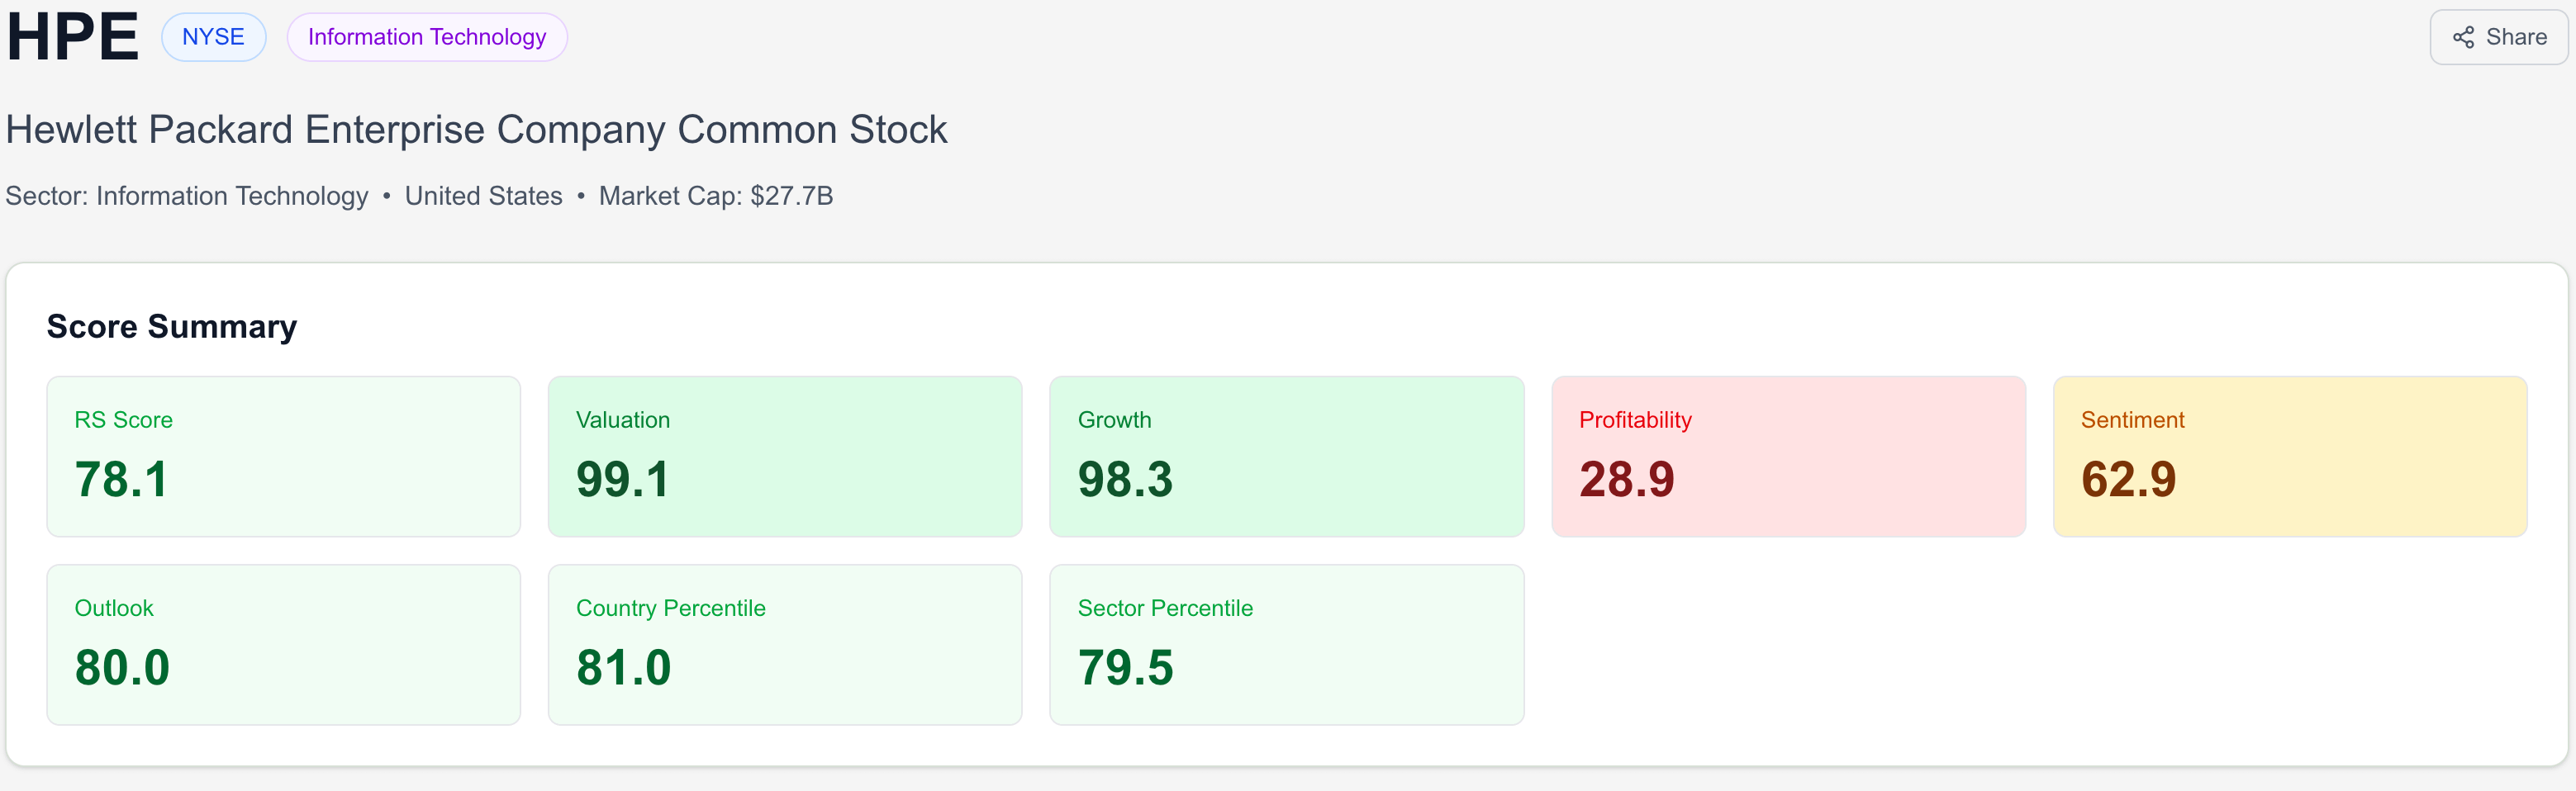
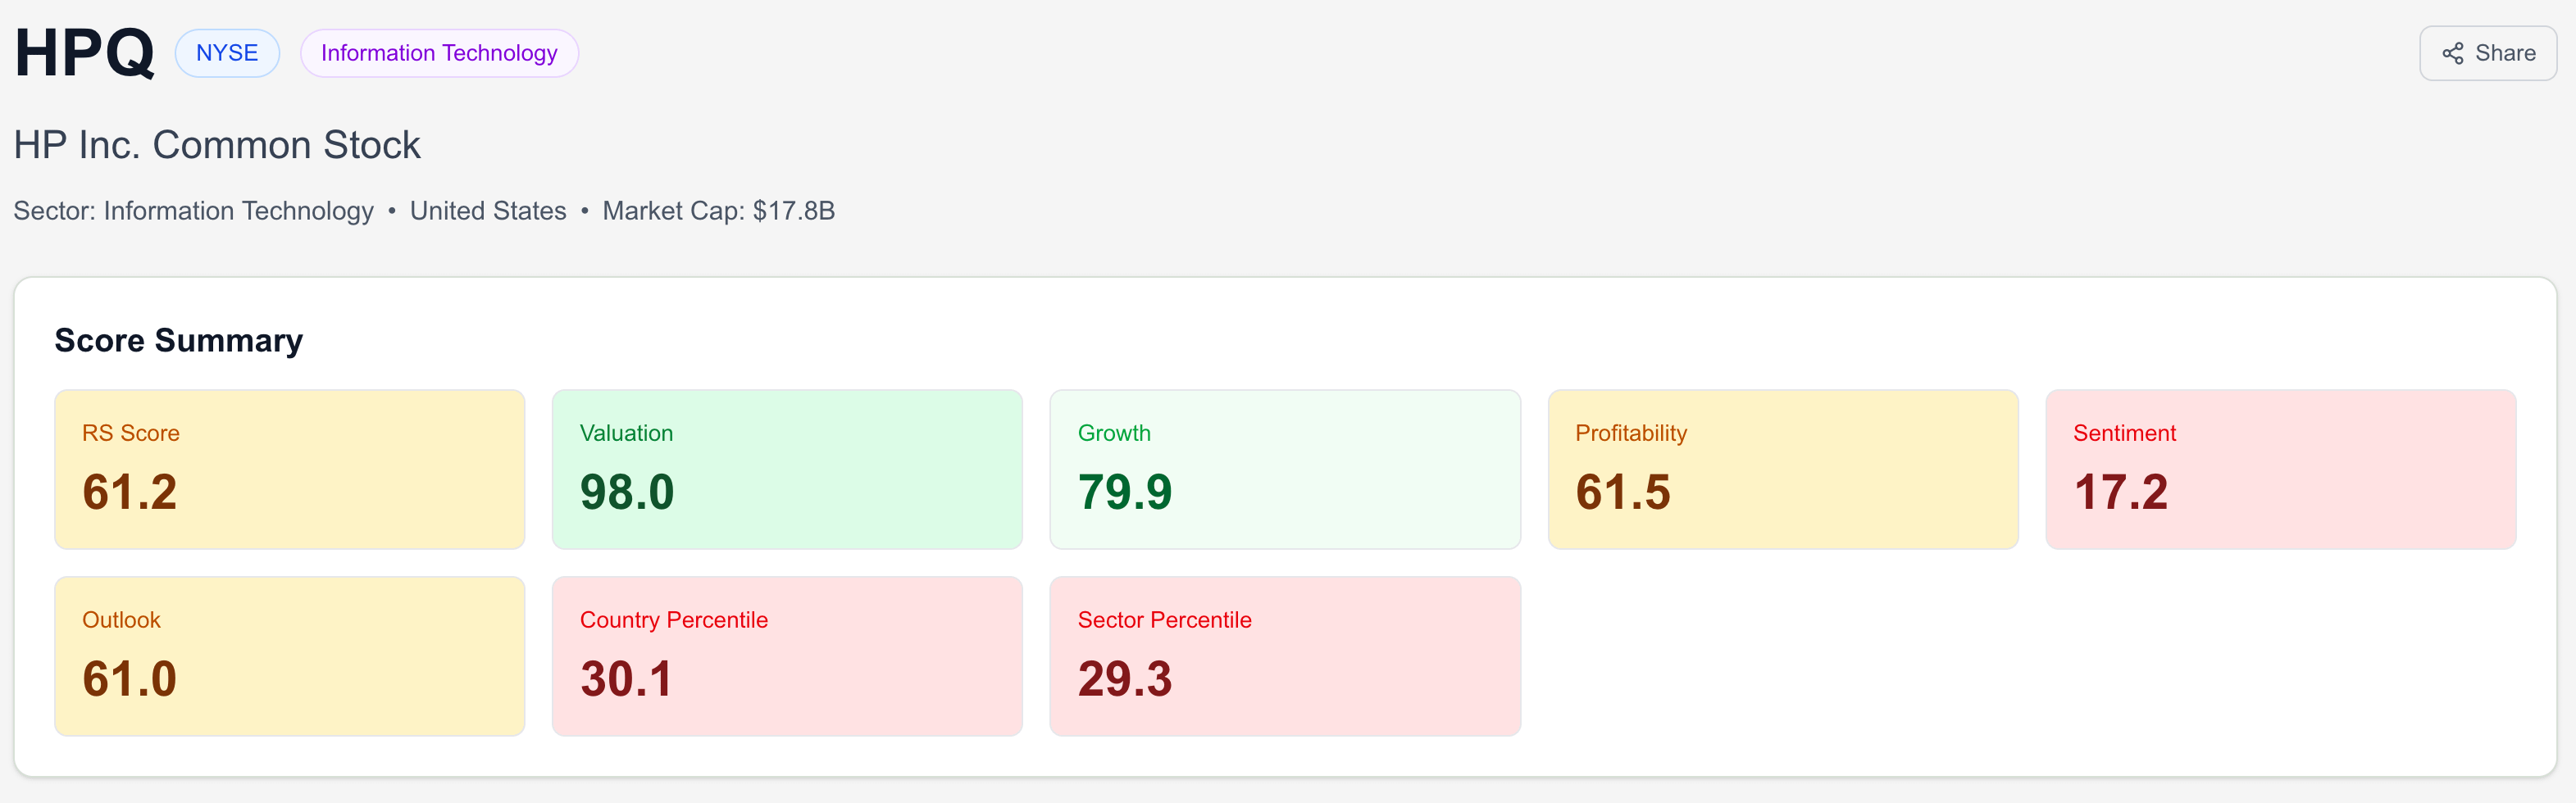
Lenovo isn’t ranked in the platform right now, so I’m leaving it out, but here are HP (HPQ) and HPE (HPE).
What I take from this
Dell scores best overall. It looks cheap (valuation 99), it shows real momentum in forward-looking factors (growth 92, outlook 94), and it sits in a strong position versus its sector and country universe (both percentiles 85). Sentiment sits in the middle, which is fine. I do not need the crowd cheering. I prefer “skeptical but improving,” as long as the fundamentals back it up.
This section is just a ranking snapshot. The rest of the thesis answers the real question: does Dell deserve to be the top-ranked name here, and can it keep earning that spot when the cycle turns?
What Dell actually is: segments, cash, and the operator moat
Dell organizes the business into two reportable segments: Infrastructure Solutions Group (ISG) and Client Solutions Group (CSG).
The business model map
Dell collects money in two different ways:
ISG sells servers, networking, storage, plus attached support and services. It is the “data centre” engine. Management explicitly highlights AI, machine learning, analytics, and multicloud as core demand drivers inside ISG.
CSG sells commercial and consumer PCs, plus peripherals and services. It is a big engine, but it lives in a brutally competitive pricing environment. Dell says that directly in its MD&A when discussing margin pressure in CSG.
Dell also supports customers with payment and consumption options through Dell Payment Solutions and Dell Financial Services, including leases and loans. In FY25, DFS funded $8.4B of originations and maintained an $11.2B global portfolio of financing receivables.
The money flow matters because Dell’s advantages show up when a customer wants more than a commodity box:
designing a full rack solution,
integrating it,
financing it,
deploying it globally,
supporting it over time.
The segments in numbers
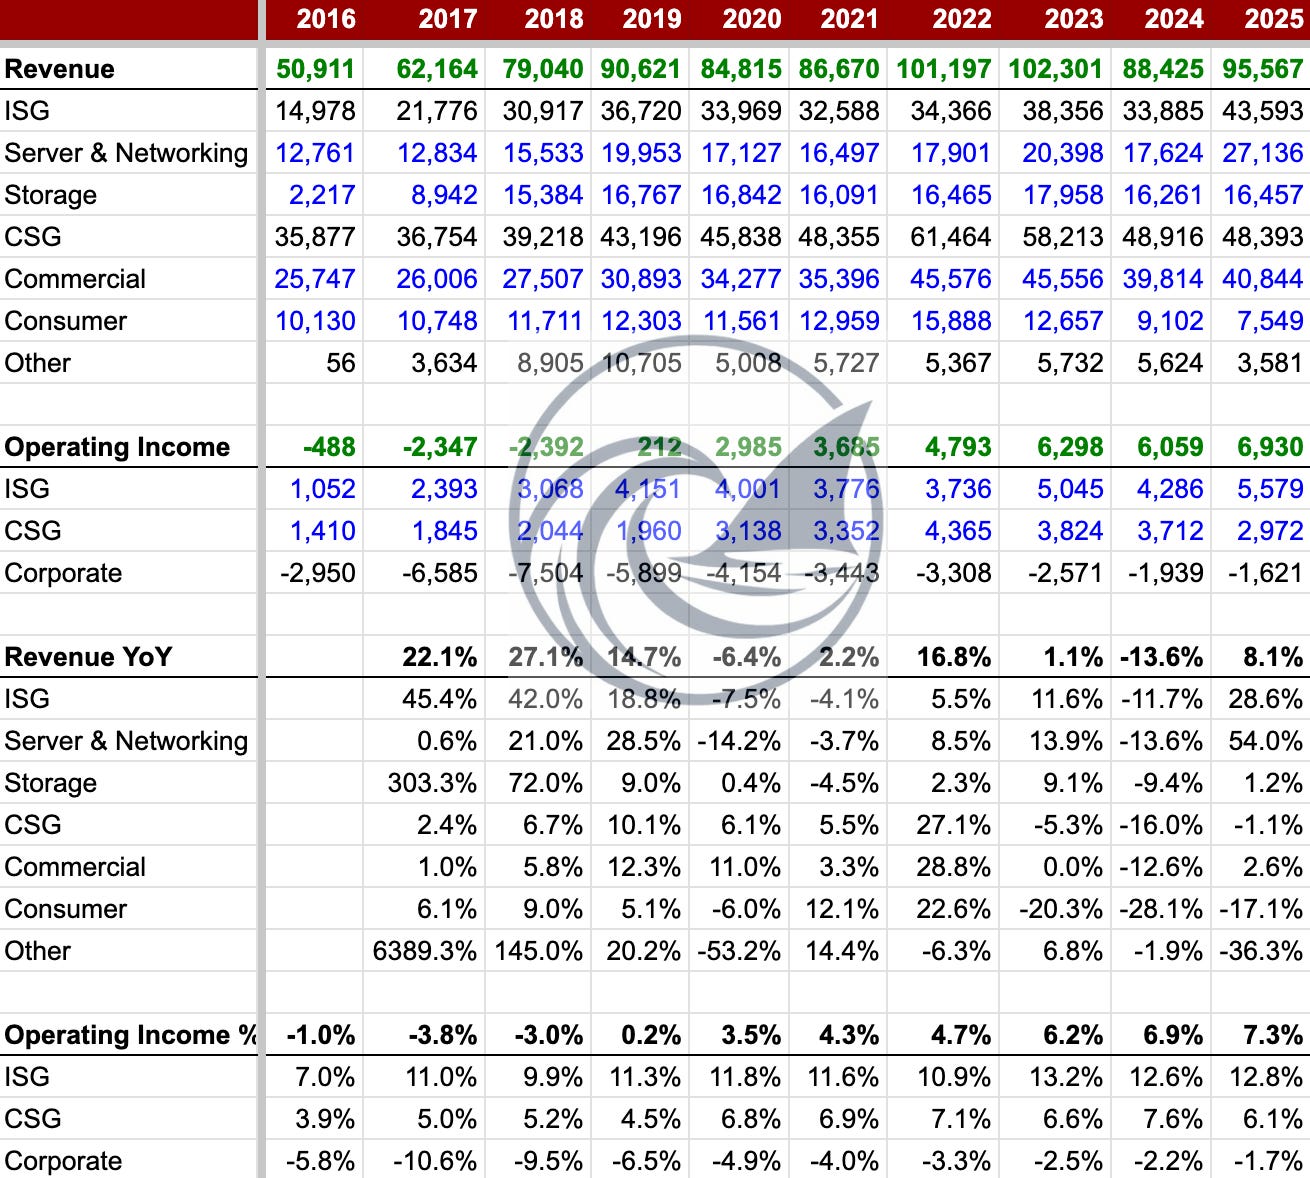
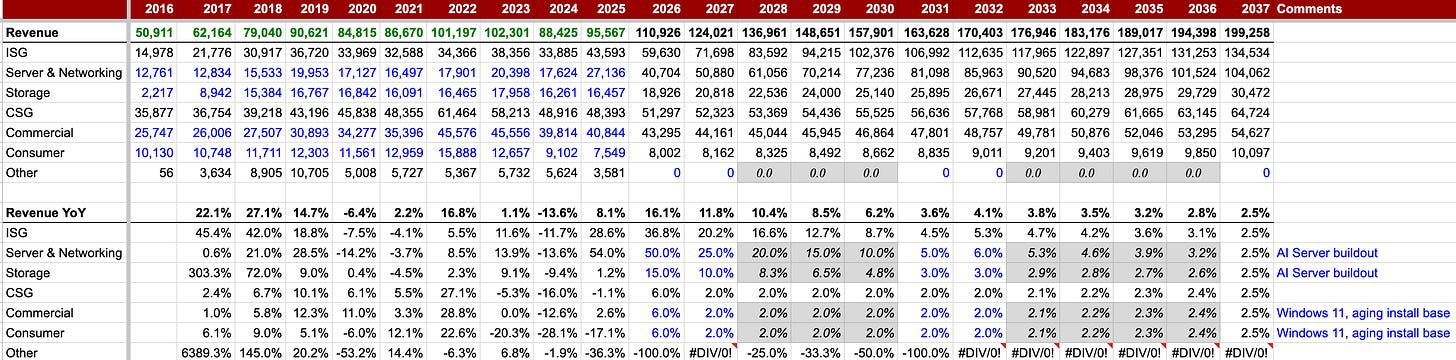
Here is a snapshot of Dell’s segments’ revenues and operating income.
Five interesting observations:
ISG is turning into the center of gravity. In FY16, the segment was 29.4% of revenue, but by FY25, that segment represents 45.6% of revenue. That is Dell slowly turning into an infrastructure-led company, even if the market still files it under “PC vendor.” And even inside ISG, the mix is changing more towards Server & Networking than Storage.
ISG stays the profit center even when revenue swings. ISG runs at 12% - 13% operating margins across the last three years.
CSG does not drive the thesis. CSG is still the revenue base, but it did not grow. Inside CSG, while Commercial held up, Consumer keeps shrinking.
CSG profits swing harder than the revenue suggests. CSG operating income fell from $3.7B to $3.0B in FY25, even though revenue stayed flat. That shows how sensitive CSG is to mix and pricing. A small shift in discounting, components, or demand can move margins fast.
Corporate costs are shrinking, but they still tax the system. Corporate losses improved from ($2.6B) to ($1.6B) over the three years. Still, Corporate takes a bite out of the segment profits. In FY25, ISG + CSG generated $8.6B of operating income, and Corporate pulled $1.6B of it away. That is roughly 19% of segment operating income going into the corporate void.
What does “operator moat” mean here?
When I say “operator moat,” I do not mean patents or the brand. I mean the boring stuff that decides who wins when hardware turns into a knife fight: who gets supply first, who prices faster, who ships faster, who fixes faster, and who keeps customers from churning when the cycle turns.
Below are Dell’s four operational advantages:
Advantage #1. Global scale
Scale is leverage. It gives Dell more shots on goal across procurement, logistics, manufacturing capacity, and customer reach.
Dell operates in over 170 countries. That matters because AI infrastructure demand is not coming from one neat bucket. It is coming from enterprises, “neo-clouds,” and sovereigns, all at once, along with traditional data center refresh budgets.
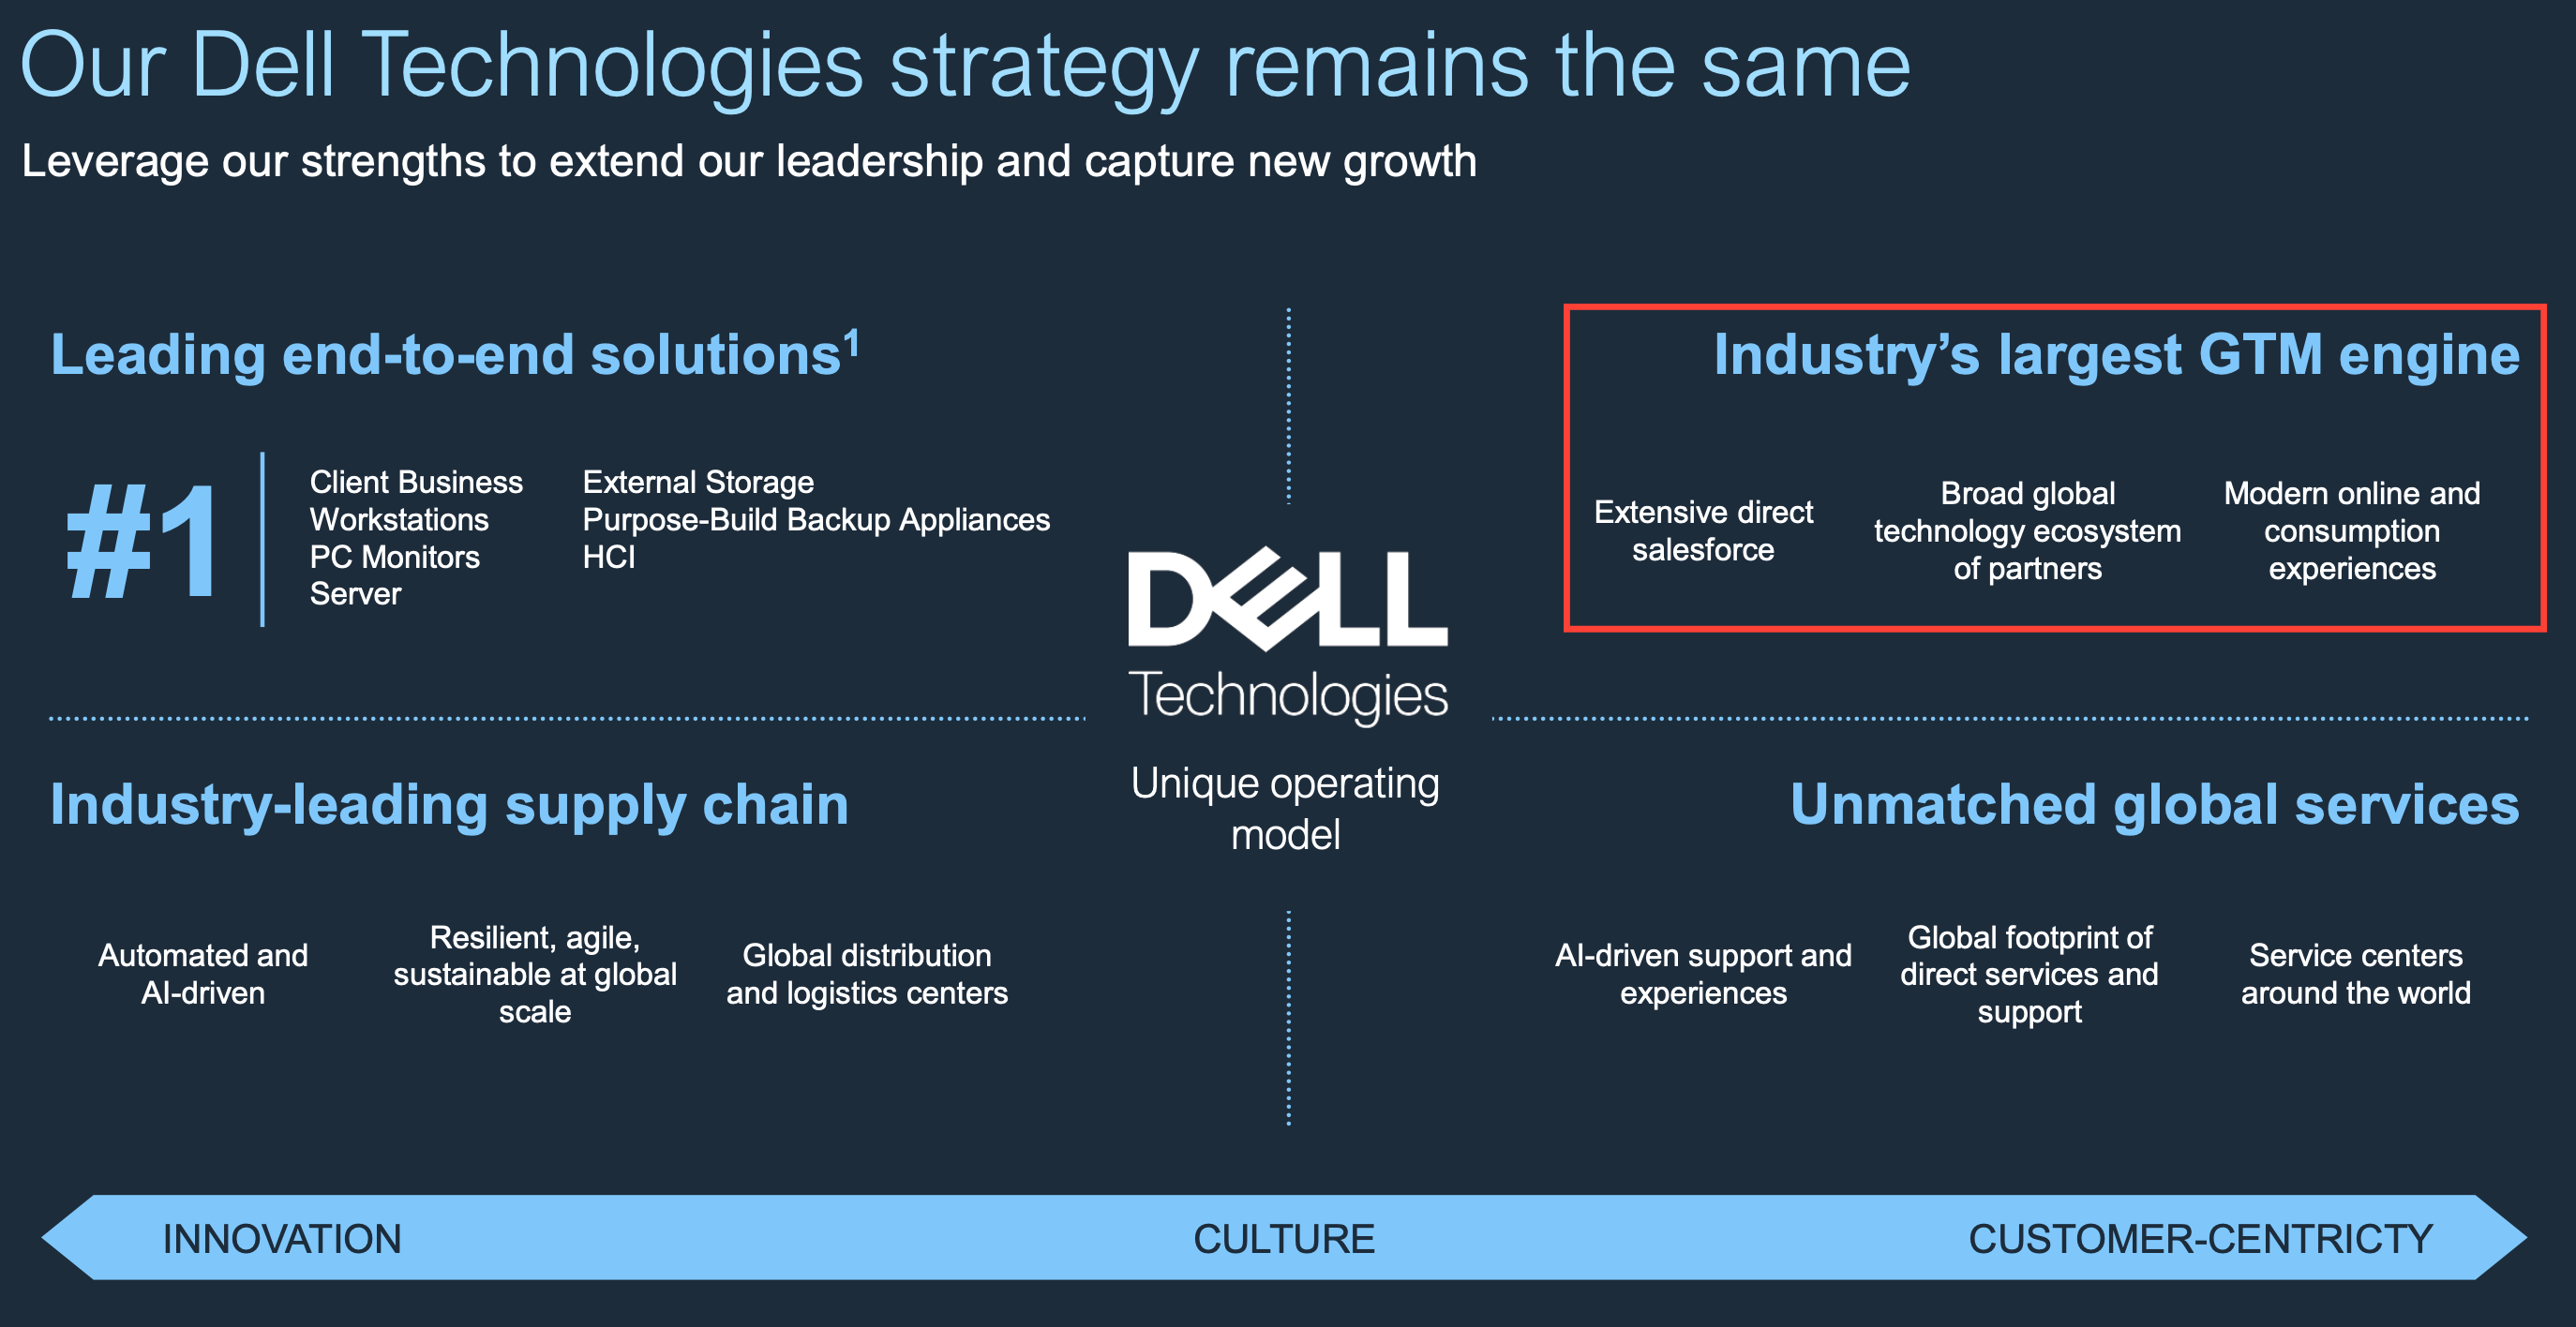
Scale also shows up in how Dell frames its go-to-market engine. In the October 2025 Securities Analyst Meeting deck, Dell calls out the “industry’s largest GTM engine” and ties that directly to global reach and execution capacity.
Advantage #2. Direct sales plus channel
Dell’s go-to-market includes an extensive direct sales force and a global network of channel partners. It sells directly and through value-added resellers, system integrators, distributors, and retailers, and it tries to run those routes as one unified customer experience.
Two details matter a lot:
Direct sales create direct communication with customers, which helps it refine offerings and navigate supply chain challenges and complexity.
Other sales channels generated about 50% of net revenue in FY2025. So this is not a “direct-only” story. It is a hybrid machine.
Dell describes a very mechanical loop: configure around constraints, shift mix, and reprice quickly. The direct model lets Dell move demand to where supply is and react to market signals faster, including repricing when needed. That is operator moat in one sentence.
Why I care:
Direct gives Dell a faster demand signal and faster pricing action.
Channel expands reach and lets Dell scale outcomes delivery, especially in the enterprise and public sector.
Advantage #3. Global services footprint
Services are not a nice-to-have add-on. In AI infrastructure, services decide whether the customer gets to value in weeks or in quarters.
In Q3 FY2026, Dell gave a concrete output metric that I love because it is hard to fake: it claims AI racks are operational within 24 to 36 hours of delivery with uptime exceeding 99%. Whether those numbers hold perfectly is less important than the point: Dell is selling execution, not boxes.
Online, Dell also describes its service stack plainly: consulting (plan and optimize), deployment (bring systems online faster), support (proactive issue detection), and managed services (operate infrastructure so customers can focus elsewhere).
Why I care:
Services compress time-to-value and reduce “implementation regret,” which lowers churn risk.
Services create the attach opportunity Dell keeps hinting at: footprint first, higher-margin layers later.
Advantage #4. Supply chain that stays agile
This is the most “operator moat” part of the story. Dell’s supply chain operates at a significant scale with the ability to remain agile in a variety of environments. In other words, its model gives it flexibility to optimize backlog by expediting shipping or prioritizing orders with shorter lead times.
Why I care:
AI infrastructure is currently a supply chain sport: GPUs, memory, networking, power, and racks.
The winners will be the firms that keep converting demand into shipped systems, without margin blowing up.
The negative working capital machine and ROIC
Dell’s most misunderstood feature is not AI. It is how the company turns daily operations into cash.
What the balance sheet says
As of Q3 FY26, Dell had $18.7B parked in accounts receivable and inventories. But on the other hand, Dell’s clients and suppliers are financing $36.4B via payables and short-term deferred revenues (or $8.9B if you include long-term deferred revenues).
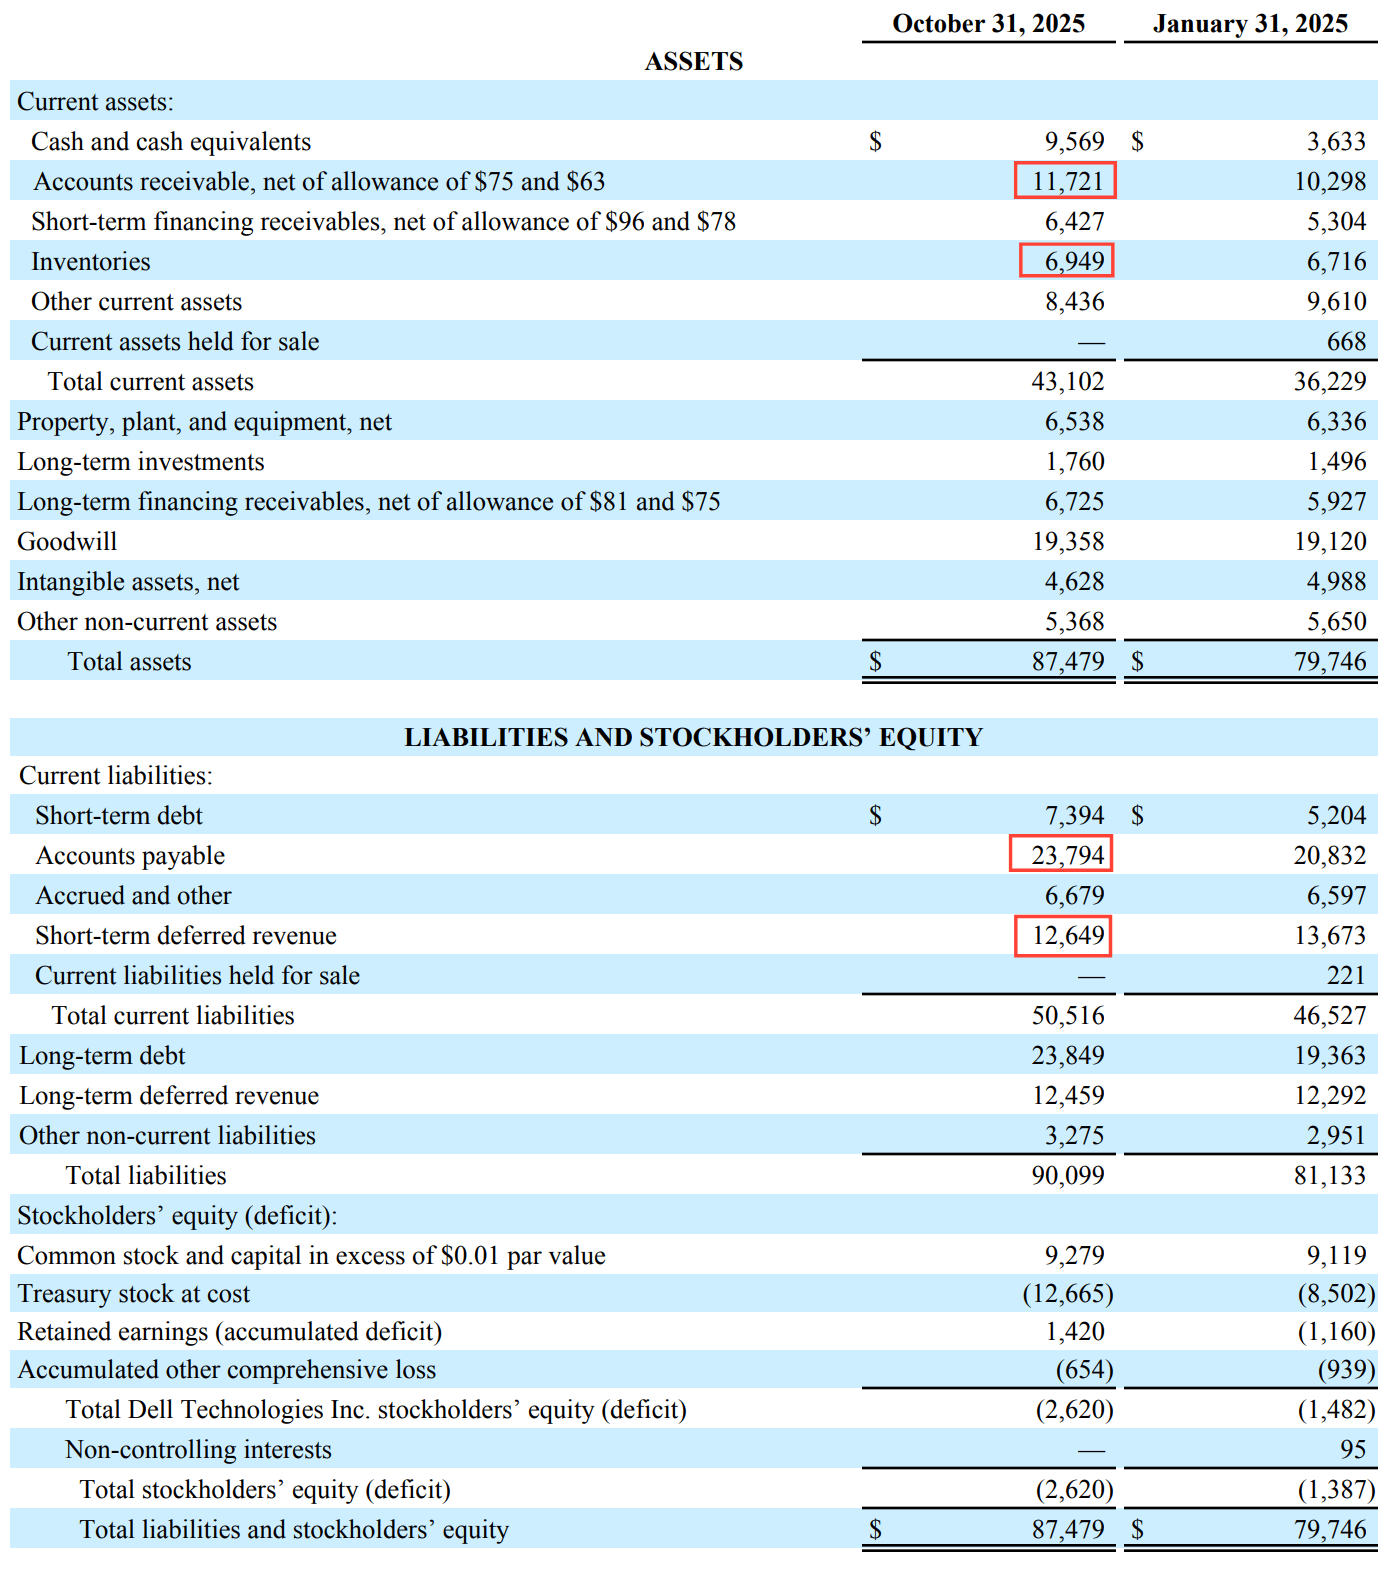
“Deferred revenue” often acts like a free loan from customers. Payables act like a free loan from suppliers. When those are bigger than receivables and inventories, invested capital shrinks.
A simple cash conversion cycle walkthrough
Using FY25 statements, a basic average-balance estimate produces:

That implies a negative cash conversion cycle, meaning Dell often receives cash before it pays suppliers. This is consistent with how Dell frames its long-term model: it explicitly talks about a “differentiated negative cash conversion cycle” as part of its value creation setup.
But in 2025, operating cash flow got hit by working capital dynamics driven by AI, which increased inventory, receivables, and payables. That is exactly what I expect when a company ramps up large, complex AI systems.
Why this drives ROIC above what you’d expect
Dell can get a high ROIC in two ways:
earn a decent after-tax margin, and
run the business on a surprisingly small pile of invested capital.
That second part is the “operator moat” in Dell’s case.
The backstory: why ROIC looked mediocre for years
The EMC deal turned Dell into a much bigger platform, but it also inflated the capital base.
Dell financed a huge chunk of the EMC transaction with debt. It issued $43.2B of debt connected to the EMC merger transaction.

The acquisition loaded the balance sheet with enormous goodwill and purchased intangibles (tens of billions each).
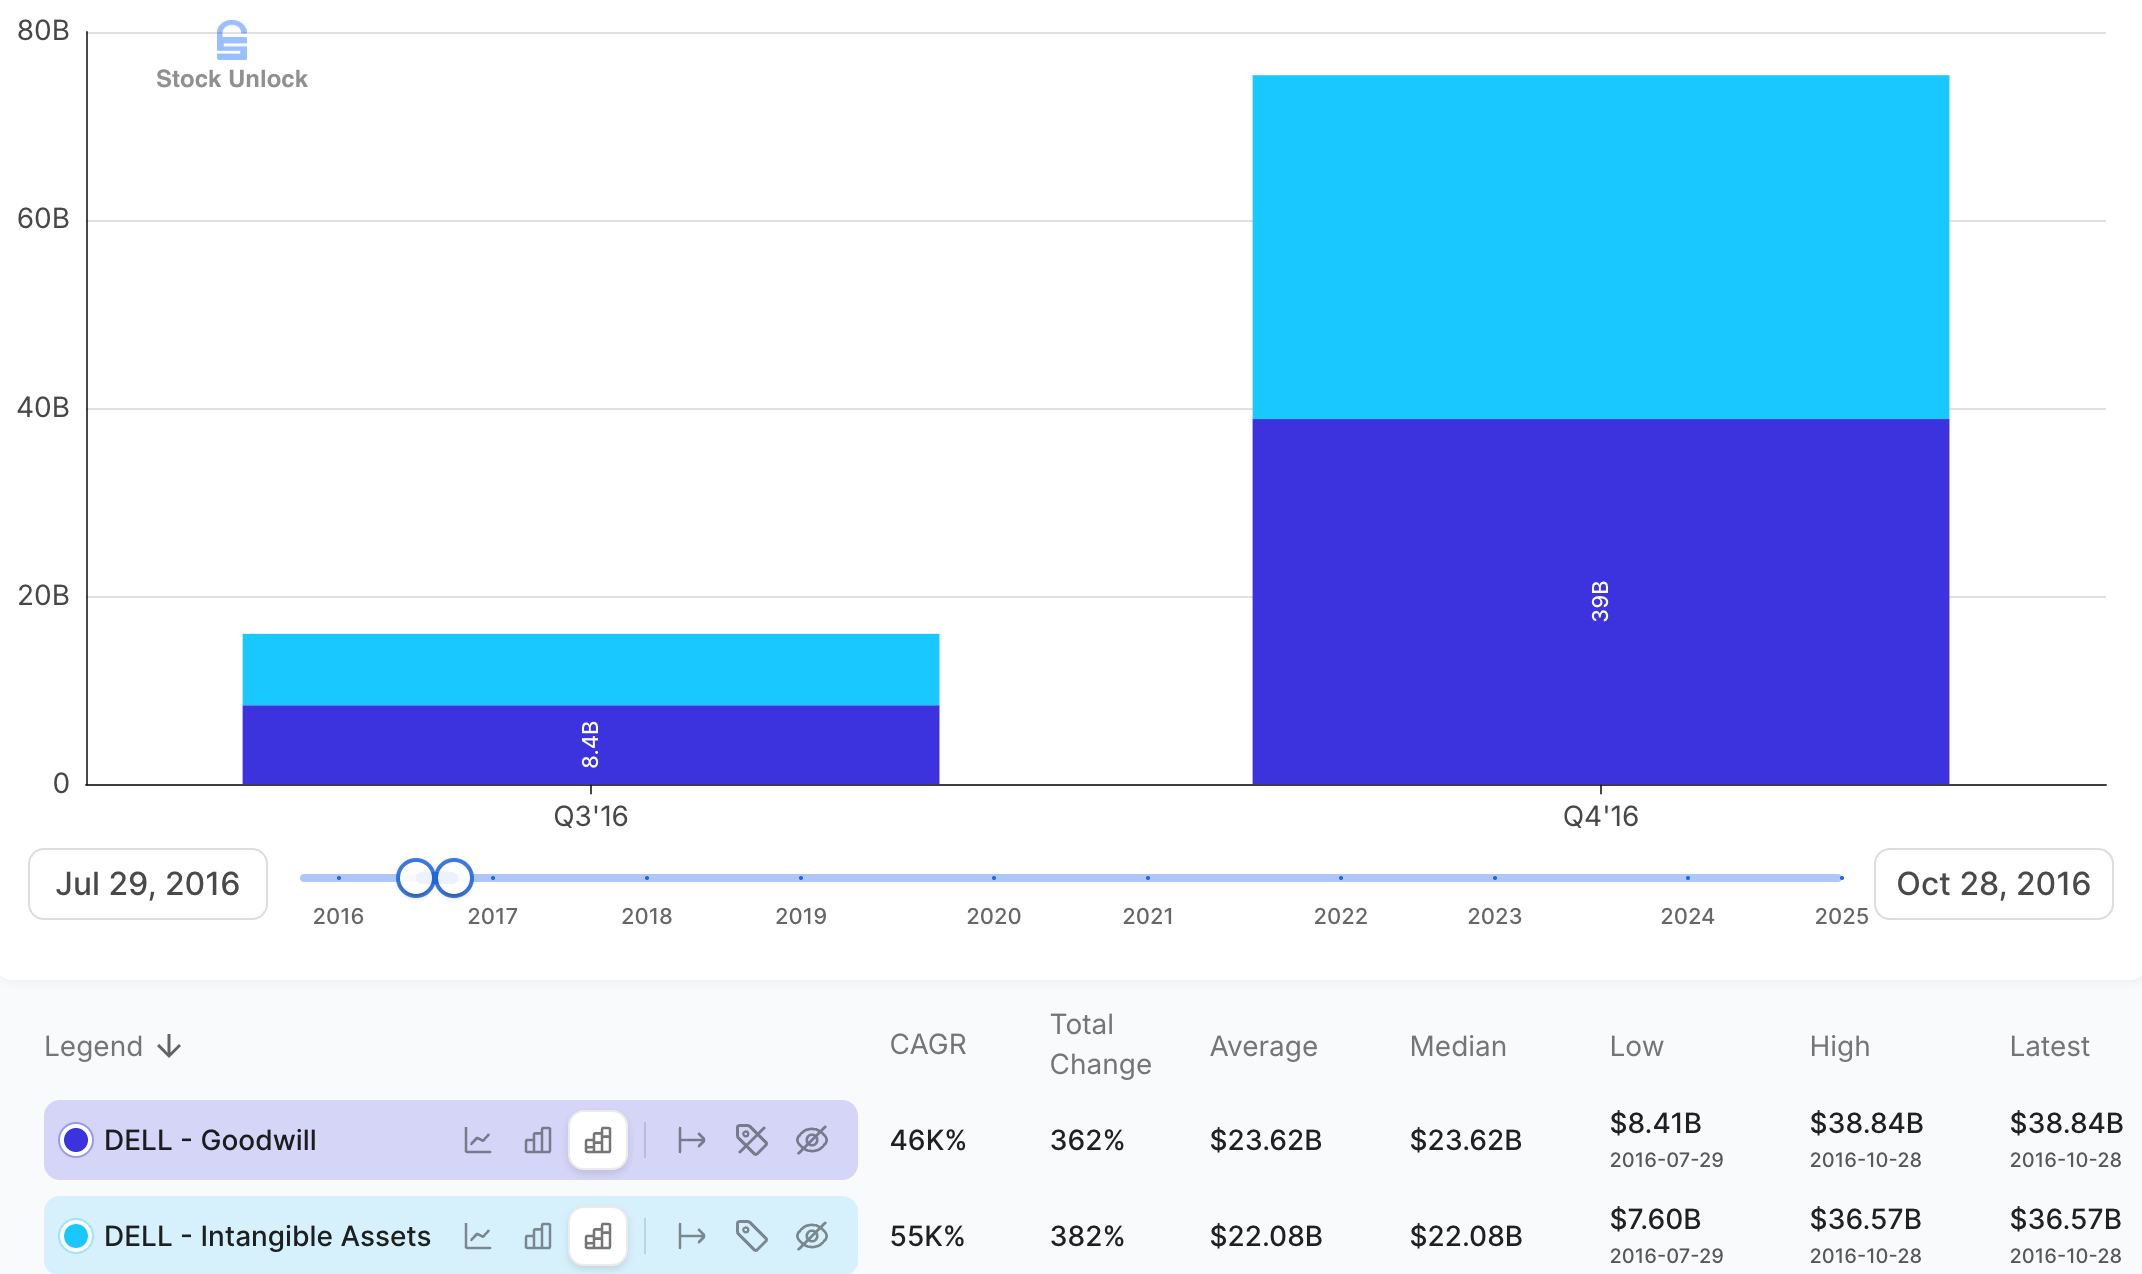
That combo matters because ROIC punishes you for carrying a big capital base, even if the business is solid. That is the reason for the negative ROICs up to 2018.
The turning point: the VMware spin-off changed the denominator
Dell completed the VMware spin-off on Nov 1, 2021. Right before the separation, VMware paid a $11.5B special cash dividend, and Dell received about $9.3B. Dell then used those proceeds to repay debt.
Dell later quantified the debt impact: debt went from $29.2B to $16.1B y/y, and it explicitly ties that drop to the $9.3B VMware spin-off special dividend.
After VMware, Dell looked more like a focused operating company and less like a merger-era balance sheet artifact. Below you can clearly see the ROIC improvement after the VMware spin-off.

What the ROIC table is really saying
The chart shows that the big ROIC jump came from capital turns, not some miracle margin expansion.
NOPAT margin improves, but gradually.
Sales-to-capital jumps hard post-2022, which means invested capital shrinks relative to revenue.
That is exactly what I would expect after a big structural reset, plus a negative working capital model doing its thing.
FY25 is the cleanest illustration
In FY25, Dell earned $6.2B of operating income on $95.6B of revenue.
It ended the year with $3.6B of cash and cash equivalents and $24.6B of total debt (carrying value). And yes, Dell’s equity was still negative: total stockholders’ equity (deficit) was $(1.4)B.
Now here’s the part that makes the denominator feel “too small to be real.” Working capital.
FY25 balance sheet items (all in billions):
Accounts receivable: 10.3
Inventories: 6.7
Accounts payable: 20.8
Deferred revenue: 26.0 total (13.7 short-term + 12.3 long-term)
That structure matters.
Deferred revenue acts like customer-funded float. Payables act like supplier-funded float. When both are big, Dell needs less incremental capital to run the machine.
If I only look at these four lines, Dell’s operating working capital is massively negative:
(A/R + Inventory) minus (A/P + Deferred revenue)
= (10.298 + 6.716) − (20.832 + 25.965)
= −$29.8B
One nuance I want to be explicit about
Negative equity does not create cash. It mostly reflects past deal accounting plus aggressive capital returns.
The better takeaway is simpler:
Dell earns a mid-single-digit NOPAT margin.
It runs unusually high capital turns because customers and suppliers fund a meaningful chunk of the operating cycle.
After VMware, the capital base stopped carrying the old “conglomerate weight,” so ROIC suddenly looks like a different company.
That is how you get a hardware business posting ROIC numbers that look too good if you assume it must behave like a capital-hungry manufacturer.
AI servers: growth now, margin later
AI is the visible story. Margins are the hidden story.
Demand surge: the numbers are already large
The Q3 FY26 release includes three data points I treat as hard facts for the AI build-out:
$12.3B AI server orders in the quarter
$30B AI server orders YTD
$18.4B backlog
Dell also raised full-year AI server shipment guidance to roughly $25B, up over 150% y/y.
Why margins stay thin right now
In the Q3 2026 call, leadership repeatedly frames AI server margins as mid-single digits and emphasizes that it wants to stay consistent in that range, deal by deal.
That matters because it forces a simple trade-off:
AI servers can drive revenue growth and scale.
AI servers can also dilute gross margin if the component bill inflates faster than pricing.
Management directly discusses rising component costs, noting the cost basis is going up across all products, and then leans on the direct model to adjust mix and reprice faster.
That dynamic matches the FY25 discussion too: the company attributes gross margin compression partly to mix shift toward AI-optimized servers plus competitive pricing in CSG.
“Footprint first” makes economic sense
Here is how I think about Dell’s AI strategy:
Step one: win the rack. Ship the complex system. Get into the customer’s data centre.
Step two: sell the attach. Storage, networking, services, support, and software-like recurring streams.
Step three: increase the mix of higher-margin platforms once the footprint exists.
In the Q3 transcript, Dell talks about pivoting to “Dell IP” storage and highlights that a higher mix in this portfolio improves profitability. Management explicitly links storage mix and margin improvement to better operating outcomes, while still ramping up AI.
If I translate that into the DCF logic I use:
I accept weak AI server margins in the early ramp.
I expect blended margins to improve as Dell increases storage mix, services attach, and pricing power in more normalized component cycles.
Capital allocation, balance sheet, and what could break
The shareholder flywheel is explicit
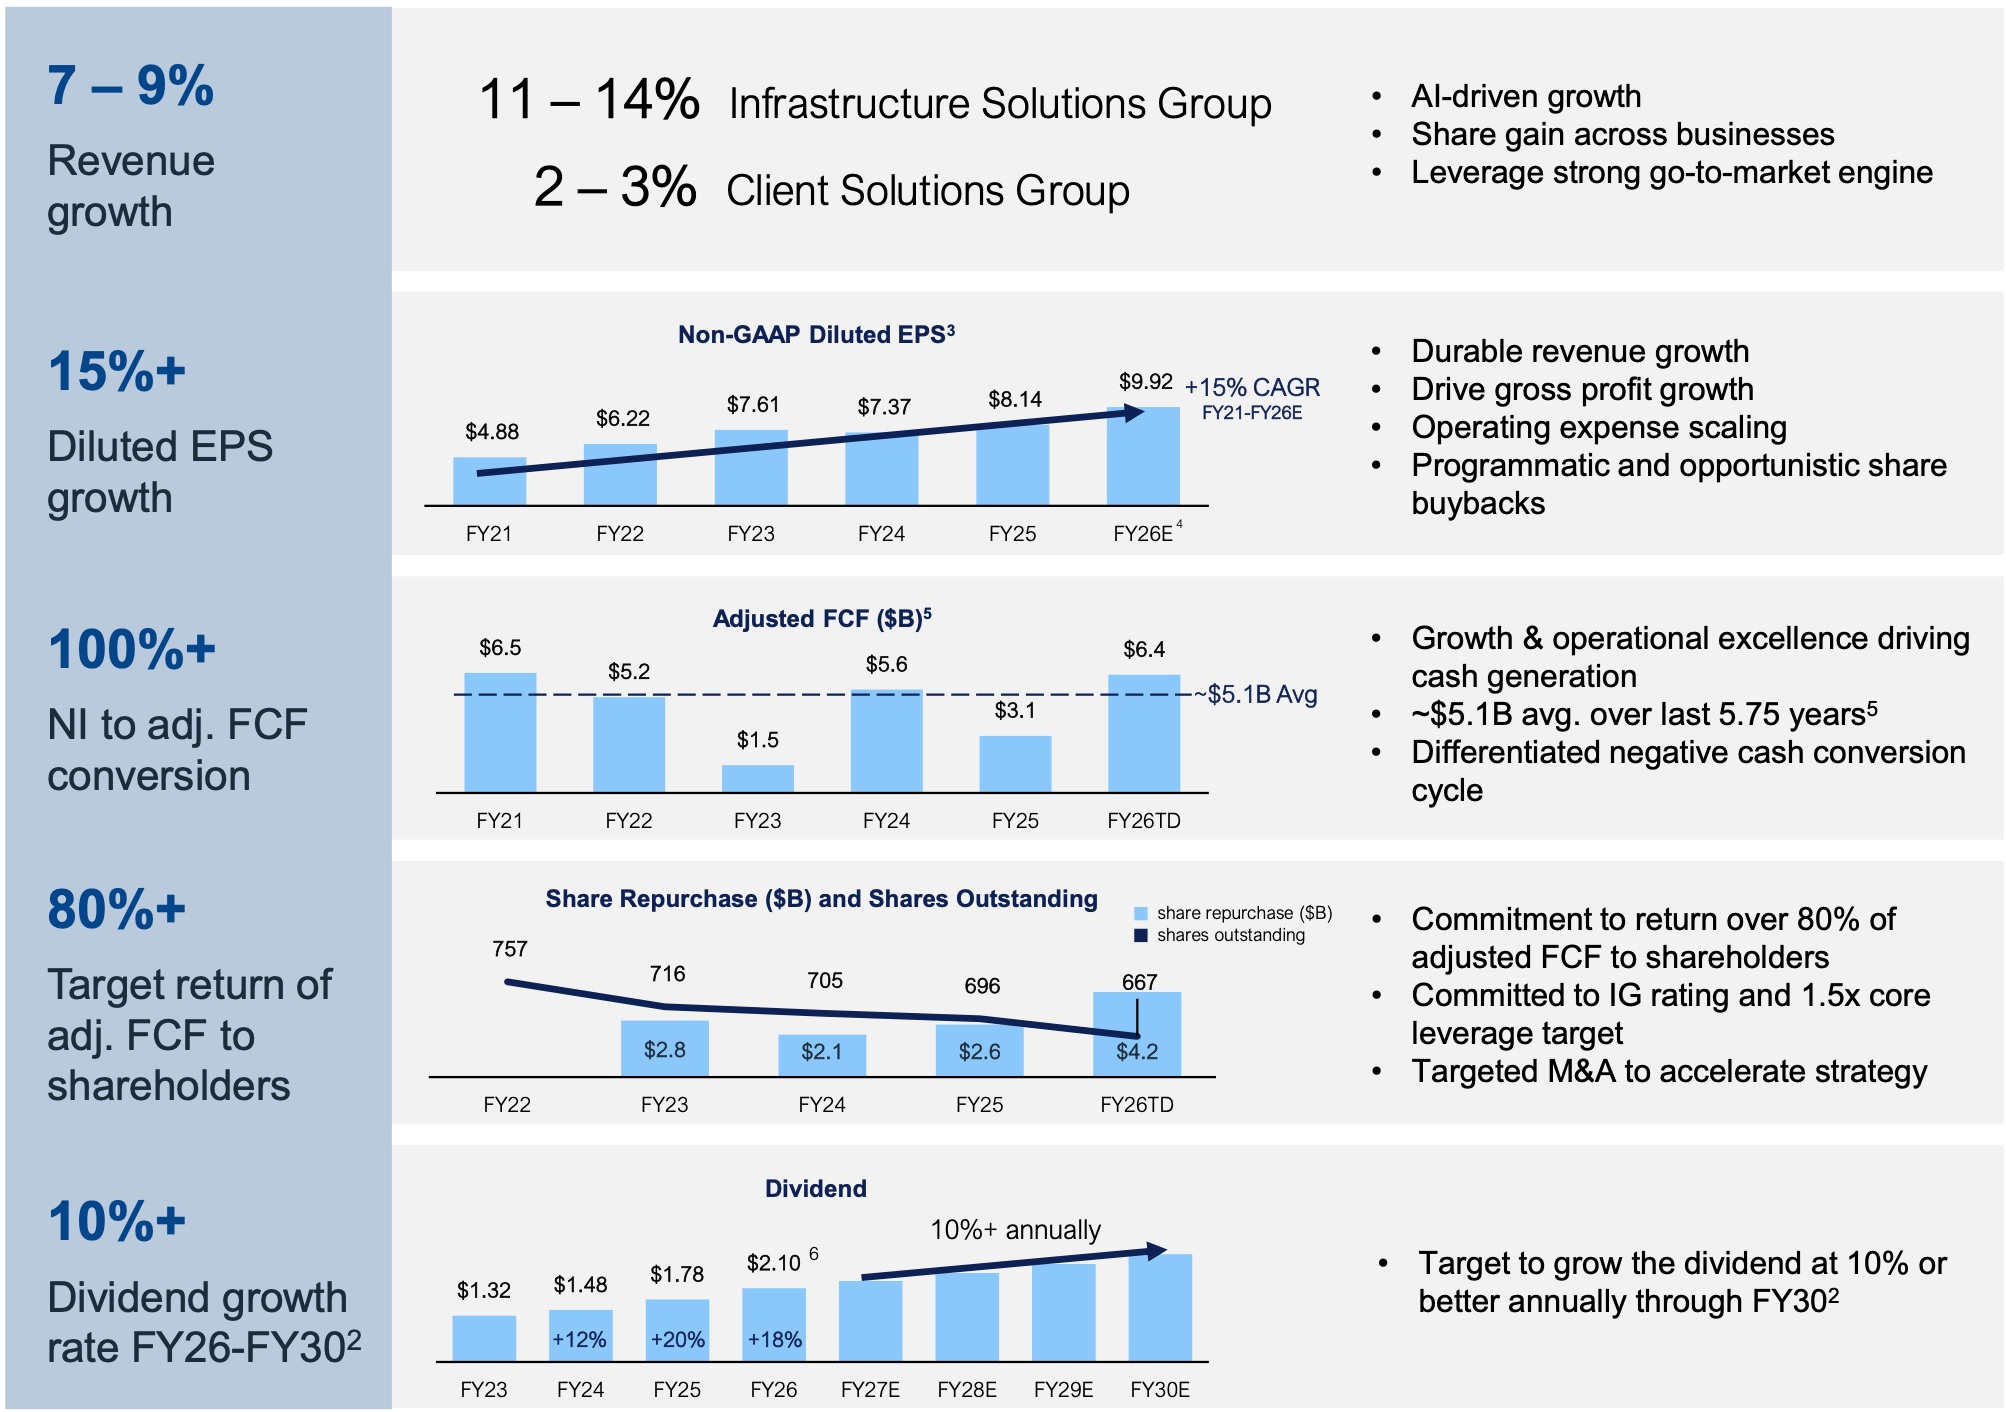
Dell’s long-term framework is not ambitious because it promises hypergrowth. It’s ambitious because it assumes discipline.
When I look at it, I don’t see a company trying to outrun its industry. I see one trying to out-execute it.
The framework implies a business that can grow steadily, convert most of its earnings into cash, and return the bulk of that cash to shareholders without stretching the balance sheet. That combination is rare in hardware, and it changes how I think about value creation here.
What really matters to me is not any single target, but how they work together.
Dell can compound per-share value even in a modest growth environment if three things hold:
Operating profit stays resilient,
Working capital continues to act as a source of funding rather than a use, and
Excess cash keeps flowing into buybacks and dividends.
That is not theoretical. Management has already leaned into this approach. Since launching the dividend in FY23, Dell has returned $14.5B to shareholders through repurchases and dividends.
I can also see it in the share count trend. Diluted weighted-average shares outstanding fell steadily from over 760M in FY22to 662M as of Feb 2025.
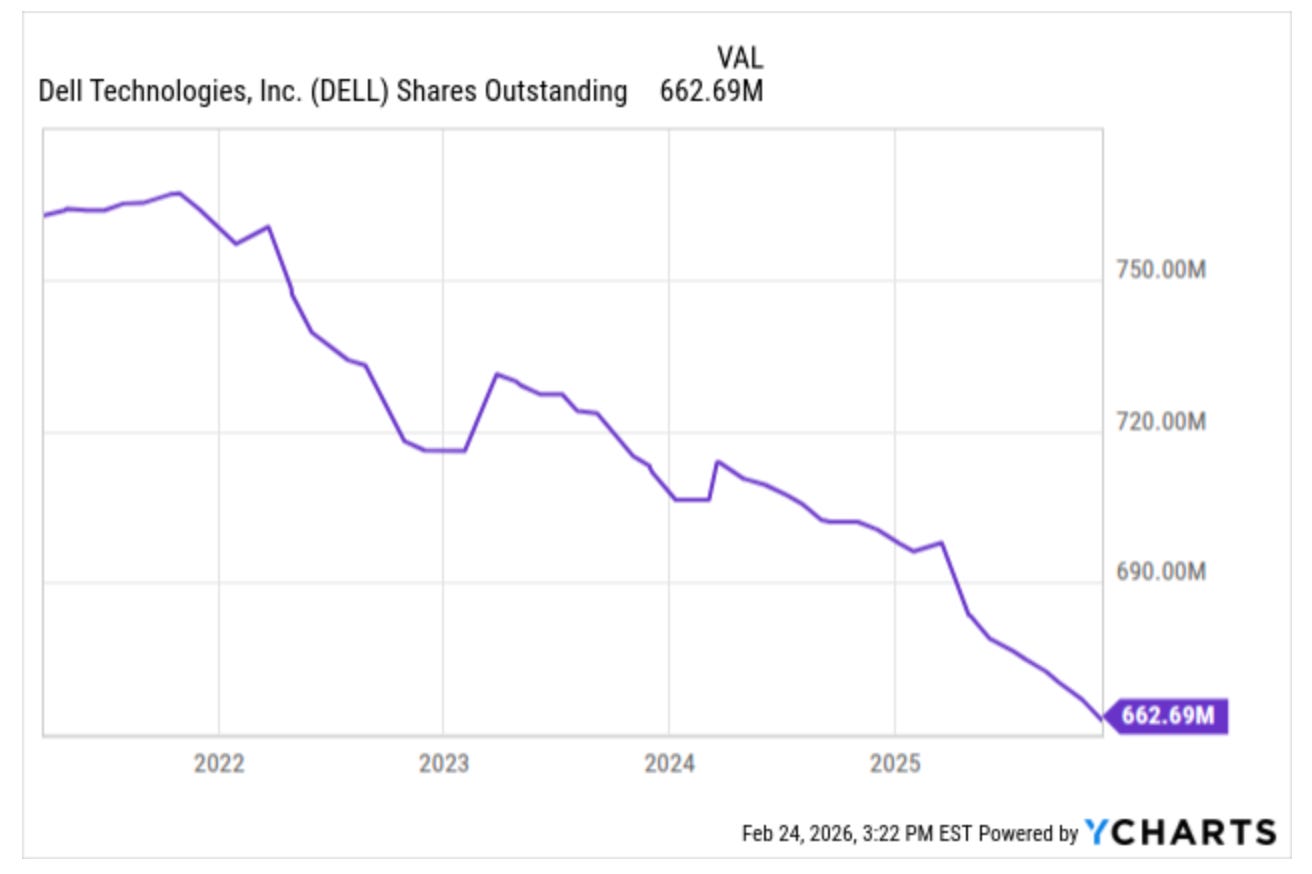
Put differently, Dell does not need to be a growth story to be a good investment. It needs to remain a cash-generating, capital-disciplined operator that shrinks the share count over time.
That is a far more reliable way to compound value than hoping for multiple expansions in a cyclical hardware business.
Debt and interest: the “hidden constraint” I watch
Dell runs with meaningful debt. At FY25 year-end, total debt (principal amount) is $24.8B.
The maturity ladder matters:

Note that since FY25, debt has increased by $6.7B.
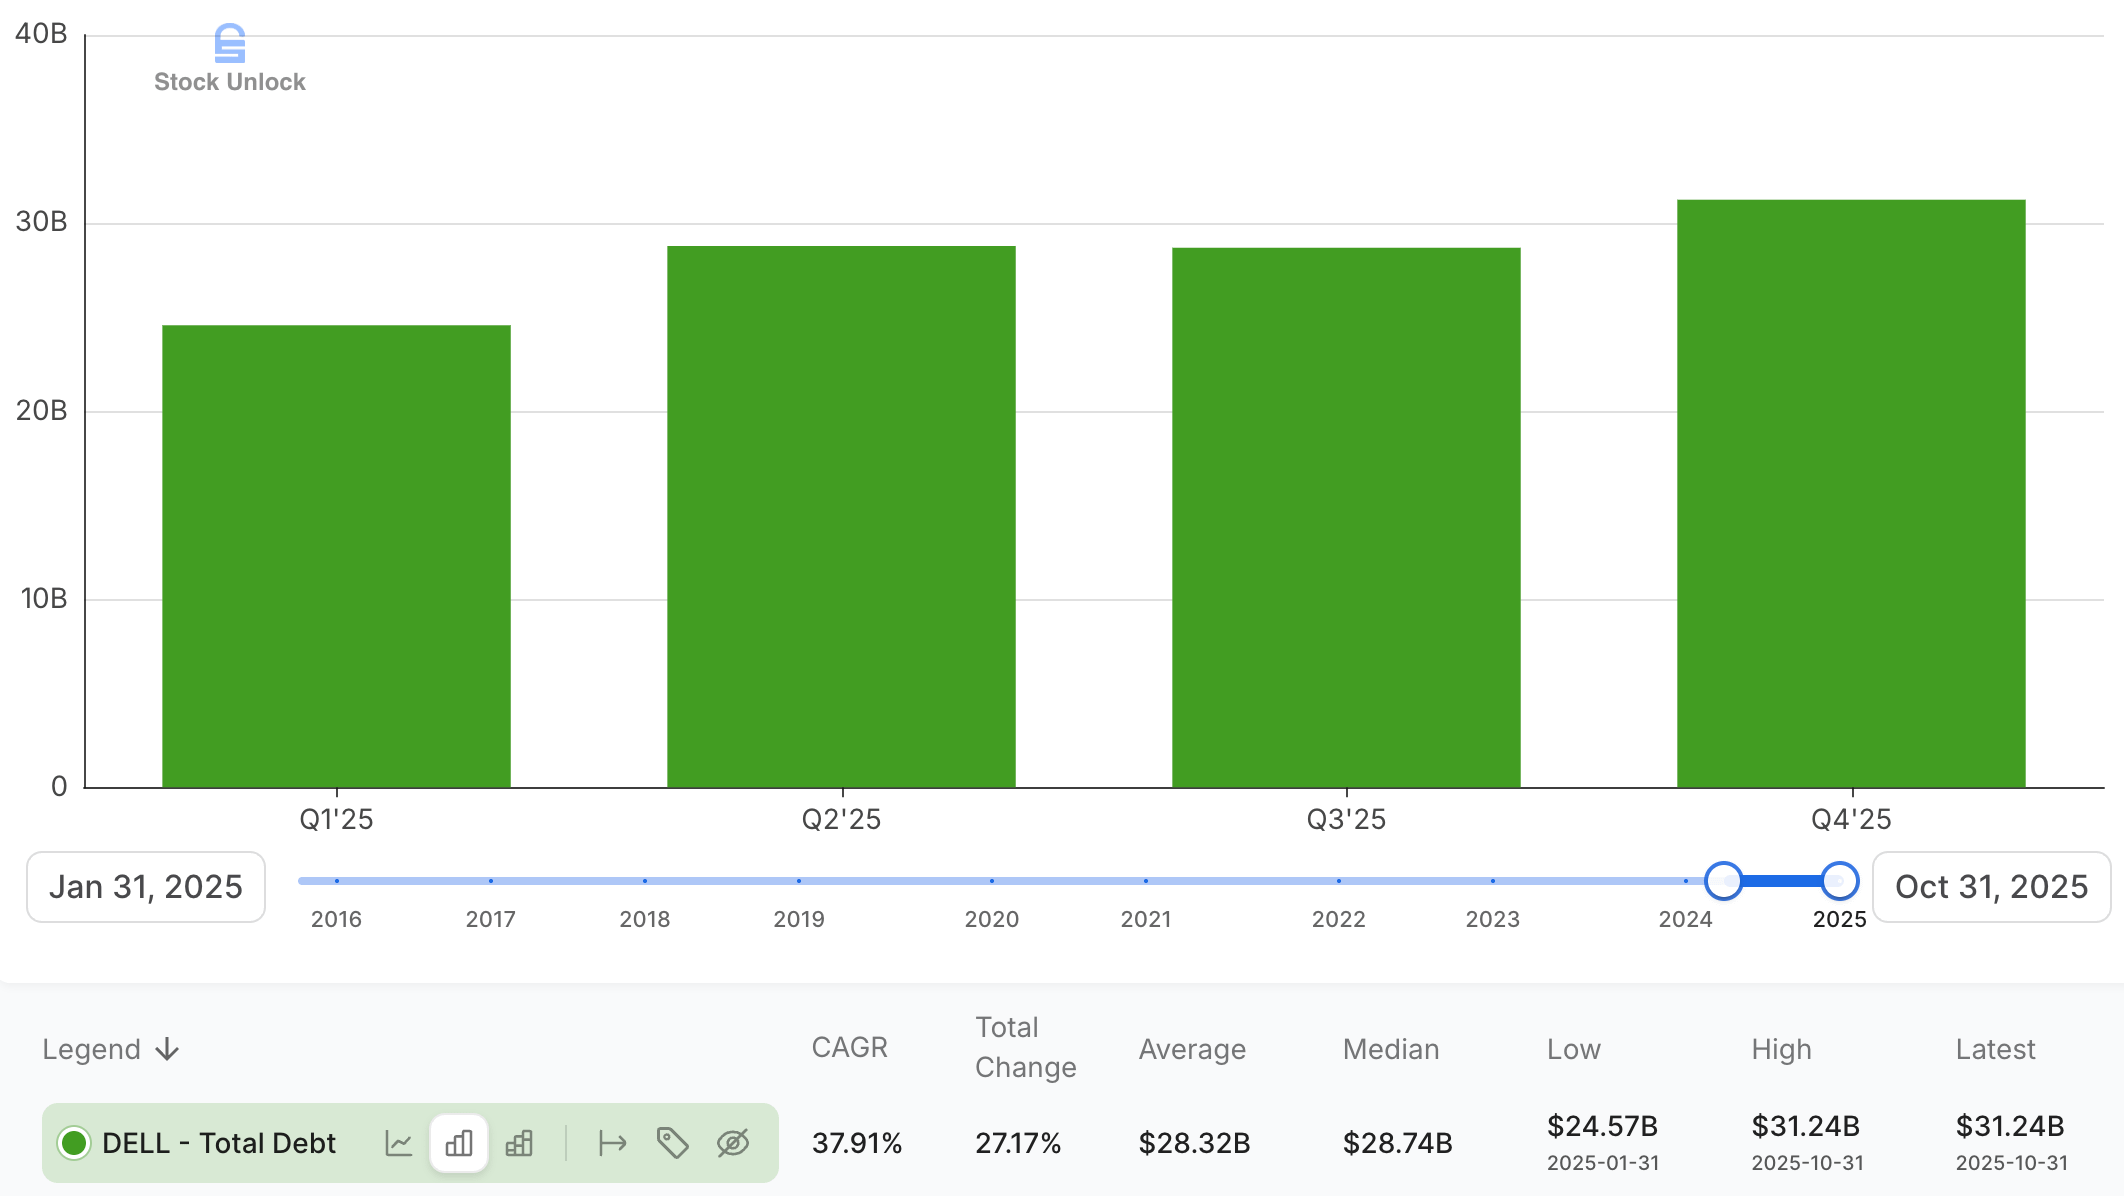
This is the constraint, as if AI ramps but cash conversion stumbles, Dell cannot pretend debt service does not exist. Debt service reduces flexibility and absorbs operating cash flow.
Peer Comparison: Dell vs. HPE, HPQ, and Lenovo
If you have covered the sector for as long as I have, you know that comparing these four companies today is a study in divergent corporate strategies born from a single era of shared DNA.
A decade ago, the industry was obsessed with the idea that “bigger is better.” Then came the great fracturing. HP split into two companies in 2015 to “unlock value,” while Dell went the opposite direction taking itself private, swallowing EMC in a $67 billion deal in 2016 to build an end-to-end enterprise leviathan, and returning to public markets in 2018. Lenovo, meanwhile, methodically acquired IBM’s cast-offs (the PC division in 2005 and the x86 server business in 2014) to build a volume empire anchored in Asia. Each of these corporate decisions set the strategic trajectory that defines how they compete today.
This fits so well with my piece from last week that the pendulum never stays up.

The market often lazily groups them under “legacy hardware.” That is a mistake. Under the hood, their engines run on completely different physics. Three of them (Dell, HPE, and Lenovo) are competing head-on in the enterprise infrastructure market that AI is now reshaping. The fourth, HP Inc. (HPQ), has voluntarily exited that arena. Understanding why that matters is the first step to understanding the relative investment merits.
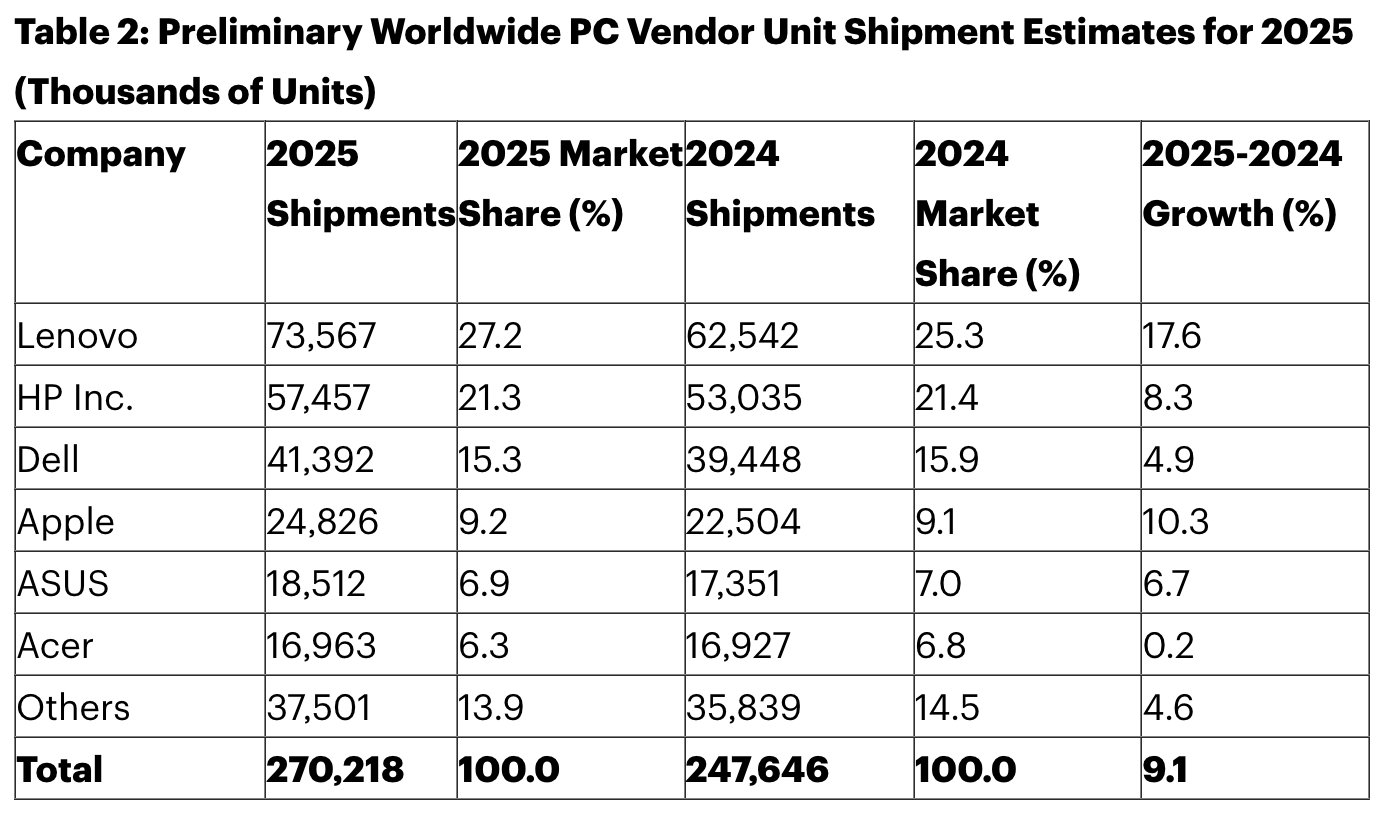
On the client side, Gartner’s data puts the PC market in perspective: in full-year 2025, the global PC ranking was Lenovo first, HP second, and Dell third and all three gained share year-over-year in a market that grew 9.1% for the year.
As of the end of 2024, Dell was also the world’s largest server manufacturer by revenue, with approximately 7.2% of the total global market. HPE sat in third place with 5.5%, and Lenovo was fifth at 4.9%.
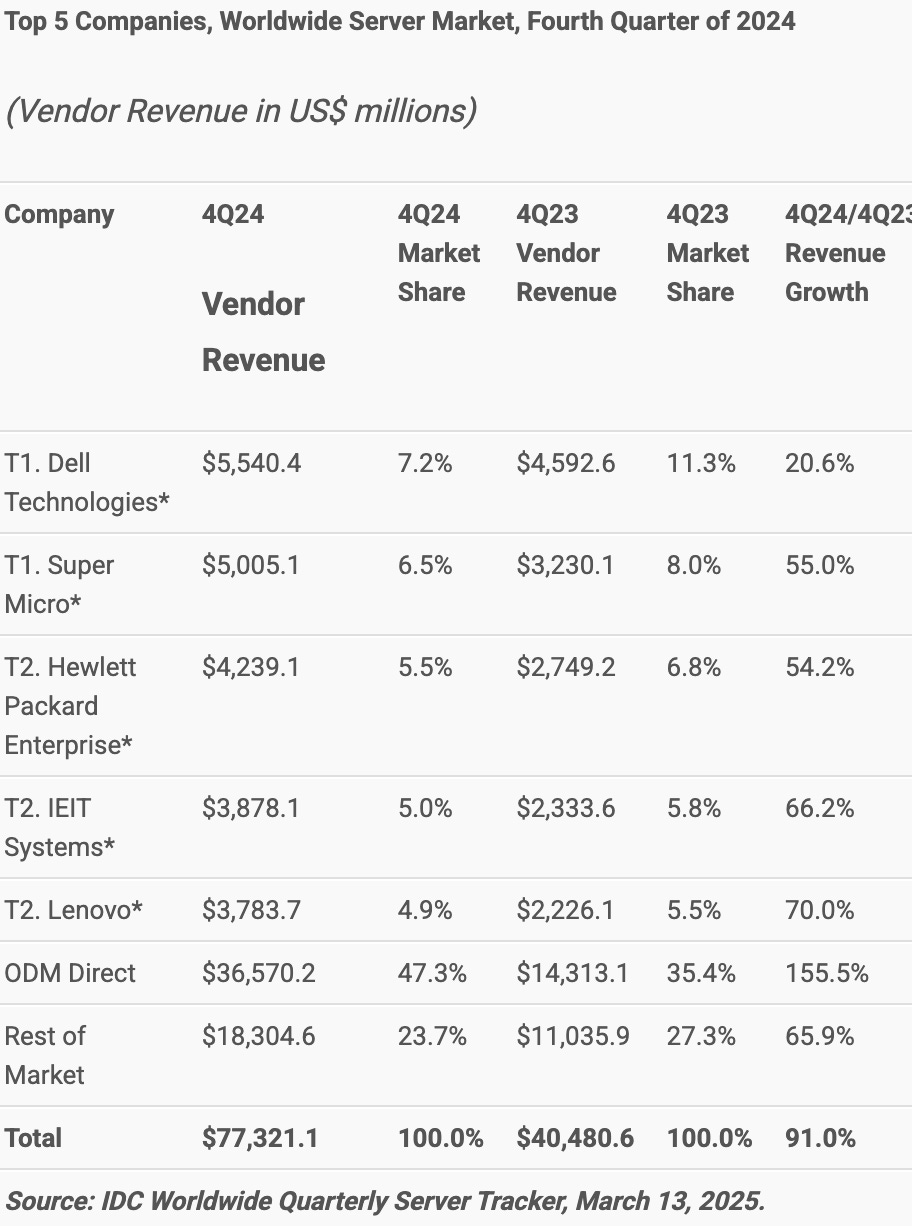
By Q3 2025, the picture had evolved further in Dell’s favor: Dell clearly led the OEM market with 8.3% revenue share, driven by outstanding growth in accelerated servers. HPE finished in fifth position with 3.0% share, and Lenovo and IEIT Systems were statistically tied for third with 3.6%–3.7% share.
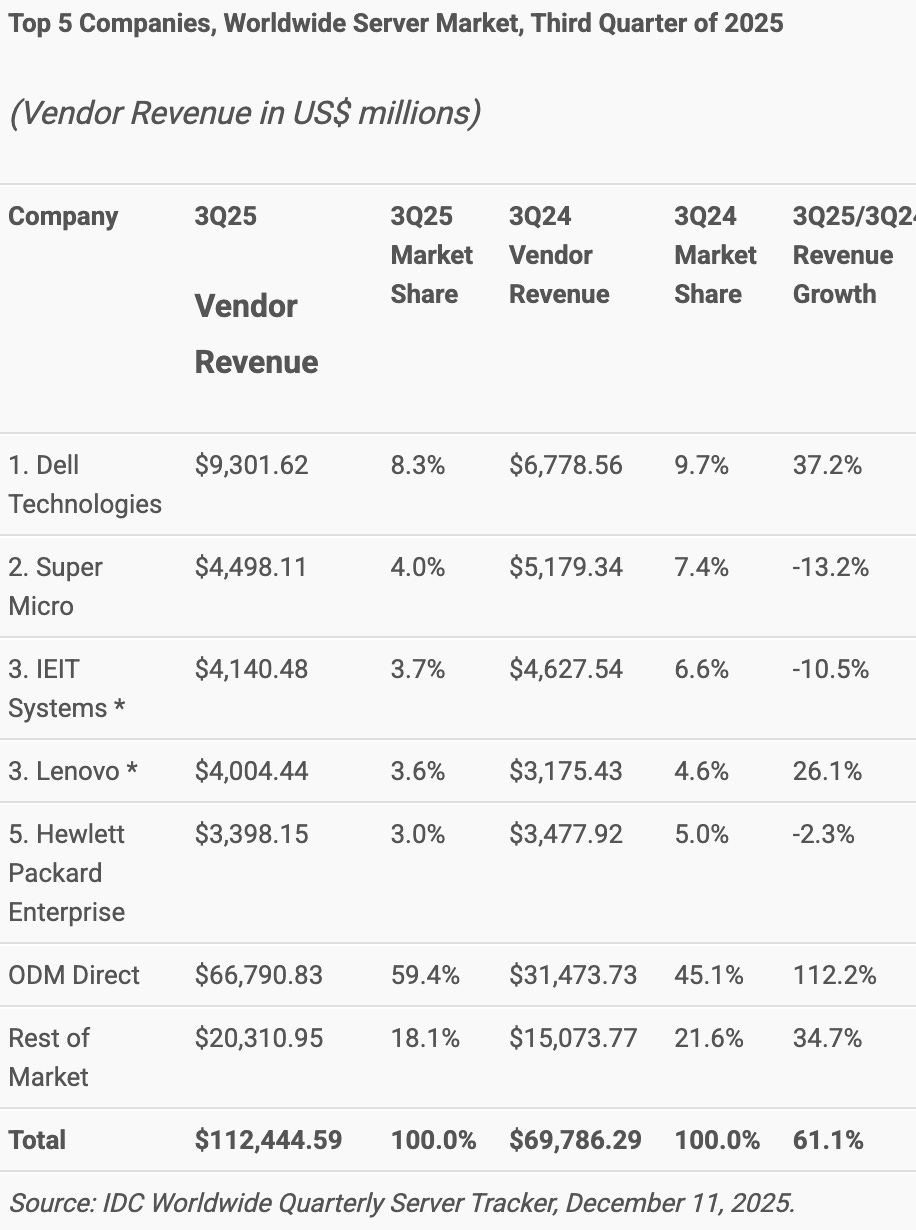
But PC share is not the thesis. The real difference is how each company converts volume into profit quality, cash conversion, and services attached and how exposed each one is to the AI infrastructure build-out. That trajectory matters more than any single data point. Dell gained server share. HPE lost it. Lenovo surged from a low base but remains sub-scale relative to the hyperscale ODM channel.
That is not an accident as it reflects deliberate strategic choices each company made over the preceding five years, and it is worth unpacking those choices company by company.
Dell (DELL): The Integrated Enterprise Operator, The Standard Everyone Else Is Measured Against
Before critiquing the peers, I want to be explicit about what makes Dell the benchmark. Dell is the only company in this peer set that operates as a truly balanced enterprise platform: clients through CSG, infrastructure through ISG, attached services, and embedded financing, all running through a unified commercial motion.
ISG is addressing AI, machine learning, analytics, and multicloud environments, and it calls out AI-optimized servers designed for training, fine-tuning, and inference.
The key operational differentiator is the go-to-market architecture. Dell sells directly and through channel partners, and it frames the direct model as a competitive advantage because it maintains direct communication with customers, providing insight to “navigate through supply chain challenges and complexity.”
At the same time, Dell is not pretending it’s a pure-direct company as other sales channels generated approximately 50% of net revenue in FY25. That hybrid model lets Dell compete across the enterprise, public sector, and mid-market simultaneously without losing the feedback loop that makes pricing and configuration decisions faster during supply volatility.
HPE (Hewlett Packard Enterprise): The Pivot That Is Still In Progress
What HPE Is Trying to Be
HPE is the most intellectually interesting of the three competitors because it is in the middle of a genuine business model transformation and the most directly comparable rival to Dell inside the data center.
The thesis at HPE is that the company can migrate from a traditional hardware vendor selling boxes to an as-a-service platform built around GreenLake, its consumption-based cloud infrastructure offering. The logic is sound: enterprise customers increasingly want to consume infrastructure the way they consume cloud.
HPE is betting that it can deliver private and hybrid cloud economics without requiring customers to send their workloads to AWS or Azure. GreenLake describes itself as a full-stack platform that “brings the cloud experience to all your IT,” spanning private and public environments. And for a certain class of enterprise buyer who wants opex flexibility and on-premises control, that is a genuinely compelling offer.
The GreenLake platform has shown real traction. By Q4 FY2025, GreenLake annualized revenue run-rate (ARR) had grown 62% y/y. Management noted that 80% of ARR now comes from software and services and not hardware consumption.
For a company that was, not long ago, primarily a server and storage hardware manufacturer, that is a meaningful pivot. The Juniper Networks acquisition adds a significant networking software and subscription layer to the GreenLake stack, which in theory should accelerate this trajectory and create a potential competitive weapon against Dell in enterprise accounts where networking control points drive the architecture.
HPE delivered full-year FY2025 revenue of $34.3 billion, a 14% increase y/y, with networking segment revenue growing 51% to $6.9 billion thanks to the Juniper contribution.
Where HPE Stumbles
The transition from hardware economics to software economics is genuinely hard, and HPE is attempting it while simultaneously managing margin compression in its core server business.
In Q2 FY2025, HPE’s non-GAAP operating margin was 8%, down 150 basis points y/y, with FCF of negative $847 million, a decline of $1.5 billion from the same period the year before. Server operating margins fell to 5.9% from 11.0% in the prior year. The combination of Juniper integration costs, restructuring charges, goodwill impairment in the Hybrid Cloud segment, and AI server margin pressure has put HPE’s income statement in an uncomfortable place.
HPE’s operating margin as recently measured stands around 1.47% on a GAAP basis, far below its five-year average of 5.57% and the broader market’s 18.25%. Net debt-to-EBITDA sits at approximately 5.83x, significantly above the market average of 1.26x. That leverage load is a real constraint.
For a company trying to fund a transformation, service a large acquisition, and invest in AI server capabilities simultaneously, the balance sheet provides less cushion than the GreenLake narrative implies.
How HPE Compares to Dell on the Metrics That Matter
The distinction between HPE and Dell becomes clearest when you examine three dimensions in parallel: channel structure, server margins, and market share trajectory.
On channel structure, the difference is stark and consequential. HPE discloses that two distributors alone represented approximately 14% and 11% of total net revenue in fiscal 2024, primarily in its Intelligent Edge and Server segments. That level of channel concentration means HPE does not get the demand signal as quickly as Dell’s direct sales force does. Dell’s direct model allows faster repricing and mix management. HPE’s channel-heavier approach has made it slower to respond to the cost volatility that AI server builds create.
The practical consequence is visible in real-time: when a hyperscaler or sovereign entity needs ten thousand AI servers deployed in a month, Dell’s agile supply chain wins the mandate. The complex, liquid-cooled rack integrations that define the current AI infrastructure ramp favor operators with tight feedback loops between demand signals and supply commitments. That is Dell’s direct model in action. HPE’s engineering heritage is real but converting that into commercial AI server scale at the velocity the market requires has proven harder.
On server margins, Dell’s ISG has consistently generated 12%–13% operating margins over the past three years. HPE’s server segment operating margin was 11.6% in Q4 FY2024 (broadly comparable to Dell at that point) but by Q2 FY2025, that had compressed to 5.9%. The divergence in trajectories is the story.
By Q3 2025, HPE had fallen to fifth place in the server market with 3.0% share, losing ground not only to Dell but also to Supermicro, IEIT Systems, and Lenovo. That is a disquieting trend for a company with HPE’s engineering heritage. The culprit is partly hyperscaler buying behaviour but it is also a reflection that HPE’s product cadence in liquid-cooled, high-density AI rack systems has lagged Dell’s.
HPQ (HP Inc.): The Cash Cow That Left the Field
A Different Animal Entirely
HPQ is essentially Dell’s Client Solutions Group stapled to a printing business, with no enterprise infrastructure exposure whatsoever. When HPE was separated from HP in 2015, the personal computing and printing assets became HPQ, while the enterprise infrastructure assets became HPE.
That split was designed to let each company focus, but the result for HPQ is a business with no on-ramp to the AI infrastructure cycle. HPQ is a consumer and commercial technology company. Its two segments (Personal Systems and Print) have nothing to do with AI servers, enterprise storage, or data center infrastructure.
In HP’s FY25, Personal Systems revenue was $10.4 billion with a 5.8% operating margin, and Printing revenue was $4.3 billion with an 18.9% operating margin.
That printing margin is worth underscoring. HP’s printer business is one of the most enduring examples of a razor-and-blades model in all of technology: sell the hardware at thin or negative margins, and capture recurring, high-margin supplies revenue over the life of the device.
For decades, the Supplies line (ink, toner, paper) has been an annuity stream that funded everything else. It is a masterclass in milking a mature market. The structural problem is that this annuity is shrinking. In Q3 FY2025, printing revenue declined 3.8% y/y, with consumer printing down 8% and commercial printing down 3%. Hardware units fell 9%, with printing operating margin at 17.3% toward the lower end of its historical range.
There is also a go-to-market reality that separates HPQ from Dell structurally. HP operates through a broad-based distribution strategy spanning retail, resellers, and distribution partners.
Its own 10-K calls out the operational downside of that structure: multi-tier distribution reduces visibility into channel inventory and demand signals, makes forecasting harder, and can limit the company’s ability to adjust prices quickly in response to competitors.
That is, almost word for word, the opposite of what Dell identifies as the competitive advantage of its direct model. When the market gets volatile and component costs spike, HPQ is flying partially blind on demand, while Dell is reading the signal directly from the customer.
Why HPQ Belongs In This Comparison Nonetheless
The reason I include HPQ in a peer comparison is that investors frequently conflate the two HP entities and, more importantly, because HPQ does compete directly with Dell in the commercial PC segment.
Dell’s CSG and HPQ’s Personal Systems segment operate in essentially the same market. The critical difference is what sits beside those PC businesses. HPQ’s second major business is printing, a structurally declining market.
Dell’s second major business is ISG, a server and storage franchise directly in the path of the AI capex cycle. Owning Dell gives you the same PC exposure as HPQ, plus a high-growth enterprise AI infrastructure runway. That asymmetry is not subtle.
HPQ will benefit from AI PCs and Windows refresh cycles, and premium AI-capable hardware has been helping Personal Systems average selling prices drift upward. But none of this creates a rack-scale AI infrastructure business. HPQ does not have Dell’s “ship the rack, attach the services, finance the solution” structure. When compute gets tight and costs move, Dell’s model is built to react faster. HP’s model is built to distribute volume.
The Capital Allocation Story
Where HPQ earns real credit is capital allocation discipline. In FY2024, HPQ returned $3.2 billion via repurchases and dividends, and in FY2025 it generated $2.9 billion of FCF, returning approximately 66% to shareholders through buybacks and dividends.
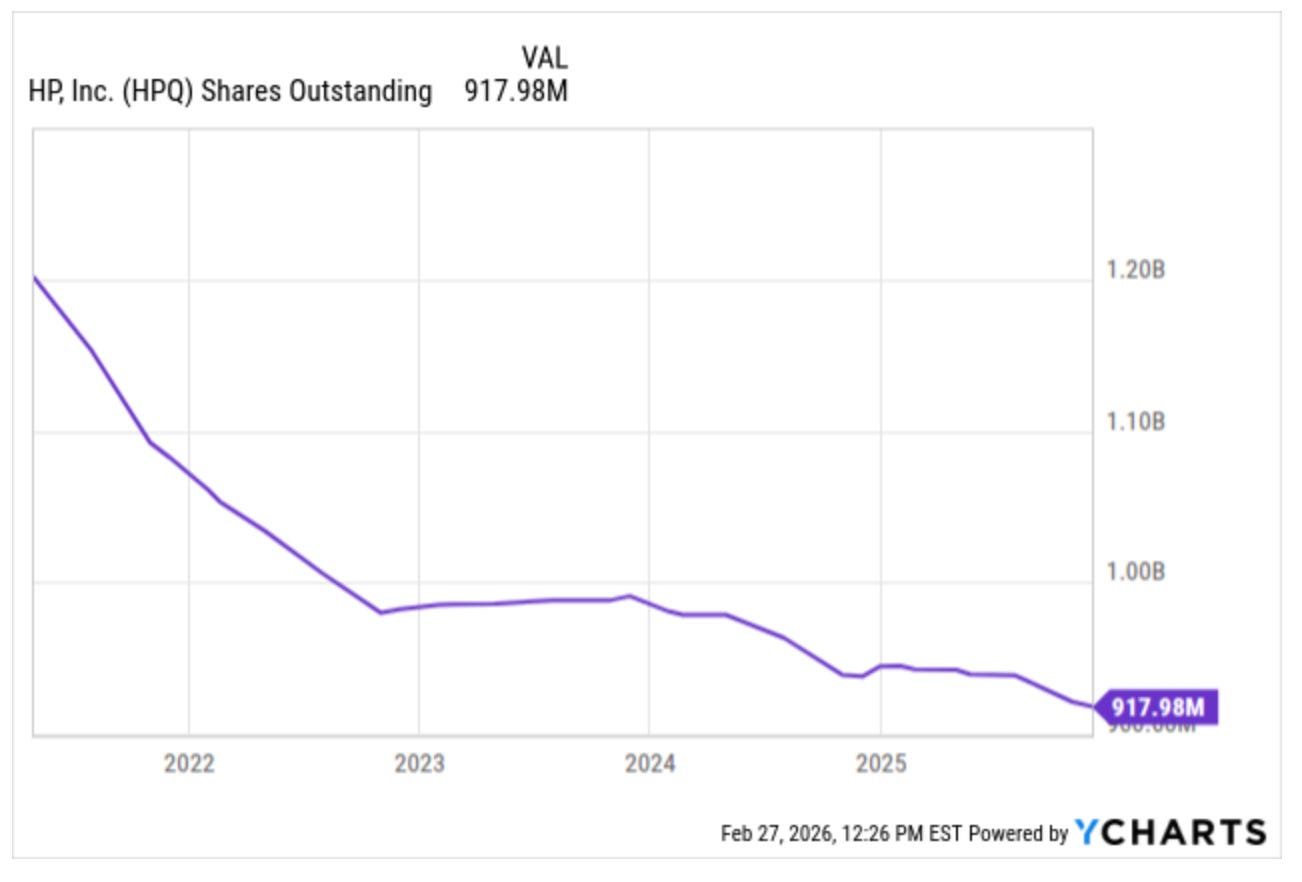
That is a disciplined program, but notably below Dell’s explicit commitment to return over 80% of adjusted FCF. HPQ’s balance sheet is less burdened by legacy acquisition debt, and the printing margins, while declining in volume, remain substantially higher than anything the PC business generates on its own.
Lenovo: The Global Volume Leader With a Margin Problem
A Company Running Three Businesses at Once
Lenovo is perhaps the most complex of the three peers to analyze because it is running three fundamentally different businesses under one roof, each at a very different stage of maturity and profitability.
The corporate architecture reflects its acquisition-led history: the IBM PC franchise gave it scale, the IBM x86 server business gave it an enterprise foothold, and a decade of internal investment has layered a services capability on top. The result is a company with genuine strategic ambition but thin financial tolerance for execution errors.
The Intelligent Devices Group (IDG) (what most people think of as “Lenovo”) is the largest PC business in the world by unit volume. IDG is the cash flow stability of the group, selling PCs, tablets, and smartphones across consumer and commercial channels globally.
In Q1 FY2025/26, IDG delivered revenue of $13.5 billion, up 18% y/y, with PC revenue growth of 20%. Lenovo explicitly describes its operational model as end-to-end integrated global operations and calls out its “ODM+” manufacturing model and “global resources/local delivery” approach as core competitive differentiators. That is Lenovo telling you that operational efficiency and scale are the center of gravity for the business. It wins on volume and cost, not on enterprise integration.
The Infrastructure Solutions Group (ISG) is Lenovo’s answer to Dell’s ISG and HPE’s server division. It is the most volatile and currently the least profitable piece of the business. ISG sells servers, storage, and data center infrastructure.
In Q2 FY2025/26, ISG revenue grew 24% y/y, with the cloud service provider (CSP) business reaching record quarterly revenue and liquid cooling revenue growing 154% y/y. The challenge is that ISG has been operating near or below breakeven, with profitability squeezed by AI server component costs. In Q3 FY2025/26, the company took a $285 million one-time restructuring charge in ISG, targeting annual run-rate savings of over $200 million, aiming to streamline the product portfolio and strengthen the go-to-market approach for sustainable profitability.
The Solutions and Services Group (SSG) is the strategic jewel and the part of Lenovo that deserves the most investor attention. SSG delivers managed services, device-as-a-service, infrastructure-as-a-service, and enterprise solutions. Lenovo’s TruScale platform (its “everything as a service” offering spanning devices to data center) is the clearest conceptual parallel to Dell’s payment and consumption options and HPE’s GreenLake.
SSG revenue grew 18% y/y in Q3 FY2025/26, marking 19 consecutive quarters of y/y revenue growth, with operating margin expanding 2.1 percentage points to over 22%. That +22% operating margin is extraordinary for a company with Lenovo’s hardware revenue base, and management has correctly identified SSG as the group’s transformation engine.
The Strategic Tension at the Core of Lenovo
Here is the central tension in the Lenovo story, and I say this as someone who respects the company’s execution: Lenovo has built a high-margin services flywheel in SSG, but it is being subsidized by, and strategically anchored to, a hardware foundation that carries the thinnest possible margins.
The group operating margin for Lenovo runs in the 3%–4% range on a consolidated basis. In Q3 FY2025, despite 20% top-line revenue growth, Lenovo’s overall operating margin declined to 3.7% from 3.9% in the prior year. IDG generates reasonable but commoditized PC margins, ISG is operating near breakeven while scaling AI servers, and SSG’s 22% margins are too small a percentage of total revenue to lift the consolidated number meaningfully … at least for now.
Lenovo’s go-to-market model in ISG also differs structurally from Dell’s in ways that matter for the AI build-out. Lenovo’s ODM+ model allows it to win on price in CSP channels, but it limits pricing power in the enterprise. Broader demand from smaller enterprises and sovereign entities may lead to fewer price concessions, specifically favoring “bellwether” OEM server providers. But the implication is that Lenovo’s CSP-heavy mix may not fully participate in the more profitable enterprise demand wave. Dell’s hybrid direct model is built precisely for that enterprise demand: deeper customer relationships, faster configuration adjustments, and the financing instrument to close complex deals. Lenovo’s ODM+ model is not.
Geopolitical Risk: The Variable No One Can Model
Lenovo is a Chinese-domiciled company listed in Hong Kong, with heavy manufacturing operations inside China and a significant revenue base in Greater China. In an era of intensifying US-China technology tensions, that creates risks that are qualitatively different from what Dell, HPQ, or HPE face.
Export control restrictions on advanced semiconductors, potential tariffs on China-manufactured hardware, and the reputational or regulatory risk of selling Chinese-branded infrastructure into Western sovereign and defence customers. US-based enterprises, federal agencies, and sovereign wealth funds building mission-critical AI data centers are increasingly hesitant to award massive infrastructure contracts to a company with deep Chinese manufacturing ties.
Dell’s status as a US-based, trusted enterprise partner gives it an unassailable geopolitical advantage in the West’s AI build-out.
Working Capital Efficiency
Dell clearly stands apart on working capital discipline. Its cash conversion cycle has remained deeply negative and structurally stable over time, meaning suppliers and customers consistently finance the operating cycle. That dynamic allows Dell to scale revenue without absorbing incremental capital, which is a material advantage in a hardware business ramping into AI.
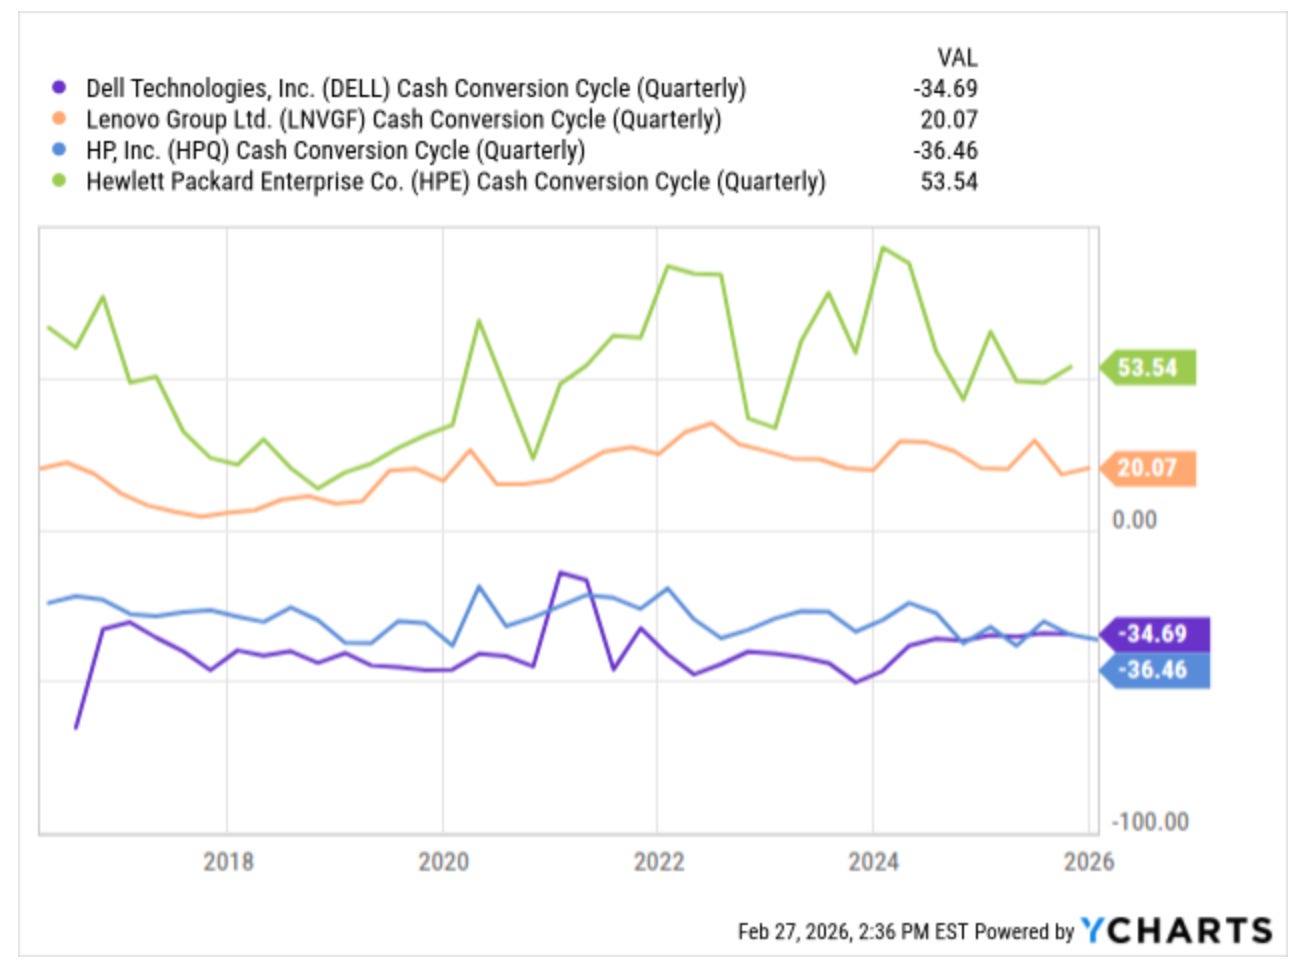
HPQ shows a similar negative cycle, but it is more modest and largely supported by the legacy print consumables model, where cash is collected ahead of costs. That source of strength is real, but it is gradually eroding as print volumes decline.
In contrast, Lenovo and HPE operate with persistently positive cash conversion cycles, making them net users of working capital during growth periods. The AI server ramp has reinforced this difference: Dell converts demand into cash, while peers must fund growth on their balance sheets.
Valuation
My base case fair value is $206/share. As promised, I am sharing my DCF. I tried to clean it up a bit.
Here are my main assumptions:
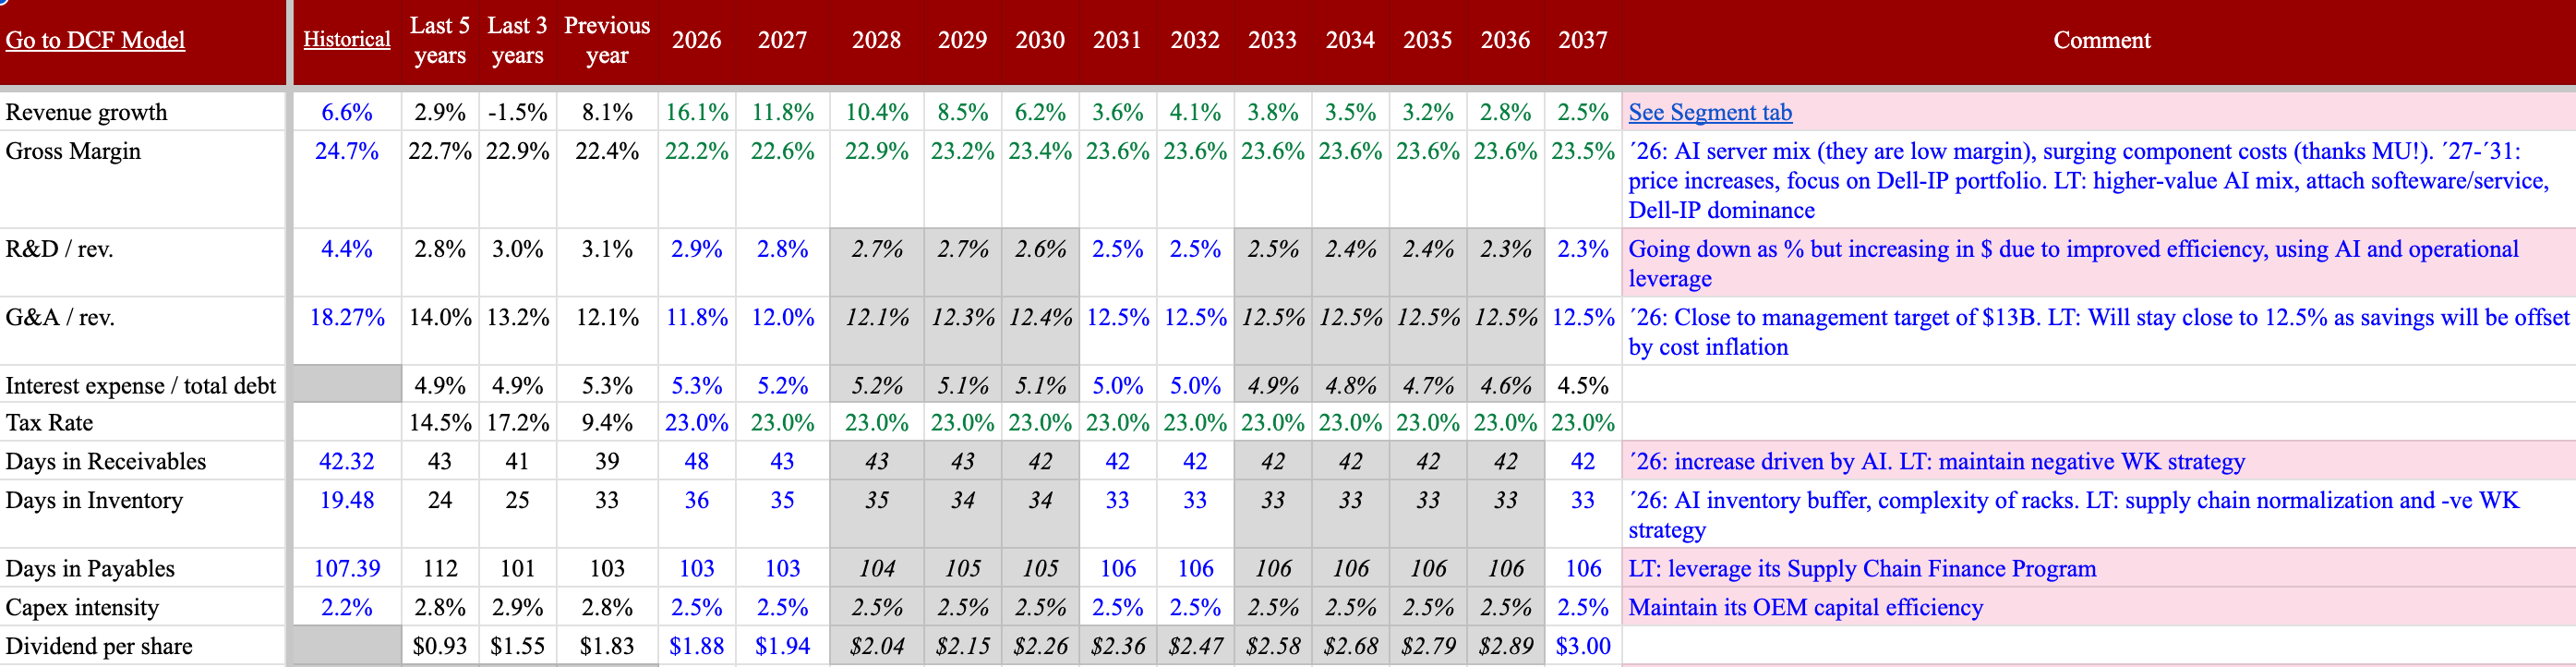
Revenue growth stays elevated in FY26 because AI shipments scale and ISG keeps growing. Dell’s FY26 revenue guidance midpoint implies 17% growth, so I am a bit more conservative at 16.1%.
Gross margin stays compressed near-term due to AI mix and component cost pressure, then improves as pricing and mix normalize, and higher-value storage and services attach. Dell explicitly attributes gross margin compression to AI mix and competitive pricing.

Operating leverage shows up because Dell runs a massive cost base and keeps pushing efficiency. FY25 already shows operating expenses falling as a percent of revenue while ISG grows.
Short-term working capital dynamics can hurt cash flow during big AI ramps, but the long-term model aims to keep a negative cash conversion structure.
Capital return boosts per-share value: Dell targets returning over 80% of adjusted free cash flow, explicitly through repurchases and dividends.


Core discount inputs (base case)
WACC: 8.6%
Unlevered beta: 1.31 (cash-adjusted)
Terminal growth anchored at 2.5% (aligned with a mature, GDP-ish glide path)
Key risks
Risk #1. Execution risk in AI delivery
The single biggest risk in the AI narrative is that orders and shipments do not move in lockstep. Dell has already shown that demand can outrun supply. As we already have already witnessed, demand for AI‑optimized servers outpaced the supply of GPUs, which left backlog elevated exiting FY24, and it says backlog remained elevated exiting FY25 as strong demand continued.
That matters because it means the limiting factor can be component availability, not customer interest. It also means reported results can swing based on what Dell can actually build and deliver in a given quarter, not just what it sells.
Even when parts arrive, delivery still depends on customer readiness. AI deployments often require power, cooling, networking, and facilities work that sits outside the server purchase order. When those prerequisites slip, shipments can slip, acceptance can slip, and revenue timing can slip. Power availability and grid connection have already caused delays for data centre expansion, even when demand remains strong.
Risk #2. AI margin compression
AI can absolutely grow revenue while making the business less profitable, at least in the near term. Dell management has been clear that AI server economics are currently thin. On the Q3 FY26 call, Jeff Clarke said AI server margins were back in the “mid single digits,” framed it as the operating range Dell expects to sustain, and described how unusual cost volatility in components has been.
Dell also flags, in its FY25 10‑K, that it expects margin rate pressure from mix shifting toward AI‑optimized servers, alongside a competitive environment that forces disciplined pricing decisions. The combination is the risk: you can win the footprint and still lose the economics if component costs rise faster than pricing, or if competition forces you to “buy” share with aggressive deals.
There’s also a structural margin risk tied to customer mix. Dell explicitly warns that sales of AI to large customers can create volatility because large orders may occur in some periods and not others, and those orders are generally subject to intense competition and pricing pressure that can hit margin and operating results.
Risk #3. Competitor rack-scale integration and disintermediation
The AI server market is not just competitive, it is evolving toward rack‑scale architectures where the line between “chip company,” “system company,” and “integrator” gets blurry.
This is why vendor vertical integration matters. On the Q3 FY26 call, an analyst explicitly asked about NVIDIA moving further up the supply chain and what that could mean for Dell. Dell argued that the real value add sits at the rack level and solution level, where deployments are complex and require engineering, services, and integration around power density that can rise toward 500kW per rack and beyond. The risk is not that Dell has no answer. The risk is that the answer must stay true as architectures standardize and chip vendors push more turnkey designs into the market.
You can see the industry direction in NVIDIA’s own messaging. NVIDIA describes the GB200 NVL72 as a rack‑scale, liquid‑cooled design that effectively packages an “exascale computer in a single rack,” and it promotes reference architectures to accelerate system design. Dell itself has announced rack‑scale offerings with NVIDIA, including a rack‑scale, high‑density, liquid‑cooled architecture based on Grace Blackwell, which shows how tightly the stack is coupled to the GPU roadmap. The disintermediation risk is that large buyers increasingly source infrastructure through non-traditional channels.
Major Infrastructure‑as‑a‑Service providers often buy infrastructure directly from ODMs, which can increase competitive pressure on OEMs. A credible third‑party data point reinforces that this is not hypothetical: Omdia projected that Foxconn’s ODM direct business would surge on AI‑optimized server demand and overtake Dell in global server market rankings, explicitly driven by major cloud providers’ capex concentration.
Risk #4. Working-capital snapback
Dell’s negative working capital model is part of the bull case, but it can reverse in exactly the moments when the business is growing fastest. To meet growing demand and increasing complexity of AI‑optimized offerings, it increased purchases of certain components, which raised inventory levels, increased purchase obligations, and created “new working capital dynamics.”
Operating cash flow in FY25 was driven by profitability but partially offset by working capital dynamics, and it attributes those dynamics primarily to AI, which led to higher inventory, accounts receivable, and accounts payable. This is the risk as the cash machine can sputter when Dell needs to pre-position parts, build buffers, or carry more in‑process inventory to deliver complex systems.
The second layer of risk is what happens if the cycle shifts during that buildup. Larger orders may require greater commitments of working capital for key components, which can hurt cash flow and expose the company to holding excess or obsolete inventory due to delays or cancellations.
That’s the ugly version of the story: you buy ahead, the customer pauses for power or facility reasons, the bill of materials changes, and suddenly inventory turns into write-down risk instead of ROIC fuel.
Risk #5. Debt constraint and refinancing risk
Its debt is manageable, but it is large enough to matter, and the maturity ladder creates real calendar risk. Debt principal is $24.8B and shows the maturity schedule, including $5.2B due in FY26 and $6.4B due in FY27.
That’s a meaningful wall in the near term. If credit markets tighten or spreads widen at the wrong time, refinancing can become more expensive, which directly reduces free cash flow available for buybacks and dividends.
Risk #6. Accounting and controls
The supplier credits issue is a real risk because it touches the exact part of the P&L that can be hardest to audit in a hardware supply chain: vendor programs, credits, rebates, and procurement economics.
Dell disclosed it discovered accumulated credits from suppliers that were not recorded or were recorded in the wrong period, tied to the actions of certain employees supporting a limited number of suppliers. Dell said the issue impacted the CSG segment and overstated COGS by $200 million in FY24 and $148 million in FY25 for the nine months ended Nov. 1, 2024, and it revised prior period financial statements to correct the misstatement.
Even if the dollar amounts are not existential for Dell, the reputational and governance implications matter. Small percentage shifts can meaningfully move margins in a low-margin business.
More importantly, the related SEC 8‑K includes a specific internal controls conclusion that raises the bar for scrutiny. Dell disclosed that management concluded a material weakness existed in internal control over financial reporting as of Jan. 31, 2025 (and existed as of Feb. 2, 2024), relating to the approval, communication, and recording of non‑recurring credits owed from certain suppliers, and said it had begun implementing remediation changes. This creates two risks I take seriously: first, the potential for future surprises if remediation fails; and second, the possibility that heightened control processes slow procurement agility at a time when component strategy matters.
Verdict
I see Dell as a unique operator playing at the centre of the AI infrastructure build-out. I like the setup because Dell already has demand, already has an execution playbook for ugly supply cycles, and already runs an explicit shareholder return framework.
At today’s price, my base case targets a return profile that comes from two sources: the business compounding and the share count shrinking. The stock does not need perfection. It needs Dell to keep doing the boring things well, at scale, while the world buys more compute.